#webmap
Explore tagged Tumblr posts
Visit Tumblr Blog
Explore Tumblr blogs with no restrictions, modern design and the best experience.
Last Seen Tumblr Blogs


Fun Fact
Women make up for the other 50% of Tumblr’s audience.
Text
WEB Map has designed and manufactured an innovative Mobile Work Access Platform suitable for access to difficult work areas with several unique features.
0 notes
Text
Mastering WebMAP: Your Comprehensive Guide to Data Mapping and Display
Introduction Mastering the WebMAP is a comprehensive guide that equips you with the skills to map and display data effectively. This tutorial will help you understand the intricacies of data mapping and visualization, enabling you to create engaging, informative, and interactive maps. What you’ll learn: Understanding core concepts and best practices in data mapping and visualization Hands-on…
0 notes
Text
Northeastern Illinois Air Photo Archive and Webmap
The Chicago Metropolitan Agency for Planning (CMAP) maintains a large and comprehensive collection of aerial photographs for the northeastern Illinois region dating from 1970 through 2001. The archive numbers some 6,300 images that cover six counties. The photographs are black and white half-tone enlargements printed on a translucent mylar base measuring 34″ x 34.” Each image covers…
0 notes
Text
0 notes
Text
this is a webmaps of only 800 of the reblog chains. this is why you reblog.
62K notes
·
View notes
Video
youtube
Do you want to know how you can ADD NEW FONTS or CHANGE DATA DIRECTORY in geoserver?!🤔 For more information, feel free to watch the tutorial on my YouTube channel. #geoserver #webmap #datadirectory #fonts #webservices
0 notes
Text
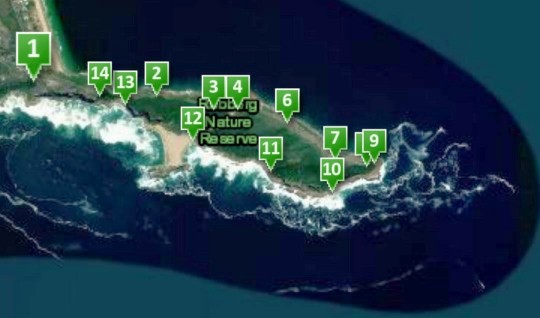
The beautiful Robberg Peninsula in South Africa. Learn how to make this webmap here
youtube
youtube
1 note
·
View note
Text
Web Map: Philadelphia Public Art
Hi Everyone! Here is my GitHub URL so that my web maps can be accessed:
For each web map I post, I will provide a post to announce it. So here is my first collection of web maps, it includes three web maps focusing on the different fields of a dataset I found on OpenDataPhilly that shows public art in Philadelphia. The fields include: Neighborhood, Medium and Year of Creation. All these maps were created using Leaflet. The code is also featured on the GitHub under 'index'.
The Philadelphia Public Art GeoJson was copied and pasted into leaflet and saved as a JavaScript file(.js). From there I pretty much filtered down the neighborhood field to only include Center City, Poplar and University City. Each neighborhood had a separate filter. In the pop ups I included the title of the work, name of the artist, and year it was created.
Using the same JavaScript file, I created the medium map. This is probably my favorite of the three, since I really like the colors behind it. When you click on a piece of art, it provides you with the title, artist name, year, medium and location.
The final map is by year, and it's similar to the art medium map, but just has three categories: before 1970, 1970 to 1999 and then 2000 to present.
This project was my final for my Web Mapping class (which I enjoyed more than I thought, since I had zero programming experience going into the class). Originally, I wanted to create an interactive map of the income and test scores I completed for my Cartographic Design (see the post below this), but after some trouble with the GeoJson, I found this dataset and really enjoyed working on it. I've always loved art, and it was refreshing to work on a map about art!
Learning how to publish my maps was hard. I went through about 3 different tutorials on how to publish on GitHub. In the end, I found a template that was the most user-friendly!
Neighborhood:
Medium:
Year:
0 notes

Photo

MAPPE DEL PARCO/3 E' online le webmap dei "Sentieri CAI", con info tecniche sui percorsi, descrizione (fonte: CAI Castrovillari) e foto delle tappe. • • • • • • • • • • • • • • • • • • • • • Visualizza le mappe sul sito: http://igerspollino.tumblr.com/maps • • • • • • • • • • • • • • • • • • • • • #igerspollino #cai #pollinonationalpark #parconazionaledelpollino #pollino #parconazionale #calabria #basilicata #park #webmap #mapping #italy #gis #discoversouthitaly #data #natureloversgallery #nature #landscapes #parconaturale #territorio #info #map #social #sentieri #trekking #mountains (presso Timpa Di San Lorenzo)
#mountains#mapping#territorio#natureloversgallery#parconazionaledelpollino#cai#webmap#pollino#gis#info#map#sentieri#landscapes#trekking#parconaturale#pollinonationalpark#nature#discoversouthitaly#igerspollino#data#park#calabria#basilicata#social#parconazionale#italy
2 notes
·
View notes
Photo
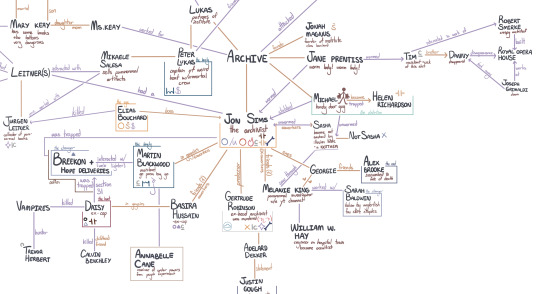
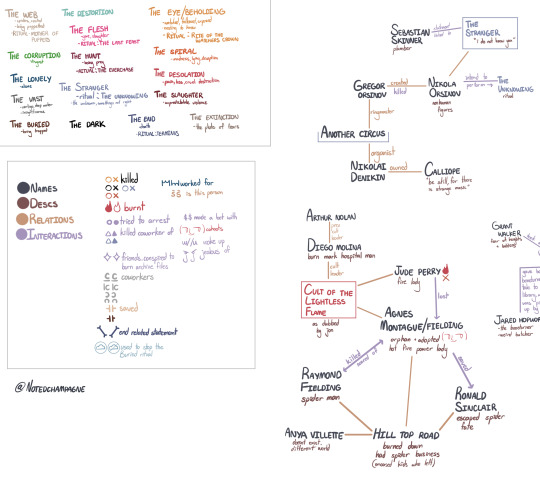
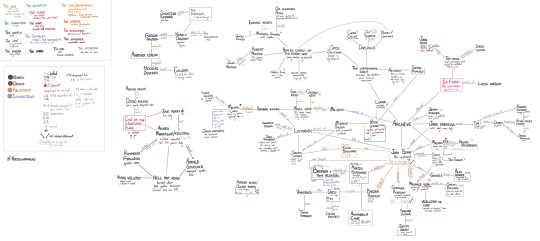
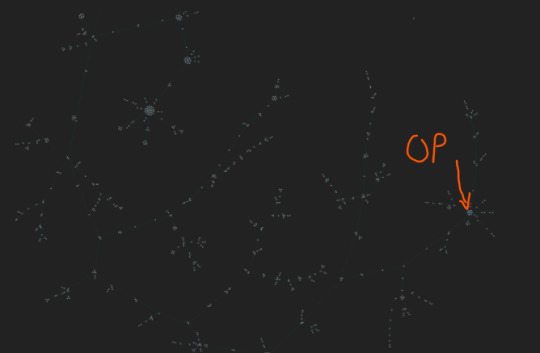
i forgot to post this lmao but i made a tma net! to keep track of names etc and i KNOW the quality in this is bad so i have a link to it w better quality over here. ill probably update this every once in a while
373 notes
·
View notes
Text
Easily create appealing web maps using the HTML Image Map Creator plug-in for QGIS
Introduction
Today's Internet allows for a high degree of interactivity, but a simple web map often achieves a better effect on the reader. This is confirmed by Brian Timoney in his blog post entitled "Few Interact With Our Interactive Maps ...". With the "HTML Image Map Creator" plugin for QGIS, an aid is to be presented here in order to easily design such web maps.
QGIS is a desktop software, an open geographic information system for the visualization of geo data. QGIS can be easily extended with so-called plugins, whether as a user or as a programmer. With the "HTML Image Map Creator", a user with QGIS can create a simple web map. He can freely choose which basic map and what information he wants to portray.
As an example, we created a web map showing where you can rent “Pedalos” (paddleboats) around Lake of Zürich (figure 1). This map is intended for online publications, but can also be used in printed form.

Figure 1: Map with pedal boats for rent around the Lake of Zurich (Switzerland).The map style "Gray" from Wmflabs serves as the base map. Pedalos (paddleboats) and map data are from the OpenStreetMap project. (Copyright: Geodata © OpenStreetMap contributors ODbL, Kartengrafik © Wmflabs CC-BY-SA).
This map containing markers with labels would ready be ready for printing. For the browser, though, we will add some interactivity (just with little HTML5 code without big Javascript libraries): There you can click on a marker and an "Infobox" opens (figure 2). In our case, this information box contains information consisting of the following fields: "name" (bold), "contact: phone", "website" and "opening_hours". More on that later.

Figure 2. Infobox to a pedal boat rental site after clicking on a marker (blue drop icon).
For our map, we need two "layers": a background for orientation in the form of a basic map and the actual thematic data, which will then be displayed as markers with "label" and/or "infobox". The following describes the creation of the base map and the thematic layer.
Basemap
First, start QGIS. If QGIS is not already installed, you can download it (works on all platforms). Once QGIS has been started, we take care of the base map. The plugin "QuickMapServices" helps us here (see menu Plugin => Manage Plugins...). Once the plugin has been installed, you can access it via the Web menu or by clicking on the corresponding icon (blue, round). For our example, we used the map "MapSurfer OSM Roads Grayscale" (Menu Web => QuickMapServices => MapSurfer.NET). There are also other possibilities such as "OSM Outdoor" or other base map styles.
Thematic layer
Now we want to supplement the QGIS project with the actual thematic data, the rental pedal boats. Ideally, the data is already available. If this is not the case, one must create it. That is what we want to do now.
With OpenStreetMap (short: OSM), a useful data source is freely available. It contains hundreds of kinds of "Points of Interests" (POIs), such as shops, benches, viewpoints, etc. If the POIs are not already available, you can enter them yourself in OpenStreetMap.��This allows the data to be verified and supplemented by others and later be reused.
Pedal boat rental amenities are attributed in OpenStreetMap with "amenity = boat_rental" and "pedalboat_rental = yes", which are supplemented with the fields mentioned above (name, contact:phone, website and opening_hours).How to capture such POIs in OpenStreetMap, can be learned on the Wiki or in this example .
After capturing the data in OpenStreetMap, you can for example use the webapp Overpass Turbo to download the desired data. First, you can use the zoom and pan to narrow the map region - here it’s the Lake of Zurich. The simplest way of fetching the data is to use the built-in wizard. There you can enter a "tag" which you want to filter, here "pedalboat_rental = yes". Once you have fetched the data, you can click on "Export" to download the filtered data in the file format "GeoJSON" (here a GeoJSON example ). After the export, it is recommended to rename the file, for example to “rental-pedalos.geojson”.
The GeoJSON file has to be inserted into QGIS as further preparation, which can be achieved by simple Drag & Drop. Let’s call the layer "rental pedalos". You may have to adjust the coordinate reference system to the data in the lower right corner of QGIS, for example "EPSG: 3857". QGIS provides a nice marker (blue drop icon) for symbolizing dot objects.
Furthermore, you should note that the labelling in QGIS should be turned off, since the labelling of the POIs is done by the plugin.
Ready to export, but...
Now the static map is already done! It can be printed and exported with a "Print Screen" or with the built-in QGIS Print Composer (for example in PNG or JPG format). Note that since everything is "packed" into a single raster graphic, the markers are contained in the graphics as well.
Since the output is a pure raster graphics, it is hardly possible to apply changes later. If you want to customize the labels size or colour with CSS, the HTML Image Map Creator plugin described below comes into play.
If you want to bring some interactivity (with simple Javascript) into the game with informative infoboxes, then read the following chapter. This is not mandatory and can be skipped.
Compiling information for the infobox (create virtual field)
The HTML Image Map Creator plugin, whose configuration is explained in the next chapter, expects a single field from the list of all fields / attributes of a layer / table for labels and infoboxes. In the case of the infobox, the content can be formatted in HTML text, including bold text, line breaks, weblinks or bullets. With some skill, QGIS can now combine several fields (attributes) of a table. If necessary, add HTML markup and place the result as text in a so-called "virtual" field.
To add a virtual field to the fields of a layer (such as the rental pedal boats), use the field calculator in QGIS (see figure 3).

Figure 3: An abacus as a symbol of the field calculator in the QGIS toolbar.
In the field calculator dialog (figure 4) you have to activate the checkbox "Create new field" and the checkbox "Create virtual field". Let's call the virtual field "infobox". Then select the data type "Text (string)" in the "Output field type" dropdown. The output field length is set to 255 characters, which means that longer character strings are truncated there.
In the middle of the field calculator dialog there is a large, empty text field in the "Expression" tab. This is an editor, which expects expressions as text code. Following, you can see the finished expression code, which can be used for our infobox and can be inserted with Copy & Paste in the expression editor (note that this is a single continuous line without line breaks):
'<b>' || "name" || '</b>' || '<br>' || '<br>' || "contact:phone" || '<br>' || coalesce('<a href =' || "website" || '>' || "website" || '</a>', 'No website') || '<br>' || coalesce( "opening_hours", 'No opening hours')
Here is a brief explanation of this expression code:
The HTML tags (here: '<b>', '<a href>' and '<br>') are enclosed with single quotes
The fields / attributes (here: "name" etc.) are enclosed with double quotes
The HTML tag <b> title </ b> represents "title" in bold
The HTML tag <br> without closing tag generates a line break
The HTML tag <a href> defines a weblink, which can later be clicked in the browser
|| Connects the string to each other (concatenate)
Coalesce (x, y) is a built-in function that tests the value "x": if this is "null", "y" is returned instead, here: if the field “website” is null, “No Website” will be returned.
If you would like to learn more about the powerful expression functions in QGIS, these workshop documents are recommended.

Figure 4: Field calculator with the expression that fills the additional virtual field "infobox" with HTML text.
HTML Image Map Creator
Now we are almost ready to create the web map. If desired, a subset of objects can be selected in the QGIS map view, which should appear as a marker on the map later.
In any case, a suitable layer has to be selected as active layer in QGIS, before the HTML Image Map Creator is selected (here the rental pedal boats layer). Valid layers are vector layers of type Point (Point or Multi-Point) or Surface (Polygon or Multi-Polygon).
If all these preliminary workings have been done, the plugin can be opened in QGIS via the Web => HTML Image Map Creator => Create map ... menu.
The HTML Image Map Creator consists of a single configuration dialog (see figure 5). In the upper part of the dialog, you will find a short description. Below are the different information and configuration fields, which are explained in more detail in the next section.

Figure 5: Configuration dialog of HTML Image Map Creator in QGIS.
The configuration dialog
The first field in the dialog is an information field that displays the size of the map view, which means the visible map section in QGIS. These pixel values must be adapted to the layout of the publication - for example 800 pixels wide and 600 pixels high - by leaving the plug-in, adjusting the map view, and then re-opening the plug-in.
The second field "Active layer" is also an information field. It shows the name of the active layer . In addition, the number of objects in the layer is displayed to the right of the text field. This also includes objects outside the map view.
The third field is responsible for naming and selecting the location of the files, which are to be generated. Using the "Browse" button, the user can decide where to save his files and how to name them. All files are saved with the same path. Choose e.g. name “Pedalos-Rental“.
The fourth field is a checkbox and a drop-down list. The checkbox determines whether the object is labelled on the map. The user must select a field of the layer. The label is placed in the middle of the marker.
The fifth field is for label placement. Positive offset values result in a downward displacement, negative offset values result in upward displacement.
The sixth field has to be activated by ticking of a checkbox, just like "Label". It activates the infoboxes in the export. Again, you have to choose a field of the layer. We recommend creating a virtual field in the QGIS field calculator (see above). If you have not already done so, you must leave the plug-in and open it again when the virtual field is ready.
The seventh field is for infobox placement. Positive offset values result in a downward displacement, negative offset values result in upward displacement.
The eighth and last line shows a "Selected features only" checkbox and a small statistic. The checkbox determines whether only the selected objects are exported.��The small statistics shows how many objects were selected in the layer and how many of these objects are within the map view.
After the user has filled out all fields, the OK button, which starts the export, can be pressed at the bottom of the dialog.
If the export was successful, the following three files will be created:
Pedalos-Rental.html: includes the HTML5 code (HTML, CSS, Javascript) including the image map data of the POIs.
Pedalos-Rental.png: is a raster graphics file; It contains the basic map and is called by HTML file.
Pedalos-Rental.pgw: Is an auxiliary file, which is mainly read by geo information systems to process the map ("Worldfile"). It can be left out in pure publications.
These files (especially the .png file and the corresponding code section in the .html file) can now be embedded in a separate blog post and adapted if necessary. You can also only use the graphics file Pedalos-Rental.png.
In any case, it is up to the author to design an informative map by any means available to QGIS. Now, nothing is preventing an informative summer story!
P.S. The HTML Image Map Creator QGIS plugin is open source and has been written in Python. Feedback and other software contributors are welcome!

Figur 6: A cooldown for the hot summer days: rental pedal boat in the Lake Zurich.
2 notes
·
View notes
Text
Webmap design sample

#Webmap design sample update#
#Webmap design sample archive#
Google find and understand video and image files, or news articles, on your site. Or news pages that you want to show in search results.
You don't have many media files (video, image).
This means that Google canįind all the important pages on your site by following links starting from the homepage.
Your site is comprehensively linked internally.
(Only pages that you think need to be in search results count toward this total.) By small, we mean about 500 pages or fewer on your If provided, Google can take additional information from sitemaps into
Your site has a lot of rich media content (video, images) or is shown in Google.
Might not discover your pages if no other sites link to them. Googlebot and other webĬrawlers crawl the web by following links from one page to another.
Your site is new and has few external links to it.
List them in a sitemap to ensure that Google doesn't overlook some of your pages. If your site pages don't naturally reference each other, you can
#Webmap design sample archive#
Your site has a large archive of content pages that are isolated or not well linked.As a result, it's more likely Google webĬrawlers might overlook crawling some of your new or recently updated pages. The items in your sitemap will be crawled and indexed. Even so, a sitemapĬan improve the crawling of larger or more complex sites, or more specialized files.Ī sitemap helps search engines discover URLs on your site, but it doesn't guarantee that all Of navigation, be that your site's menu or links that you placed on pages. Proper linking means that all pages that you deem important can be reached through some form If your site's pages are properly linked, Google can usually discover most of your site. Made a sitemap available to search engines If you're using a CMS such as WordPress, Wix, or Blogger, it's likely that your CMS has You can use a sitemap to provide information about specific types of content on your pages,Ī sitemap video entry can specify the video running time, rating, andĪ sitemap image entry can include the location of the images included in a page.Ī sitemap news entry can include the article title and publication date. Think are important in your site, and also provides valuable information about these files.įor example, when the page was last updated and any alternate language versions of the page. A sitemap tells Google which pages and files you Search engines like Google read thisįile to crawl your site more efficiently. Their monthly reports are also extremely valuable to us.A sitemap is a file where you provide information about the pages, videos, and otherįiles on your site, and the relationships between them.
#Webmap design sample update#
We regularly update our page layouts and content to improve conversions, and they're always quick to implement changes we request. We're seeing new leads on a daily basis, making the new site one great investment.” - John Doe, Happy client built a new site from the ground up, and we're extremely happy with it. It didn't work on mobile, and I don't think it ever generated a lead for our sales team. Rather than simply telling you how dedicated and skilled the team is, I'd like to offer you a few examples of what our past web design clients have had to say about us: Nothing is more precious to us than an encouraging word from one of our clients. We've included all necessary terms of agreement at the end, and your electronic signature turns it into a binding project, allowing us to move forward with your web design project immediately. To make things simple for you, this proposal doubles as an executable contract. I've included a lot of detail in this proposal, because I want to make it abundantly clear that is the best web design company in business today.You'll find details regarding the functionality of your future website, our web design process, testimonials from past clients, and detailed project pricing. We're committed to helping your brand stand out in a crowded market, against a sea of hungry competitors. After all, our clients' satisfaction is what keeps our doors open, and helping you stand out is the best way to make sure you're completely satisfied. Our mission to stand out doesn't stop with our internal goals. We stand out as a web design company by insisting on pushing the boundaries of website performance, and by delivering work of the highest quality on-time and on-budget. I cannot understate how much we appreciate being able to put this proposal in front of you today.Īt we believe in standing out. There are thousands of companies offering these services that you could have chosen, and yet here we are, with an opportunity to earn your business. On behalf of the entire team here at, I want to thank you for the opportunity to earn your business as your provider of web design services.
0 notes
Text
0 notes
Video
youtube
Getting to know GeoServer, OGC standards and GeoSpatial web services
In this tutorial, we'll learn you how to use geoserver software to create geospatial services and how to provide geospatial web services from data and aerial, satellite or UAV images.
1 note
·
View note