#Bullish candlestick pattern
Explore tagged Tumblr posts
Visit Tumblr Blog
Explore Tumblr blogs with no restrictions, modern design and the best experience.
Last Seen Tumblr Blogs


Fun Fact
In 2020, Tumblr had 29.4 million users in the US.
Text
How to Trade the Three White Soldiers Pattern: Strategies and Examples
Technical analysis offers traders a wide range of candlestick patterns to predict price movements. One of the most reliable and bullish reversal patterns is the Three White Soldiers. This pattern, when used correctly, can signal a strong trend reversal and provide profitable trading opportunities. In this post, we’ll explore what the Three White Soldiers pattern is, how to identify it, and…
#Best strategies to trade the Three White Soldiers pattern#breakout trading patterns#Bullish candlestick pattern#Bullish Reversal Pattern#bullish trend reversal#candlestick chart patterns#Candlestick pattern confirmation#How reliable is the Three White Soldiers candlestick pattern#How to identify Three White Soldiers on a chart#How to trade Three White Soldiers#How to use RSI with Three White Soldiers pattern#Identifying Three White Soldiers#Intraday trading strategy using Three White Soldiers#Japanese candlestick patterns#learn technical analysis#Price Action Trading#Risk Reward Ratio#stock markets#stock trading#Stop Loss Strategy#successful trading#support and resistance zones#technical analysis#Technical analysis candlestick patterns#Three White Soldiers candlestick#Three White Soldiers candlestick pattern in stock trading#Three White Soldiers confirmation#Three White Soldiers pattern#Three White Soldiers pattern example#Three White Soldiers pattern with volume confirmation
0 notes
Text
Bullish Marubozu: An Important Signal for Uptrend
Among candlestick patterns in market analysis, the Bullish Marubozu candlestick is a bullish indicator that is simple to understand and very effective. Unlike other candlesticks, which may show shadows or wicks, the Bullish Marubozu is unique in its simplicity—it has no shadows.
What Is the Bullish Marubozu?
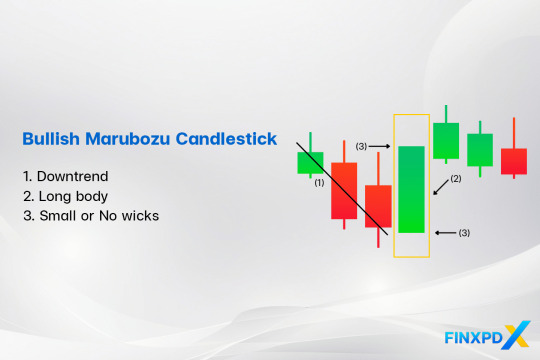
The Bullish Marubozu candlestick is a bullish candlestick pattern that shows strong buying pressure throughout the trading session. It has a long white or green body with no shadows or wicks, meaning the price opened at its lowest and closed at its highest point.
The name “White Marubozu” is another name for a Bullish Marubozu candlestick that combines its appearance and Japanese origins. “White” refers to the bullish candle color, and “Marubozu,” meaning “bald” in Japanese, describes its lack of wicks.
Characteristics of the Bullish Marubozu Candlestick
Bullish Marubozu: Features a long, solid green body with little to no wicks.
Full Bullish Marubozu: No wicks at all, showing the strongest bullish control throughout the session.
Open Bullish Marubozu: No lower wick but a small upper wick, indicating a strong upward move with slight selling pressure at the end.
Close Bullish Marubozu: A small lower wick but no upper wick, reflecting strong buying with a slightly higher open.
Read more: FinxpdX
Download PDF: 35 Powerful Candlestick Patterns
#investing#finance#investment#financial#stocks#forex#forextrading#forex market#candlestick#candlestick patterns#Marubozu#bullish#forex indicators
4 notes
·
View notes
Text
Candlestick Charting: A Tale of Tradition and Innovation from Japan
Candlestick charting's rich origins in Japan reveal timeless insights into market sentiment. Embrace the past's wisdom as we navigate today's markets, confident that understanding emotions will illuminate brighter trading paths! 🚀📈 #FinancialWisdom
Candlestick charting, a vital tool for traders globally, originated in 18th-century Japan amid a feudal society and a thriving rice market. Developed by legendary trader Munehisa Homma, it visualised price movements using candlesticks, revealing market psychology and predicting trends. Steve Nison’s introduction of candlestick charting to the West in the 1980s revolutionised technical analysis.…

View On WordPress
#Bullish and Bearish Patterns#Candlestick Patterns#Feudal Japan#Financial Education#Japan#Market Psychology#Modern Trading#Price Action#Risk management#Technical Analysis
4 notes
·
View notes
Text
How to Spot the Bullish Belt Hold Pattern in Forex
The Bullish Belt Hold pattern is a significant bullish reversal signal in Forex trading. It consists of a single long bullish candle with no upper shadow, indicating that buyers have full control over the market. This pattern suggests a shift from a downtrend to an uptrend, presenting an opportunity to enter long positions. Recognizing the Bullish Belt Hold pattern can help traders time their entries more effectively, improving trading strategies and increasing success in the Forex market.
0 notes
Text
How to Trade with Engulfing Candlestick Patterns
Engulfing Candlestick Patterns are a type of chart pattern used in technical analysis to predict market trends. They occur when a larger candlestick completely covers or “engulfs” the previous smaller one, signalling a potential reversal in price direction. There are two types of engulfing candlestick patterns, i.e., bullish engulfing pattern and bearish engulfing pattern. These patterns are a useful tool in determining entry and exit points for trade or understanding the market behaviour to make informed portfolio decisions.

Types of Engulfing Candlestick Patterns
How to Trade Using Engulfing Candlestick Patterns
Pros and Cons of Bullish Engulfing Candlestick Pattern
Pros and Cons of Bearish Engulfing Candlestick Pattern
#engulfing candlestick#types of engulfing candlestick pattern#bullish engulfing candlestick#bearish engulfing candlestick pattern
0 notes
Text
youtube
Mastering Forex Charts: A Beginner's Guide to Candlesticks, Lines, and Bar Patterns
#Forex trading#Forex charts#candlestick charts#line charts#bar charts#trading tutorial#chart analysis#technical analysis#Forex market#bullish patterns#bearish patterns#price movements#market trends#OHLC#trading strategies#chart reading#price action#trading tips#beginner trading#advanced trading#Forex education#PipInfuse#trading insights#market sentiment#trend analysis#trading confidence#Youtube
1 note
·
View note
Text
10 Candlestick Patterns for Effective Trading
Candlestick patterns are a powerful tool for traders to analyze price movements and predict future market behavior. Developed in Japan over 300 years ago, these patterns are widely used in modern technical analysis. This article will explore ten essential candlestick patterns that can help traders make informed decisions and enhance their trading strategies. What are Candlestick…
#Bearish Patterns#Bullish Patterns#Candlestick Patterns#Downtrend#Entry and Exit Points#Forex#Forex Traders#Forex Trading#Market Reversal#Price Movements#Risk Management#Stop-Loss#Take-Profit#Technical Analysis#Trading Psychology#Trading Strategies#Trading Strategy#Trend Direction#Trend Identification#Uptrend
1 note
·
View note
Text
#risk management#market capitalization#india#bullish reversal#market trends#chart pattern#candlestick pattern
0 notes
Text
Unlock the Secrets of Trading with Top Chart Patterns! Explore the world of chart patterns with Funded Traders Global. From understanding the basics of technical analysis to recognizing common chart patterns like head and shoulders, double tops, and flags, our blog equips you with the knowledge to enhance your trading skills. Discover advanced patterns like pennants, wedges, and harmonic patterns, and gain practical tips for effective trading. Improve your risk management, pinpoint entry and exit points, and combine chart patterns with technical indicators. Start your journey towards trading success today with Funded Traders Global!
#Advanced Chart Pattern#and Descending Triangles#and mini trading#Ascending#Basics of Technical Analysis#Benefits of Recognizing in Chart Pattern#Bullish and Bearish Flags Pattern#candlestick#candlestick Pattern#career in forex trading#chart patterns#classic reversal pattern#common chart patterns#cup and handle pattern#Double top and double bottom patterns#drawdown#financial markets#Forex trading financial freedom#FTG#ftg prop firm#ftg trading#Funded Traders Global#Gaps#Harmonic Patterns#Head and Shoulders Pattern#how to scale into a forex trade#Macro#Master the Market with These Top Chart Patterns for Trading#mastering Forex trading#micro
0 notes
Link
#CandlestickAnalysis#candlestickpatterns#chartpatterns#ForexTrading#markettrends#MomentumTrading#priceaction#ReversalPatterns#riskmanagement#StockMarket#supportandresistance#technicalanalysis#TradingSignals#TradingStrategy#TrendContinuation
2 notes
·
View notes
Text
Hammer Candlestick: Make Reversal Opportunities
In the world of technical analysis, identifying potential market reversals is important for traders seeking to maximize their profits and minimize their losses. One of the most reliable patterns for spotting these reversals is candlestick patterns, especially hammer candlestick
What Is a Hammer Candlestick?
A hammer candlestick pattern is a specific type of candlestick pattern used in technical analysis to indicate a potential reversal in a downtrend. It appears at the bottom of a downward trend and is characterized by a small body at the upper end of the trading range with a long lower shadow. The length of the lower shadow is at least twice the length of the body. This pattern suggests that despite the sellers pushing prices down significantly during the trading period, strong buying pressure drove the prices back up near the opening price by the end of the period, indicating a possible reversal to the upside.
Types of Hammer Candlestick
Hammer Candlestick The hammer candlestick pattern appears at the bottom of a downtrend and is characterized by a small body with a long lower shadow and little to no upper shadow. The lower shadow should be at least twice the length of the body.
Inverted Hammer Candlestick The inverted hammer candlestick pattern also appears at the bottom of a downtrend but is characterized by a small body with a long upper shadow and little to no lower shadow. The upper shadow should be at least twice the length of the body.
Limitations of Hammer Candlestick
Confirmation Required: A hammer candlestick alone does not guarantee a trend reversal. Subsequent bullish price action is needed to validate it.
No Price Target: The pattern does not provide a specific price target for the potential reversal, requiring other tools for determining exit points.
Context-Dependent: The hammer pattern is most reliable at the bottom of a downtrend and may not be valid in other market conditions.
False Signals: In highly volatile markets, hammer patterns can occur frequently without indicating a true reversal.
Additional Indicators Needs: It will be more effective with other technical analysis tools, rather than relying solely on the hammer candlestick.
Learn more: https://finxpdx.com/hammer-candlestick-how-to-spot-reversal-opportunities/

5 notes
·
View notes
Text
Bitcoin, the leading cryptocurrency, has recently faced a significant downturn, trading around $56,697.32. Despite this bearish phase, there are signs of a potential rebound. The Relative Strength Index (RSI) stands at 28.41, indicating oversold conditions typically seen as buying opportunities. Candlestick patterns with long lower shadows suggest buying pressure at lower levels, hinting at a price reversal.
Influential analyst CryptoJack is optimistic, predicting Bitcoin will surpass $100,000 despite the current downturn. He believes Bitcoin is near its bottom, aligning with technical indicators suggesting an oversold market.
Market data from CoinMarketCap shows Bitcoin’s market cap at $1.12 trillion, a 2.63% increase in one day, while the 24-hour trading volume has decreased by 38.03% to $31.91 billion, indicating consolidation. Traders are cautious, but the oversold RSI and bullish patterns support the possibility of a rebound. Watching for signs of reversal could signal the start of a recovery phase.
4 notes
·
View notes
Text
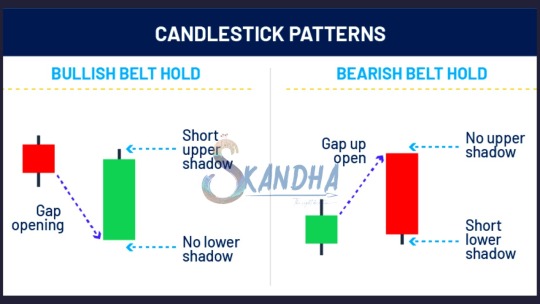
A belt hold pattern suggests that a trend may be reversing and indicates investor sentiment may have changed. When looking at them historically, there will often be a clear trend in one direction, followed by a clear trend in the other direction as the color of the candlestick changes.
There are two types of belt hold candlestick: one bullish and one bearish.
#skandhatrade #belthold #support #resistance #stock #chart #Trade #signal #patterns
#trend #Technicals #analysis #strategies #candlestick #priceaction #entry #supply #demand
To Learn More DM us
We Offer Paid Courses And Training Contact us Via
Email : [email protected]
https://forms.gle/8rWzz1gUuerxwVM49
Website: https://skandhatrade.com/
To Register for Learning:
2 notes
·
View notes
Text
Inverted Hammer Pattern Explained: Spot Market Reversals Like a Pro
Are you spotting the right reversal signals in the market?
Understanding candlestick patterns can provide a critical edge in trading, especially when it comes to identifying potential trend reversals. One such pattern is the Inverted Hammer—a powerful single-candle formation that often signals a possible shift from bearish to bullish momentum. However, recognizing it isn’t enough. Traders must understand the psychology behind the candle, its context within a trend, and how to confirm its validity with other indicators.
In our latest article, we break down the Inverted Hammer Pattern in detail: how to spot it, what it really means, and how to use it effectively in your trading strategy.
Start making smarter trading decisions today.
Read the full guide here:
#CandlestickPatterns#TradingForBeginners#InvertedHammer#StockMarket#TechnicalAnalysis#PriceAction#SmartTrading
0 notes
Text

Mastering stock charts helps you track price trends, spot bullish/bearish patterns, and gauge momentum with tools like RSI, MACD, and moving averages. Reading candlesticks, volume, and support/resistance levels sharpens your timing. For expert guidance and smarter investing, trust MNCL – your reliable stock broking and investment partner.
0 notes
Text
How to read candlestick charts and patterns for better trades?
Candlestick charts are a powerful tool for making better trading decisions. Each candle shows the open, high, low, and close price for a specific time frame. Patterns like Doji, Hammer, Engulfing, and Shooting Star can signal potential reversals or trend continuations.
To read them effectively:
Look for pattern confirmation with volume.
Understand bullish vs. bearish signals.
Combine candlestick analysis with support and resistance levels or indicators like RSI.
Learning to read these patterns takes practice and guided learning. At Empirical Academy, we offer hands-on training in technical analysis, including live candlestick chart reading.
📚 Learn to trade with clarity and confidence. 👉 Enroll now: https://www.empiricalacademy.net
0 notes