#PowerBi
Explore tagged Tumblr posts
Visit Tumblr Blog
Explore Tumblr blogs with no restrictions, modern design and the best experience.
Last Seen Tumblr Blogs


Fun Fact
Tumblr has a low social media market share in South America.
Text
https://madesimplemssql.com/
2 notes
·
View notes
Text
Top 5 Selling Odoo Modules.
In the dynamic world of business, having the right tools can make all the difference. For Odoo users, certain modules stand out for their ability to enhance data management and operations. To optimize your Odoo implementation and leverage its full potential.
That's where Odoo ERP can be a life savior for your business. This comprehensive solution integrates various functions into one centralized platform, tailor-made for the digital economy.
Let’s drive into 5 top selling module that can revolutionize your Odoo experience:
Dashboard Ninja with AI, Odoo Power BI connector, Looker studio connector, Google sheets connector, and Odoo data model.
1. Dashboard Ninja with AI:
Using this module, Create amazing reports with the powerful and smart Odoo Dashboard ninja app for Odoo. See your business from a 360-degree angle with an interactive, and beautiful dashboard.
Some Key Features:
Real-time streaming Dashboard
Advanced data filter
Create charts from Excel and CSV file
Fluid and flexible layout
Download Dashboards items
This module gives you AI suggestions for improving your operational efficiencies.
2. Odoo Power BI Connector:
This module provides a direct connection between Odoo and Power BI Desktop, a Powerful data visualization tool.
Some Key features:
Secure token-based connection.
Proper schema and data type handling.
Fetch custom tables from Odoo.
Real-time data updates.
With Power BI, you can make informed decisions based on real-time data analysis and visualization.
3. Odoo Data Model:
The Odoo Data Model is the backbone of the entire system. It defines how your data is stored, structured, and related within the application.
Key Features:
Relations & fields: Developers can easily find relations ( one-to-many, many-to-many and many-to-one) and defining fields (columns) between data tables.
Object Relational mapping: Odoo ORM allows developers to define models (classes) that map to database tables.
The module allows you to use SQL query extensions and download data in Excel Sheets.
4. Google Sheet Connector:
This connector bridges the gap between Odoo and Google Sheets.
Some Key features:
Real-time data synchronization and transfer between Odoo and Spreadsheet.
One-time setup, No need to wrestle with API’s.
Transfer multiple tables swiftly.
Helped your team’s workflow by making Odoo data accessible in a sheet format.
5. Odoo Looker Studio Connector:
Looker studio connector by Techfinna easily integrates Odoo data with Looker, a powerful data analytics and visualization platform.
Some Key Features:
Directly integrate Odoo data to Looker Studio with just a few clicks.
The connector automatically retrieves and maps Odoo table schemas in their native data types.
Manual and scheduled data refresh.
Execute custom SQL queries for selective data fetching.
The Module helped you build detailed reports, and provide deeper business intelligence.
These Modules will improve analytics, customization, and reporting. Module setup can significantly enhance your operational efficiency. Let’s embrace these modules and take your Odoo experience to the next level.
Need Help?
I hope you find the blog helpful. Please share your feedback and suggestions.
For flawless Odoo Connectors, implementation, and services contact us at
[email protected] Or www.techneith.com
#odoo#powerbi#connector#looker#studio#google#microsoft#techfinna#ksolves#odooerp#developer#web developers#integration#odooimplementation#crm#odoointegration#odooconnector
4 notes
·
View notes
Text
Automate Tableau Regression Testing with Datagaps BI Validator
Introduction
In today's data-driven world, the accuracy and reliability of business intelligence (BI) reports are paramount. As Tableau gains prominence for visualizing data, ensuring the integrity of these reports through effective regression testing becomes increasingly critical.
Challenges of Tableau Regression Testing
Tableau users often grapple with several challenges during regression testing. Issues such as handling complex data volumes, managing frequent updates, ensuring visualization accuracy, and maintaining consistent performance metrics pose significant hurdles.
Datagaps BI Validator: Your Solution
Enter Datagaps BI Validator—a robust tool tailored to streamline and enhance Tableau regression testing processes. From data comparison and UI consistency checks to comprehensive validation across multiple environments, BI Validator empowers organizations to maintain data accuracy effortlessly.
Key Features and Benefits
Automated Comparison: Automatically compare Tableau worksheet data and UI elements to detect discrepancies.
Detailed Reporting: Generate comprehensive reports with visual indicators to pinpoint changes between versions.
Integration and Automation: Seamlessly integrate with CI/CD pipelines for continuous testing and validation.
Comprehensive Validation: Validate data integrity, calculations, and visualizations across different Tableau environments.
Proactive Issue Detection: Receive alerts and notifications to promptly address discrepancies, ensuring data quality.
Expertise and Support: Leverage Datagaps' expertise in BI validation for unmatched accuracy and reliability.
Conclusion
Datagaps BI Validator empowers organizations to conquer Tableau regression testing challenges efficiently. By automating processes and providing actionable insights, BI Validator ensures that Tableau reports are always accurate, reliable, and up-to-date. Take charge of your data integrity with Datagaps BI Validator today.
Referred by Datagaps
#DataOpsSuiteBIValidator
Request a demo today
Demo: https://www.datagaps.com/request-a-demo/#utm_source=youtube&utm_medium=yt_video&utm_campaign=yt_request_demo&utm_id=yt_request_demo
#BI #PowerBI #BIValidator #Tableau #Datagaps
2 notes
·
View notes
Text

Power BI: Transforming data into actionable insights effortlessly.📊 Join Now 💡 #PowerBi , #RLanguage , #Tableau , #SAPFICO
2 notes
·
View notes
Text

You still been using outdated design tools to create dashboard mockups? 🥴 OOF. Issokay We've all been there.
Now create hi-fi dashboard wireframes with Mokkup.ai in under 30 mins. Share, comment, export and present your designs to the world! 🌎
#data analytics#dashboard#data#powerbi#tableau#visualization#dashboards#dashboard simulator#datascience#free#freetools
2 notes
·
View notes
Text
Excel in Advanced Skills
Efficient Data Handling: Learn advanced Excel Course techniques for streamlined data analysis. Automation: Discover how to automate tasks, saving time and increasing productivity. Problem-Solving: Develop problem-solving skills through complex Excel challenges. Join us on this transformative learning journey. Start today and redefine your digital future!

#excel#microsoft#microsoftexcel#office#word#o#powerpoint#business#cursodeexcel#data#msexcel#curso#cursoexcel#powerbi#exceltips#motivation#datascience#microsoftoffice#n#aprenderexcel#planilhas#dicasexcel#windows#dashboard#cursos#ado#exceltraining#like#excelbasico#dataanalytics
2 notes
·
View notes
Text
Power BI Admin Portal: Key Features and Strategies
Power BI has become a cornerstone of data-driven decision-making in modern enterprises. As organizations scale their data capabilities, effective administration of the Power BI environment becomes crucial. This guide explores Power BI administration in detail, inspired by Microsoft’s best practices and structure. Overview of Power BI Administration Power BI administration refers to the…
#adminstration#portal#power platform#powerbi#powerbi audit#reports#tenant#ai#microsoft#power-bi#technology
0 notes
Text
Power BI with Advanced SQL – Master the Data Game!
Are you ready to elevate your career in data analytics? Join our exclusive Power BI with Adv SQL training led by industry expert Mr. Laxman, starting from 26th June at 7:30 PM IST. Whether you're a student, working professional, or a career switcher, this course is tailored to help you extract insights, visualize data, and drive data-driven decisions like a pro.
In this hands-on training, you’ll dive into the world of Power BI, exploring real-time dashboards, DAX formulas, Power Query, and interactive reports. Plus, with Advanced SQL, you'll master complex queries, joins, subqueries, indexing, and optimization techniques that employers actively seek in top-tier analysts.

🎯 Why Join? ✅ Live Online/Classroom Training ✅ Practical Data Projects ✅ Resume + Interview Prep ✅ Placement Assistance ✅ Certification on Completion
📌 Don’t miss this chance to add two of the most in-demand skills to your resume!
🔗 Register Now: https://tr.ee/NMTMUl 🔍 Browse More Courses: https://linktr.ee/ITcoursesFreeDemos
#PowerBI#AdvancedSQL#DataAnalytics#BusinessIntelligence#NareshIT#CareerBoost#DataVisualization#SQLQueries#BITraining#LearningNeverStops#OnlineTraining#DataDrivenJobs
0 notes
Text
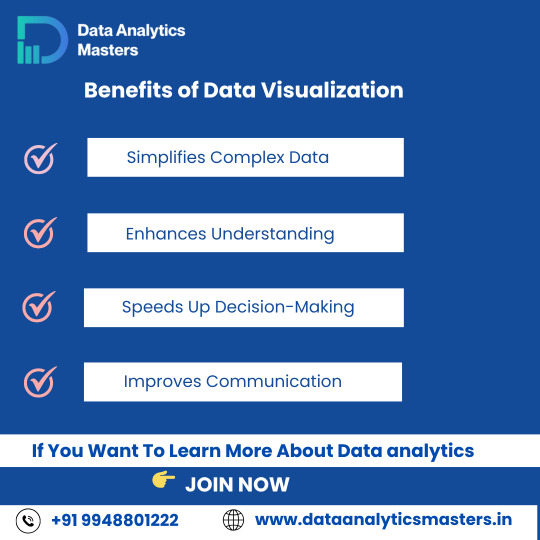
📊 Benefits of Data Visualization
Struggling with too much data?
Data visualization helps you:
✅ Simplify complex data – Easy to read
✅ Enhance understanding – Clear insights
✅ Make faster decisions – Take quick action
✅ Improve communication – Work better with your team
Start mastering tools like Power BI, Excel Dashboards, Tableau, and more!
✅ Why Choose Us?
✔️ 100% practical training
✔️ Real-time projects & case studies
✔️ Expert mentors with industry experience
✔️ Certification & job assistance
✔️ Easy-to-understand Telugu + English mix classes
📍 Institute Address:
3rd Floor, Dr. Atmaram Estates, Metro Pillar No. A690, Beside Siri Pearls & Jewellery, near JNTU Metro Station, Hyder Nagar, Vasantha Nagar, Hyderabad, Telangana – 500072📞 Contact: +91 9948801222 📧 Email: [email protected] 🌐 Website: https://dataanalyticsmasters.in
#DataVisualization#VisualizeData#DataAnalytics#PowerBI#Tableau#ExcelDashboard#DataStorytelling#DataScience#BusinessIntelligence#LearnAnalytics#AnalyticsTraining#DataSimplified#ChartsAndGraphs#Dashboards#DataAnalyticsMasters#TechLearning#UpskillNow#HyderabadTraining#OnlineDataCourses#SimplifyWithData
0 notes
Text
2 notes
·
View notes
Text
💻 Power BI with Advanced SQL
📅 26th June | 🕢 7:30 PM IST 👨🏫 Trainer: Mr. Laxman 📍 JNTU | Mode: Online/Offline 🔗 https://tr.ee/H2QjQz Level up your data game with expert training!
0 notes
Text
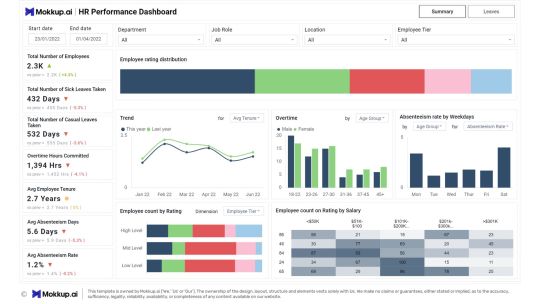
HR Performance dashboard done in under 30 mins on Mokkup.ai.
#dashboard simulator#dashboard#dashboards#data#visualization#datascience#data analytics#powerbi#tableau#hr#recruitment
1 note
·
View note
Text
Power Bi course in jalandhar
Power Bi course in jalandhar
Power BI Course at TechCADD Jalandhar:
Unlock Your Data Analytics Potential
In today's data-driven world, the ability to analyze and visualize data is paramount. TechCADD Computer Education in Jalandhar offers a comprehensive Power BI course designed to equip individuals with the skills needed to transform raw data into actionable insights. techcadd.com +4 techcaddcomputerinstitute.com +4 techcaddcomputerinstitute.com +4
Why Learn Power BI? Power BI is a top business analytics software by Microsoft that allows individuals to develop interactive dashboards and reports. Easy to use and feature-rich, Power BI is used extensively in industries for data visualization and decision-making.
Course Highlights In-depth Curriculum: The course addresses key areas like data transformation and loading with Power Query, data modeling, DAX (Data Analysis Expressions), and interactive visualization creation.
Hands-On Training: Practical exercises and live projects are undertaken by students to implement what they have learned and practice developing reports and dashboards.
Expert Trainers: The trainers in the course are experienced instructors who give individual attention and guidance to make the subject clear to the students.
Flexible Learning Schedules: TechCADD provides both online and offline courses for various learning styles and time schedules. techcadd.com +3 techcadd.com +3 techcaddcomputerinstitute.com +3
Career Opportunities After completing the Power BI course, one can apply for the following career roles:
Data Analyst: Interpret and analyze complex data to enable organisations to make well-informed decisions.
Business Intelligence Analyst: Create plans to enhance business operations and performance through data insights.
Data Scientist: Apply statistical approaches and machine learning methods for extracting useful information from data.
The need for data analytics and visualization professionals is increasing, making expertise in Power BI a sought-after quality in the job market. techcadd.com
Why Choose TechCADD? TechCADD Computer Education is well known for its excellence in training programs and its focus on student success. Having over 2,970 students trained and a satisfaction rate of over 90%, TechCADD ensures a favorable learning environment with: nitronixsolution.com +5 techcaddcomputerinstitute.com +5 techcaddcomputerinstitute.com +5
Experienced Trainers: Industry-experienced instructors who deliver practical guidance and insights. nitronixsolution.com +2 binly.com +2 techcadd.com +2
State-of-the-Art Infrastructure: Well-facilitated classrooms with the latest technology for efficient learning.
Placement Assistance: Guidance in getting students placed with potential employers and job opportunities. techcaddcomputerinstitute.com
ISO-Certified Courses: Value-added certification to your professional resume. techcaddcomputerinstitute.com
Join Today Take the first step towards taking your data analytics skills to the next level by joining the Power BI course in TechCADD Jalandhar. For details or registration, visit www.techcadd.com or call +91 9888122255. techcadd.com techcadd.com
Empower yourself with the skills and knowledge to succeed in data analytics. Enroll in TechCADD's Power BI course and open doors for your career.
visit now:
https://techcadd.com/best-power-bi-course-in-jalandhar.php
0 notes
Text

🧩 Power Query Online Tip: Diagram View
Q: What does the Diagram View in Power Query Online allow you to do?
✅ A: It gives you a visual representation of how your data sources are connected and what transformations have been applied.
🔍 Perfect for understanding query logic, debugging complex flows, and documenting your data prep process—especially in Dataflows Gen2 within Microsoft Fabric.
👀 If you're more of a visual thinker, this view is a game-changer!
💬 Have you tried Diagram View yet? What’s your experience with it?
#PowerQuery#PowerQueryOnline#MicrosoftFabric#DataflowsGen2#DataPreparation#ETL#DataTransformation#DiagramView#LowCode#DataEngineering#FabricCommunity#PowerBI#DataModeling#OneLake
0 notes