#SELECT INTO SQL technique
Explore tagged Tumblr posts
Visit Tumblr Blog
Explore Tumblr blogs with no restrictions, modern design and the best experience.
Last Seen Tumblr Blogs


Fun Fact
Tumblr is used by 21% of adults online aged 18-29 years.
Text
Ad-hoc Copying of Large SQL Tables from Production to Development in SQL Server 2022: Best Methodologies
Picture this: You’re a database whiz, knee-deep in the nitty-gritty of moving colossal tables from the bustling world of production to the calmer waters of development or testing. It’s no small feat, especially when you’re juggling tables that are bursting at the seams with data, running into the hundreds of millions of rows. The challenge? Doing this dance without stepping on the toes of data…
View On WordPress
#bulk copy program BCP#database snapshots SQL#SELECT INTO SQL technique#SQL Server 2022 data migration#SSIS data transformation
0 notes
Text
Unlocking the Power of Data: Essential Skills to Become a Data Scientist

In today's data-driven world, the demand for skilled data scientists is skyrocketing. These professionals are the key to transforming raw information into actionable insights, driving innovation and shaping business strategies. But what exactly does it take to become a data scientist? It's a multidisciplinary field, requiring a unique blend of technical prowess and analytical thinking. Let's break down the essential skills you'll need to embark on this exciting career path.
1. Strong Mathematical and Statistical Foundation:
At the heart of data science lies a deep understanding of mathematics and statistics. You'll need to grasp concepts like:
Linear Algebra and Calculus: Essential for understanding machine learning algorithms and optimizing models.
Probability and Statistics: Crucial for data analysis, hypothesis testing, and drawing meaningful conclusions from data.
2. Programming Proficiency (Python and/or R):
Data scientists are fluent in at least one, if not both, of the dominant programming languages in the field:
Python: Known for its readability and extensive libraries like Pandas, NumPy, Scikit-learn, and TensorFlow, making it ideal for data manipulation, analysis, and machine learning.
R: Specifically designed for statistical computing and graphics, R offers a rich ecosystem of packages for statistical modeling and visualization.
3. Data Wrangling and Preprocessing Skills:
Raw data is rarely clean and ready for analysis. A significant portion of a data scientist's time is spent on:
Data Cleaning: Handling missing values, outliers, and inconsistencies.
Data Transformation: Reshaping, merging, and aggregating data.
Feature Engineering: Creating new features from existing data to improve model performance.
4. Expertise in Databases and SQL:
Data often resides in databases. Proficiency in SQL (Structured Query Language) is essential for:
Extracting Data: Querying and retrieving data from various database systems.
Data Manipulation: Filtering, joining, and aggregating data within databases.
5. Machine Learning Mastery:
Machine learning is a core component of data science, enabling you to build models that learn from data and make predictions or classifications. Key areas include:
Supervised Learning: Regression, classification algorithms.
Unsupervised Learning: Clustering, dimensionality reduction.
Model Selection and Evaluation: Choosing the right algorithms and assessing their performance.
6. Data Visualization and Communication Skills:
Being able to effectively communicate your findings is just as important as the analysis itself. You'll need to:
Visualize Data: Create compelling charts and graphs to explore patterns and insights using libraries like Matplotlib, Seaborn (Python), or ggplot2 (R).
Tell Data Stories: Present your findings in a clear and concise manner that resonates with both technical and non-technical audiences.
7. Critical Thinking and Problem-Solving Abilities:
Data scientists are essentially problem solvers. You need to be able to:
Define Business Problems: Translate business challenges into data science questions.
Develop Analytical Frameworks: Structure your approach to solve complex problems.
Interpret Results: Draw meaningful conclusions and translate them into actionable recommendations.
8. Domain Knowledge (Optional but Highly Beneficial):
Having expertise in the specific industry or domain you're working in can give you a significant advantage. It helps you understand the context of the data and formulate more relevant questions.
9. Curiosity and a Growth Mindset:
The field of data science is constantly evolving. A genuine curiosity and a willingness to learn new technologies and techniques are crucial for long-term success.
10. Strong Communication and Collaboration Skills:
Data scientists often work in teams and need to collaborate effectively with engineers, business stakeholders, and other experts.
Kickstart Your Data Science Journey with Xaltius Academy's Data Science and AI Program:
Acquiring these skills can seem like a daunting task, but structured learning programs can provide a clear and effective path. Xaltius Academy's Data Science and AI Program is designed to equip you with the essential knowledge and practical experience to become a successful data scientist.
Key benefits of the program:
Comprehensive Curriculum: Covers all the core skills mentioned above, from foundational mathematics to advanced machine learning techniques.
Hands-on Projects: Provides practical experience working with real-world datasets and building a strong portfolio.
Expert Instructors: Learn from industry professionals with years of experience in data science and AI.
Career Support: Offers guidance and resources to help you launch your data science career.
Becoming a data scientist is a rewarding journey that blends technical expertise with analytical thinking. By focusing on developing these key skills and leveraging resources like Xaltius Academy's program, you can position yourself for a successful and impactful career in this in-demand field. The power of data is waiting to be unlocked – are you ready to take the challenge?
3 notes
·
View notes
Text
Data Analysis: Turning Information into Insight
In nowadays’s digital age, statistics has come to be a vital asset for businesses, researchers, governments, and people alike. However, raw facts on its personal holds little value till it's far interpreted and understood. This is wherein records evaluation comes into play. Data analysis is the systematic manner of inspecting, cleansing, remodeling, and modeling facts with the objective of coming across beneficial information, drawing conclusions, and helping selection-making.
What Is Data Analysis In Research

What is Data Analysis?
At its middle, records analysis includes extracting meaningful insights from datasets. These datasets can variety from small and based spreadsheets to large and unstructured facts lakes. The primary aim is to make sense of data to reply questions, resolve issues, or become aware of traits and styles that are not without delay apparent.
Data evaluation is used in truely every enterprise—from healthcare and finance to marketing and education. It enables groups to make proof-based choices, improve operational efficiency, and advantage aggressive advantages.
Types of Data Analysis
There are several kinds of information evaluation, every serving a completely unique purpose:
1. Descriptive Analysis
Descriptive analysis answers the question: “What happened?” It summarizes raw facts into digestible codecs like averages, probabilities, or counts. For instance, a store might analyze last month’s sales to decide which merchandise achieved satisfactory.
2. Diagnostic Analysis
This form of evaluation explores the reasons behind beyond outcomes. It answers: “Why did it occur?” For example, if a agency sees a surprising drop in internet site visitors, diagnostic evaluation can assist pinpoint whether or not it changed into because of a technical problem, adjustments in search engine marketing rating, or competitor movements.
3. Predictive Analysis
Predictive analysis makes use of historical information to forecast destiny consequences. It solutions: “What is probable to occur?” This includes statistical models and system getting to know algorithms to pick out styles and expect destiny trends, such as customer churn or product demand.
4. Prescriptive Analysis
Prescriptive analysis provides recommendations primarily based on facts. It solutions: “What have to we do?” This is the maximum advanced type of analysis and often combines insights from predictive analysis with optimization and simulation techniques to manual selection-making.
The Data Analysis Process
The technique of information analysis commonly follows those steps:
1. Define the Objective
Before diving into statistics, it’s essential to without a doubt recognize the question or trouble at hand. A well-defined goal guides the entire analysis and ensures that efforts are aligned with the preferred outcome.
2. Collect Data
Data can come from numerous sources which includes databases, surveys, sensors, APIs, or social media. It’s important to make certain that the records is relevant, timely, and of sufficient high-quality.
3. Clean and Prepare Data
Raw information is regularly messy—it may comprise missing values, duplicates, inconsistencies, or mistakes. Data cleansing involves addressing these problems. Preparation may include formatting, normalization, or growing new variables.
Four. Analyze the Data
Tools like Excel, SQL, Python, R, or specialized software consisting of Tableau, Power BI, and SAS are typically used.
5. Interpret Results
Analysis isn't pretty much numbers; it’s about meaning. Interpreting effects involves drawing conclusions, explaining findings, and linking insights lower back to the authentic goal.
6. Communicate Findings
Insights have to be communicated effectively to stakeholders. Visualization tools including charts, graphs, dashboards, and reports play a vital position in telling the story behind the statistics.
7. Make Decisions and Take Action
The last aim of statistics analysis is to tell selections. Whether it’s optimizing a advertising marketing campaign, improving customer support, or refining a product, actionable insights flip data into real-global effects.
Tools and Technologies for Data Analysis
A big selection of gear is available for facts analysis, each suited to distinct tasks and talent levels:
Excel: Great for small datasets and short analysis. Offers capabilities, pivot tables, and charts.
Python: Powerful for complicated facts manipulation and modeling. Popular libraries consist of Pandas, NumPy, Matplotlib, and Scikit-learn.
R: A statistical programming language extensively used for statistical analysis and statistics visualization.
SQL: Essential for querying and handling information saved in relational databases.
Tableau & Power BI: User-friendly enterprise intelligence equipment that flip facts into interactive visualizations and dashboards.
Healthcare: Analyzing affected person statistics to enhance treatment plans, predict outbreaks, and control resources.
Finance: Detecting fraud, coping with threat, and guiding investment techniques.
Retail: Personalizing advertising campaigns, managing inventory, and optimizing pricing.
Sports: Enhancing performance through participant records and game analysis.
Public Policy: Informing choices on schooling, transportation, and financial improvement.
Challenges in Data Analysis
Data Quality: Incomplete, old, or incorrect information can lead to deceptive conclusions.
Data Privacy: Handling sensitive records requires strict adherence to privacy guidelines like GDPR.
Skill Gaps: There's a developing demand for skilled information analysts who can interpret complicated facts sets.
Integration: Combining facts from disparate resources may be technically hard.
Bias and Misinterpretation: Poorly designed analysis can introduce bias or lead to wrong assumptions.
The Future of Data Analysis
As facts keeps to grow exponentially, the sector of facts analysis is evolving rapidly. Emerging developments include:
Artificial Intelligence (AI) & Machine Learning: Automating evaluation and producing predictive fashions at scale.
Real-Time Analytics: Enabling decisions based totally on live data streams for faster reaction.
Data Democratization: Making records handy and understandable to everybody in an business enterprise
2 notes
·
View notes
Text
SQL injection

we will recall SQLi types once again because examples speak louder than explanations!
In-band SQL Injection
This technique is considered the most common and straightforward type of SQL injection attack. In this technique, the attacker uses the same communication channel for both the injection and the retrieval of data. There are two primary types of in-band SQL injection:
Error-Based SQL Injection: The attacker manipulates the SQL query to produce error messages from the database. These error messages often contain information about the database structure, which can be used to exploit the database further. Example: SELECT * FROM users WHERE id = 1 AND 1=CONVERT(int, (SELECT @@version)). If the database version is returned in the error message, it reveals information about the database.
Union-Based SQL Injection: The attacker uses the UNION SQL operator to combine the results of two or more SELECT statements into a single result, thereby retrieving data from other tables. Example: SELECT name, email FROM users WHERE id = 1 UNION ALL SELECT username, password FROM admin.
Inferential (Blind) SQL Injection
Inferential SQL injection does not transfer data directly through the web application, making exploiting it more challenging. Instead, the attacker sends payloads and observes the application’s behaviour and response times to infer information about the database. There are two primary types of inferential SQL injection:
Boolean-Based Blind SQL Injection: The attacker sends an SQL query to the database, forcing the application to return a different result based on a true or false condition. By analysing the application’s response, the attacker can infer whether the payload was true or false. Example: SELECT * FROM users WHERE id = 1 AND 1=1 (true condition) versus SELECT * FROM users WHERE id = 1 AND 1=2 (false condition). The attacker can infer the result if the page content or behaviour changes based on the condition.
Time-Based Blind SQL Injection: The attacker sends an SQL query to the database, which delays the response for a specified time if the condition is true. By measuring the response time, the attacker can infer whether the condition is true or false. Example: SELECT * FROM users WHERE id = 1; IF (1=1) WAITFOR DELAY '00:00:05'--. If the response is delayed by 5 seconds, the attacker can infer that the condition was true.
Out-of-band SQL Injection
Out-of-band SQL injection is used when the attacker cannot use the same channel to launch the attack and gather results or when the server responses are unstable. This technique relies on the database server making an out-of-band request (e.g., HTTP or DNS) to send the query result to the attacker. HTTP is normally used in out-of-band SQL injection to send the query result to the attacker's server. We will discuss it in detail in this room.
Each type of SQL injection technique has its advantages and challenges.
3 notes
·
View notes
Text
UNLOCKING THE POWER OF AI WITH EASYLIBPAL 2/2

EXPANDED COMPONENTS AND DETAILS OF EASYLIBPAL:
1. Easylibpal Class: The core component of the library, responsible for handling algorithm selection, model fitting, and prediction generation
2. Algorithm Selection and Support:
Supports classic AI algorithms such as Linear Regression, Logistic Regression, Support Vector Machine (SVM), Naive Bayes, and K-Nearest Neighbors (K-NN).
and
- Decision Trees
- Random Forest
- AdaBoost
- Gradient Boosting
3. Integration with Popular Libraries: Seamless integration with essential Python libraries like NumPy, Pandas, Matplotlib, and Scikit-learn for enhanced functionality.
4. Data Handling:
- DataLoader class for importing and preprocessing data from various formats (CSV, JSON, SQL databases).
- DataTransformer class for feature scaling, normalization, and encoding categorical variables.
- Includes functions for loading and preprocessing datasets to prepare them for training and testing.
- `FeatureSelector` class: Provides methods for feature selection and dimensionality reduction.
5. Model Evaluation:
- Evaluator class to assess model performance using metrics like accuracy, precision, recall, F1-score, and ROC-AUC.
- Methods for generating confusion matrices and classification reports.
6. Model Training: Contains methods for fitting the selected algorithm with the training data.
- `fit` method: Trains the selected algorithm on the provided training data.
7. Prediction Generation: Allows users to make predictions using the trained model on new data.
- `predict` method: Makes predictions using the trained model on new data.
- `predict_proba` method: Returns the predicted probabilities for classification tasks.
8. Model Evaluation:
- `Evaluator` class: Assesses model performance using various metrics (e.g., accuracy, precision, recall, F1-score, ROC-AUC).
- `cross_validate` method: Performs cross-validation to evaluate the model's performance.
- `confusion_matrix` method: Generates a confusion matrix for classification tasks.
- `classification_report` method: Provides a detailed classification report.
9. Hyperparameter Tuning:
- Tuner class that uses techniques likes Grid Search and Random Search for hyperparameter optimization.
10. Visualization:
- Integration with Matplotlib and Seaborn for generating plots to analyze model performance and data characteristics.
- Visualization support: Enables users to visualize data, model performance, and predictions using plotting functionalities.
- `Visualizer` class: Integrates with Matplotlib and Seaborn to generate plots for model performance analysis and data visualization.
- `plot_confusion_matrix` method: Visualizes the confusion matrix.
- `plot_roc_curve` method: Plots the Receiver Operating Characteristic (ROC) curve.
- `plot_feature_importance` method: Visualizes feature importance for applicable algorithms.
11. Utility Functions:
- Functions for saving and loading trained models.
- Logging functionalities to track the model training and prediction processes.
- `save_model` method: Saves the trained model to a file.
- `load_model` method: Loads a previously trained model from a file.
- `set_logger` method: Configures logging functionality for tracking model training and prediction processes.
12. User-Friendly Interface: Provides a simplified and intuitive interface for users to interact with and apply classic AI algorithms without extensive knowledge or configuration.
13.. Error Handling: Incorporates mechanisms to handle invalid inputs, errors during training, and other potential issues during algorithm usage.
- Custom exception classes for handling specific errors and providing informative error messages to users.
14. Documentation: Comprehensive documentation to guide users on how to use Easylibpal effectively and efficiently
- Comprehensive documentation explaining the usage and functionality of each component.
- Example scripts demonstrating how to use Easylibpal for various AI tasks and datasets.
15. Testing Suite:
- Unit tests for each component to ensure code reliability and maintainability.
- Integration tests to verify the smooth interaction between different components.
IMPLEMENTATION EXAMPLE WITH ADDITIONAL FEATURES:
Here is an example of how the expanded Easylibpal library could be structured and used:
```python
import numpy as np
import pandas as pd
from sklearn.model_selection import train_test_split
from sklearn.preprocessing import StandardScaler
from easylibpal import Easylibpal, DataLoader, Evaluator, Tuner
# Example DataLoader
class DataLoader:
def load_data(self, filepath, file_type='csv'):
if file_type == 'csv':
return pd.read_csv(filepath)
else:
raise ValueError("Unsupported file type provided.")
# Example Evaluator
class Evaluator:
def evaluate(self, model, X_test, y_test):
predictions = model.predict(X_test)
accuracy = np.mean(predictions == y_test)
return {'accuracy': accuracy}
# Example usage of Easylibpal with DataLoader and Evaluator
if __name__ == "__main__":
# Load and prepare the data
data_loader = DataLoader()
data = data_loader.load_data('path/to/your/data.csv')
X = data.iloc[:, :-1]
y = data.iloc[:, -1]
X_train, X_test, y_train, y_test = train_test_split(X, y, test_size=0.2, random_state=42)
# Scale features
scaler = StandardScaler()
X_train_scaled = scaler.fit_transform(X_train)
X_test_scaled = scaler.transform(X_test)
# Initialize Easylibpal with the desired algorithm
model = Easylibpal('Random Forest')
model.fit(X_train_scaled, y_train)
# Evaluate the model
evaluator = Evaluator()
results = evaluator.evaluate(model, X_test_scaled, y_test)
print(f"Model Accuracy: {results['accuracy']}")
# Optional: Use Tuner for hyperparameter optimization
tuner = Tuner(model, param_grid={'n_estimators': [100, 200], 'max_depth': [10, 20, 30]})
best_params = tuner.optimize(X_train_scaled, y_train)
print(f"Best Parameters: {best_params}")
```
This example demonstrates the structured approach to using Easylibpal with enhanced data handling, model evaluation, and optional hyperparameter tuning. The library empowers users to handle real-world datasets, apply various machine learning algorithms, and evaluate their performance with ease, making it an invaluable tool for developers and data scientists aiming to implement AI solutions efficiently.
Easylibpal is dedicated to making the latest AI technology accessible to everyone, regardless of their background or expertise. Our platform simplifies the process of selecting and implementing classic AI algorithms, enabling users across various industries to harness the power of artificial intelligence with ease. By democratizing access to AI, we aim to accelerate innovation and empower users to achieve their goals with confidence. Easylibpal's approach involves a democratization framework that reduces entry barriers, lowers the cost of building AI solutions, and speeds up the adoption of AI in both academic and business settings.
Below are examples showcasing how each main component of the Easylibpal library could be implemented and used in practice to provide a user-friendly interface for utilizing classic AI algorithms.
1. Core Components
Easylibpal Class Example:
```python
class Easylibpal:
def __init__(self, algorithm):
self.algorithm = algorithm
self.model = None
def fit(self, X, y):
# Simplified example: Instantiate and train a model based on the selected algorithm
if self.algorithm == 'Linear Regression':
from sklearn.linear_model import LinearRegression
self.model = LinearRegression()
elif self.algorithm == 'Random Forest':
from sklearn.ensemble import RandomForestClassifier
self.model = RandomForestClassifier()
self.model.fit(X, y)
def predict(self, X):
return self.model.predict(X)
```
2. Data Handling
DataLoader Class Example:
```python
class DataLoader:
def load_data(self, filepath, file_type='csv'):
if file_type == 'csv':
import pandas as pd
return pd.read_csv(filepath)
else:
raise ValueError("Unsupported file type provided.")
```
3. Model Evaluation
Evaluator Class Example:
```python
from sklearn.metrics import accuracy_score, classification_report
class Evaluator:
def evaluate(self, model, X_test, y_test):
predictions = model.predict(X_test)
accuracy = accuracy_score(y_test, predictions)
report = classification_report(y_test, predictions)
return {'accuracy': accuracy, 'report': report}
```
4. Hyperparameter Tuning
Tuner Class Example:
```python
from sklearn.model_selection import GridSearchCV
class Tuner:
def __init__(self, model, param_grid):
self.model = model
self.param_grid = param_grid
def optimize(self, X, y):
grid_search = GridSearchCV(self.model, self.param_grid, cv=5)
grid_search.fit(X, y)
return grid_search.best_params_
```
5. Visualization
Visualizer Class Example:
```python
import matplotlib.pyplot as plt
class Visualizer:
def plot_confusion_matrix(self, cm, classes, normalize=False, title='Confusion matrix'):
plt.imshow(cm, interpolation='nearest', cmap=plt.cm.Blues)
plt.title(title)
plt.colorbar()
tick_marks = np.arange(len(classes))
plt.xticks(tick_marks, classes, rotation=45)
plt.yticks(tick_marks, classes)
plt.ylabel('True label')
plt.xlabel('Predicted label')
plt.show()
```
6. Utility Functions
Save and Load Model Example:
```python
import joblib
def save_model(model, filename):
joblib.dump(model, filename)
def load_model(filename):
return joblib.load(filename)
```
7. Example Usage Script
Using Easylibpal in a Script:
```python
# Assuming Easylibpal and other classes have been imported
data_loader = DataLoader()
data = data_loader.load_data('data.csv')
X = data.drop('Target', axis=1)
y = data['Target']
model = Easylibpal('Random Forest')
model.fit(X, y)
evaluator = Evaluator()
results = evaluator.evaluate(model, X, y)
print("Accuracy:", results['accuracy'])
print("Report:", results['report'])
visualizer = Visualizer()
visualizer.plot_confusion_matrix(results['cm'], classes=['Class1', 'Class2'])
save_model(model, 'trained_model.pkl')
loaded_model = load_model('trained_model.pkl')
```
These examples illustrate the practical implementation and use of the Easylibpal library components, aiming to simplify the application of AI algorithms for users with varying levels of expertise in machine learning.
EASYLIBPAL IMPLEMENTATION:
Step 1: Define the Problem
First, we need to define the problem we want to solve. For this POC, let's assume we want to predict house prices based on various features like the number of bedrooms, square footage, and location.
Step 2: Choose an Appropriate Algorithm
Given our problem, a supervised learning algorithm like linear regression would be suitable. We'll use Scikit-learn, a popular library for machine learning in Python, to implement this algorithm.
Step 3: Prepare Your Data
We'll use Pandas to load and prepare our dataset. This involves cleaning the data, handling missing values, and splitting the dataset into training and testing sets.
Step 4: Implement the Algorithm
Now, we'll use Scikit-learn to implement the linear regression algorithm. We'll train the model on our training data and then test its performance on the testing data.
Step 5: Evaluate the Model
Finally, we'll evaluate the performance of our model using metrics like Mean Squared Error (MSE) and R-squared.
Python Code POC
```python
import numpy as np
import pandas as pd
from sklearn.model_selection import train_test_split
from sklearn.linear_model import LinearRegression
from sklearn.metrics import mean_squared_error, r2_score
# Load the dataset
data = pd.read_csv('house_prices.csv')
# Prepare the data
X = data'bedrooms', 'square_footage', 'location'
y = data['price']
# Split the data into training and testing sets
X_train, X_test, y_train, y_test = train_test_split(X, y, test_size=0.2, random_state=42)
# Create and train the model
model = LinearRegression()
model.fit(X_train, y_train)
# Make predictions
predictions = model.predict(X_test)
# Evaluate the model
mse = mean_squared_error(y_test, predictions)
r2 = r2_score(y_test, predictions)
print(f'Mean Squared Error: {mse}')
print(f'R-squared: {r2}')
```
Below is an implementation, Easylibpal provides a simple interface to instantiate and utilize classic AI algorithms such as Linear Regression, Logistic Regression, SVM, Naive Bayes, and K-NN. Users can easily create an instance of Easylibpal with their desired algorithm, fit the model with training data, and make predictions, all with minimal code and hassle. This demonstrates the power of Easylibpal in simplifying the integration of AI algorithms for various tasks.
```python
# Import necessary libraries
import numpy as np
import pandas as pd
import matplotlib.pyplot as plt
from sklearn.linear_model import LinearRegression
from sklearn.linear_model import LogisticRegression
from sklearn.svm import SVC
from sklearn.naive_bayes import GaussianNB
from sklearn.neighbors import KNeighborsClassifier
class Easylibpal:
def __init__(self, algorithm):
self.algorithm = algorithm
def fit(self, X, y):
if self.algorithm == 'Linear Regression':
self.model = LinearRegression()
elif self.algorithm == 'Logistic Regression':
self.model = LogisticRegression()
elif self.algorithm == 'SVM':
self.model = SVC()
elif self.algorithm == 'Naive Bayes':
self.model = GaussianNB()
elif self.algorithm == 'K-NN':
self.model = KNeighborsClassifier()
else:
raise ValueError("Invalid algorithm specified.")
self.model.fit(X, y)
def predict(self, X):
return self.model.predict(X)
# Example usage:
# Initialize Easylibpal with the desired algorithm
easy_algo = Easylibpal('Linear Regression')
# Generate some sample data
X = np.array([[1], [2], [3], [4]])
y = np.array([2, 4, 6, 8])
# Fit the model
easy_algo.fit(X, y)
# Make predictions
predictions = easy_algo.predict(X)
# Plot the results
plt.scatter(X, y)
plt.plot(X, predictions, color='red')
plt.title('Linear Regression with Easylibpal')
plt.xlabel('X')
plt.ylabel('y')
plt.show()
```
Easylibpal is an innovative Python library designed to simplify the integration and use of classic AI algorithms in a user-friendly manner. It aims to bridge the gap between the complexity of AI libraries and the ease of use, making it accessible for developers and data scientists alike. Easylibpal abstracts the underlying complexity of each algorithm, providing a unified interface that allows users to apply these algorithms with minimal configuration and understanding of the underlying mechanisms.
ENHANCED DATASET HANDLING
Easylibpal should be able to handle datasets more efficiently. This includes loading datasets from various sources (e.g., CSV files, databases), preprocessing data (e.g., normalization, handling missing values), and splitting data into training and testing sets.
```python
import os
from sklearn.model_selection import train_test_split
class Easylibpal:
# Existing code...
def load_dataset(self, filepath):
"""Loads a dataset from a CSV file."""
if not os.path.exists(filepath):
raise FileNotFoundError("Dataset file not found.")
return pd.read_csv(filepath)
def preprocess_data(self, dataset):
"""Preprocesses the dataset."""
# Implement data preprocessing steps here
return dataset
def split_data(self, X, y, test_size=0.2):
"""Splits the dataset into training and testing sets."""
return train_test_split(X, y, test_size=test_size)
```
Additional Algorithms
Easylibpal should support a wider range of algorithms. This includes decision trees, random forests, and gradient boosting machines.
```python
from sklearn.tree import DecisionTreeClassifier
from sklearn.ensemble import RandomForestClassifier
from sklearn.ensemble import GradientBoostingClassifier
class Easylibpal:
# Existing code...
def fit(self, X, y):
# Existing code...
elif self.algorithm == 'Decision Tree':
self.model = DecisionTreeClassifier()
elif self.algorithm == 'Random Forest':
self.model = RandomForestClassifier()
elif self.algorithm == 'Gradient Boosting':
self.model = GradientBoostingClassifier()
# Add more algorithms as needed
```
User-Friendly Features
To make Easylibpal even more user-friendly, consider adding features like:
- Automatic hyperparameter tuning: Implementing a simple interface for hyperparameter tuning using GridSearchCV or RandomizedSearchCV.
- Model evaluation metrics: Providing easy access to common evaluation metrics like accuracy, precision, recall, and F1 score.
- Visualization tools: Adding methods for plotting model performance, confusion matrices, and feature importance.
```python
from sklearn.metrics import accuracy_score, classification_report
from sklearn.model_selection import GridSearchCV
class Easylibpal:
# Existing code...
def evaluate_model(self, X_test, y_test):
"""Evaluates the model using accuracy and classification report."""
y_pred = self.predict(X_test)
print("Accuracy:", accuracy_score(y_test, y_pred))
print(classification_report(y_test, y_pred))
def tune_hyperparameters(self, X, y, param_grid):
"""Tunes the model's hyperparameters using GridSearchCV."""
grid_search = GridSearchCV(self.model, param_grid, cv=5)
grid_search.fit(X, y)
self.model = grid_search.best_estimator_
```
Easylibpal leverages the power of Python and its rich ecosystem of AI and machine learning libraries, such as scikit-learn, to implement the classic algorithms. It provides a high-level API that abstracts the specifics of each algorithm, allowing users to focus on the problem at hand rather than the intricacies of the algorithm.
Python Code Snippets for Easylibpal
Below are Python code snippets demonstrating the use of Easylibpal with classic AI algorithms. Each snippet demonstrates how to use Easylibpal to apply a specific algorithm to a dataset.
# Linear Regression
```python
from Easylibpal import Easylibpal
# Initialize Easylibpal with a dataset
Easylibpal = Easylibpal(dataset='your_dataset.csv')
# Apply Linear Regression
result = Easylibpal.apply_algorithm('linear_regression', target_column='target')
# Print the result
print(result)
```
# Logistic Regression
```python
from Easylibpal import Easylibpal
# Initialize Easylibpal with a dataset
Easylibpal = Easylibpal(dataset='your_dataset.csv')
# Apply Logistic Regression
result = Easylibpal.apply_algorithm('logistic_regression', target_column='target')
# Print the result
print(result)
```
# Support Vector Machines (SVM)
```python
from Easylibpal import Easylibpal
# Initialize Easylibpal with a dataset
Easylibpal = Easylibpal(dataset='your_dataset.csv')
# Apply SVM
result = Easylibpal.apply_algorithm('svm', target_column='target')
# Print the result
print(result)
```
# Naive Bayes
```python
from Easylibpal import Easylibpal
# Initialize Easylibpal with a dataset
Easylibpal = Easylibpal(dataset='your_dataset.csv')
# Apply Naive Bayes
result = Easylibpal.apply_algorithm('naive_bayes', target_column='target')
# Print the result
print(result)
```
# K-Nearest Neighbors (K-NN)
```python
from Easylibpal import Easylibpal
# Initialize Easylibpal with a dataset
Easylibpal = Easylibpal(dataset='your_dataset.csv')
# Apply K-NN
result = Easylibpal.apply_algorithm('knn', target_column='target')
# Print the result
print(result)
```
ABSTRACTION AND ESSENTIAL COMPLEXITY
- Essential Complexity: This refers to the inherent complexity of the problem domain, which cannot be reduced regardless of the programming language or framework used. It includes the logic and algorithm needed to solve the problem. For example, the essential complexity of sorting a list remains the same across different programming languages.
- Accidental Complexity: This is the complexity introduced by the choice of programming language, framework, or libraries. It can be reduced or eliminated through abstraction. For instance, using a high-level API in Python can hide the complexity of lower-level operations, making the code more readable and maintainable.
HOW EASYLIBPAL ABSTRACTS COMPLEXITY
Easylibpal aims to reduce accidental complexity by providing a high-level API that encapsulates the details of each classic AI algorithm. This abstraction allows users to apply these algorithms without needing to understand the underlying mechanisms or the specifics of the algorithm's implementation.
- Simplified Interface: Easylibpal offers a unified interface for applying various algorithms, such as Linear Regression, Logistic Regression, SVM, Naive Bayes, and K-NN. This interface abstracts the complexity of each algorithm, making it easier for users to apply them to their datasets.
- Runtime Fusion: By evaluating sub-expressions and sharing them across multiple terms, Easylibpal can optimize the execution of algorithms. This approach, similar to runtime fusion in abstract algorithms, allows for efficient computation without duplicating work, thereby reducing the computational complexity.
- Focus on Essential Complexity: While Easylibpal abstracts away the accidental complexity; it ensures that the essential complexity of the problem domain remains at the forefront. This means that while the implementation details are hidden, the core logic and algorithmic approach are still accessible and understandable to the user.
To implement Easylibpal, one would need to create a Python class that encapsulates the functionality of each classic AI algorithm. This class would provide methods for loading datasets, preprocessing data, and applying the algorithm with minimal configuration required from the user. The implementation would leverage existing libraries like scikit-learn for the actual algorithmic computations, abstracting away the complexity of these libraries.
Here's a conceptual example of how the Easylibpal class might be structured for applying a Linear Regression algorithm:
```python
class Easylibpal:
def __init__(self, dataset):
self.dataset = dataset
# Load and preprocess the dataset
def apply_linear_regression(self, target_column):
# Abstracted implementation of Linear Regression
# This method would internally use scikit-learn or another library
# to perform the actual computation, abstracting the complexity
pass
# Usage
Easylibpal = Easylibpal(dataset='your_dataset.csv')
result = Easylibpal.apply_linear_regression(target_column='target')
```
This example demonstrates the concept of Easylibpal by abstracting the complexity of applying a Linear Regression algorithm. The actual implementation would need to include the specifics of loading the dataset, preprocessing it, and applying the algorithm using an underlying library like scikit-learn.
Easylibpal abstracts the complexity of classic AI algorithms by providing a simplified interface that hides the intricacies of each algorithm's implementation. This abstraction allows users to apply these algorithms with minimal configuration and understanding of the underlying mechanisms. Here are examples of specific algorithms that Easylibpal abstracts:
To implement Easylibpal, one would need to create a Python class that encapsulates the functionality of each classic AI algorithm. This class would provide methods for loading datasets, preprocessing data, and applying the algorithm with minimal configuration required from the user. The implementation would leverage existing libraries like scikit-learn for the actual algorithmic computations, abstracting away the complexity of these libraries.
Here's a conceptual example of how the Easylibpal class might be structured for applying a Linear Regression algorithm:
```python
class Easylibpal:
def __init__(self, dataset):
self.dataset = dataset
# Load and preprocess the dataset
def apply_linear_regression(self, target_column):
# Abstracted implementation of Linear Regression
# This method would internally use scikit-learn or another library
# to perform the actual computation, abstracting the complexity
pass
# Usage
Easylibpal = Easylibpal(dataset='your_dataset.csv')
result = Easylibpal.apply_linear_regression(target_column='target')
```
This example demonstrates the concept of Easylibpal by abstracting the complexity of applying a Linear Regression algorithm. The actual implementation would need to include the specifics of loading the dataset, preprocessing it, and applying the algorithm using an underlying library like scikit-learn.
Easylibpal abstracts the complexity of feature selection for classic AI algorithms by providing a simplified interface that automates the process of selecting the most relevant features for each algorithm. This abstraction is crucial because feature selection is a critical step in machine learning that can significantly impact the performance of a model. Here's how Easylibpal handles feature selection for the mentioned algorithms:
To implement feature selection in Easylibpal, one could use scikit-learn's `SelectKBest` or `RFE` classes for feature selection based on statistical tests or model coefficients. Here's a conceptual example of how feature selection might be integrated into the Easylibpal class for Linear Regression:
```python
from sklearn.feature_selection import SelectKBest, f_regression
from sklearn.linear_model import LinearRegression
class Easylibpal:
def __init__(self, dataset):
self.dataset = dataset
# Load and preprocess the dataset
def apply_linear_regression(self, target_column):
# Feature selection using SelectKBest
selector = SelectKBest(score_func=f_regression, k=10)
X_new = selector.fit_transform(self.dataset.drop(target_column, axis=1), self.dataset[target_column])
# Train Linear Regression model
model = LinearRegression()
model.fit(X_new, self.dataset[target_column])
# Return the trained model
return model
# Usage
Easylibpal = Easylibpal(dataset='your_dataset.csv')
model = Easylibpal.apply_linear_regression(target_column='target')
```
This example demonstrates how Easylibpal abstracts the complexity of feature selection for Linear Regression by using scikit-learn's `SelectKBest` to select the top 10 features based on their statistical significance in predicting the target variable. The actual implementation would need to adapt this approach for each algorithm, considering the specific characteristics and requirements of each algorithm.
To implement feature selection in Easylibpal, one could use scikit-learn's `SelectKBest`, `RFE`, or other feature selection classes based on the algorithm's requirements. Here's a conceptual example of how feature selection might be integrated into the Easylibpal class for Logistic Regression using RFE:
```python
from sklearn.feature_selection import RFE
from sklearn.linear_model import LogisticRegression
class Easylibpal:
def __init__(self, dataset):
self.dataset = dataset
# Load and preprocess the dataset
def apply_logistic_regression(self, target_column):
# Feature selection using RFE
model = LogisticRegression()
rfe = RFE(model, n_features_to_select=10)
rfe.fit(self.dataset.drop(target_column, axis=1), self.dataset[target_column])
# Train Logistic Regression model
model.fit(self.dataset.drop(target_column, axis=1), self.dataset[target_column])
# Return the trained model
return model
# Usage
Easylibpal = Easylibpal(dataset='your_dataset.csv')
model = Easylibpal.apply_logistic_regression(target_column='target')
```
This example demonstrates how Easylibpal abstracts the complexity of feature selection for Logistic Regression by using scikit-learn's `RFE` to select the top 10 features based on their importance in the model. The actual implementation would need to adapt this approach for each algorithm, considering the specific characteristics and requirements of each algorithm.
EASYLIBPAL HANDLES DIFFERENT TYPES OF DATASETS
Easylibpal handles different types of datasets with varying structures by adopting a flexible and adaptable approach to data preprocessing and transformation. This approach is inspired by the principles of tidy data and the need to ensure data is in a consistent, usable format before applying AI algorithms. Here's how Easylibpal addresses the challenges posed by varying dataset structures:
One Type in Multiple Tables
When datasets contain different variables, the same variables with different names, different file formats, or different conventions for missing values, Easylibpal employs a process similar to tidying data. This involves identifying and standardizing the structure of each dataset, ensuring that each variable is consistently named and formatted across datasets. This process might include renaming columns, converting data types, and handling missing values in a uniform manner. For datasets stored in different file formats, Easylibpal would use appropriate libraries (e.g., pandas for CSV, Excel files, and SQL databases) to load and preprocess the data before applying the algorithms.
Multiple Types in One Table
For datasets that involve values collected at multiple levels or on different types of observational units, Easylibpal applies a normalization process. This involves breaking down the dataset into multiple tables, each representing a distinct type of observational unit. For example, if a dataset contains information about songs and their rankings over time, Easylibpal would separate this into two tables: one for song details and another for rankings. This normalization ensures that each fact is expressed in only one place, reducing inconsistencies and making the data more manageable for analysis.
Data Semantics
Easylibpal ensures that the data is organized in a way that aligns with the principles of data semantics, where every value belongs to a variable and an observation. This organization is crucial for the algorithms to interpret the data correctly. Easylibpal might use functions like `pivot_longer` and `pivot_wider` from the tidyverse or equivalent functions in pandas to reshape the data into a long format, where each row represents a single observation and each column represents a single variable. This format is particularly useful for algorithms that require a consistent structure for input data.
Messy Data
Dealing with messy data, which can include inconsistent data types, missing values, and outliers, is a common challenge in data science. Easylibpal addresses this by implementing robust data cleaning and preprocessing steps. This includes handling missing values (e.g., imputation or deletion), converting data types to ensure consistency, and identifying and removing outliers. These steps are crucial for preparing the data in a format that is suitable for the algorithms, ensuring that the algorithms can effectively learn from the data without being hindered by its inconsistencies.
To implement these principles in Python, Easylibpal would leverage libraries like pandas for data manipulation and preprocessing. Here's a conceptual example of how Easylibpal might handle a dataset with multiple types in one table:
```python
import pandas as pd
# Load the dataset
dataset = pd.read_csv('your_dataset.csv')
# Normalize the dataset by separating it into two tables
song_table = dataset'artist', 'track'.drop_duplicates().reset_index(drop=True)
song_table['song_id'] = range(1, len(song_table) + 1)
ranking_table = dataset'artist', 'track', 'week', 'rank'.drop_duplicates().reset_index(drop=True)
# Now, song_table and ranking_table can be used separately for analysis
```
This example demonstrates how Easylibpal might normalize a dataset with multiple types of observational units into separate tables, ensuring that each type of observational unit is stored in its own table. The actual implementation would need to adapt this approach based on the specific structure and requirements of the dataset being processed.
CLEAN DATA
Easylibpal employs a comprehensive set of data cleaning and preprocessing steps to handle messy data, ensuring that the data is in a suitable format for machine learning algorithms. These steps are crucial for improving the accuracy and reliability of the models, as well as preventing misleading results and conclusions. Here's a detailed look at the specific steps Easylibpal might employ:
1. Remove Irrelevant Data
The first step involves identifying and removing data that is not relevant to the analysis or modeling task at hand. This could include columns or rows that do not contribute to the predictive power of the model or are not necessary for the analysis .
2. Deduplicate Data
Deduplication is the process of removing duplicate entries from the dataset. Duplicates can skew the analysis and lead to incorrect conclusions. Easylibpal would use appropriate methods to identify and remove duplicates, ensuring that each entry in the dataset is unique.
3. Fix Structural Errors
Structural errors in the dataset, such as inconsistent data types, incorrect values, or formatting issues, can significantly impact the performance of machine learning algorithms. Easylibpal would employ data cleaning techniques to correct these errors, ensuring that the data is consistent and correctly formatted.
4. Deal with Missing Data
Handling missing data is a common challenge in data preprocessing. Easylibpal might use techniques such as imputation (filling missing values with statistical estimates like mean, median, or mode) or deletion (removing rows or columns with missing values) to address this issue. The choice of method depends on the nature of the data and the specific requirements of the analysis.
5. Filter Out Data Outliers
Outliers can significantly affect the performance of machine learning models. Easylibpal would use statistical methods to identify and filter out outliers, ensuring that the data is more representative of the population being analyzed.
6. Validate Data
The final step involves validating the cleaned and preprocessed data to ensure its quality and accuracy. This could include checking for consistency, verifying the correctness of the data, and ensuring that the data meets the requirements of the machine learning algorithms. Easylibpal would employ validation techniques to confirm that the data is ready for analysis.
To implement these data cleaning and preprocessing steps in Python, Easylibpal would leverage libraries like pandas and scikit-learn. Here's a conceptual example of how these steps might be integrated into the Easylibpal class:
```python
import pandas as pd
from sklearn.impute import SimpleImputer
from sklearn.preprocessing import StandardScaler
class Easylibpal:
def __init__(self, dataset):
self.dataset = dataset
# Load and preprocess the dataset
def clean_and_preprocess(self):
# Remove irrelevant data
self.dataset = self.dataset.drop(['irrelevant_column'], axis=1)
# Deduplicate data
self.dataset = self.dataset.drop_duplicates()
# Fix structural errors (example: correct data type)
self.dataset['correct_data_type_column'] = self.dataset['correct_data_type_column'].astype(float)
# Deal with missing data (example: imputation)
imputer = SimpleImputer(strategy='mean')
self.dataset['missing_data_column'] = imputer.fit_transform(self.dataset'missing_data_column')
# Filter out data outliers (example: using Z-score)
# This step requires a more detailed implementation based on the specific dataset
# Validate data (example: checking for NaN values)
assert not self.dataset.isnull().values.any(), "Data still contains NaN values"
# Return the cleaned and preprocessed dataset
return self.dataset
# Usage
Easylibpal = Easylibpal(dataset=pd.read_csv('your_dataset.csv'))
cleaned_dataset = Easylibpal.clean_and_preprocess()
```
This example demonstrates a simplified approach to data cleaning and preprocessing within Easylibpal. The actual implementation would need to adapt these steps based on the specific characteristics and requirements of the dataset being processed.
VALUE DATA
Easylibpal determines which data is irrelevant and can be removed through a combination of domain knowledge, data analysis, and automated techniques. The process involves identifying data that does not contribute to the analysis, research, or goals of the project, and removing it to improve the quality, efficiency, and clarity of the data. Here's how Easylibpal might approach this:
Domain Knowledge
Easylibpal leverages domain knowledge to identify data that is not relevant to the specific goals of the analysis or modeling task. This could include data that is out of scope, outdated, duplicated, or erroneous. By understanding the context and objectives of the project, Easylibpal can systematically exclude data that does not add value to the analysis.
Data Analysis
Easylibpal employs data analysis techniques to identify irrelevant data. This involves examining the dataset to understand the relationships between variables, the distribution of data, and the presence of outliers or anomalies. Data that does not have a significant impact on the predictive power of the model or the insights derived from the analysis is considered irrelevant.
Automated Techniques
Easylibpal uses automated tools and methods to remove irrelevant data. This includes filtering techniques to select or exclude certain rows or columns based on criteria or conditions, aggregating data to reduce its complexity, and deduplicating to remove duplicate entries. Tools like Excel, Google Sheets, Tableau, Power BI, OpenRefine, Python, R, Data Linter, Data Cleaner, and Data Wrangler can be employed for these purposes .
Examples of Irrelevant Data
- Personal Identifiable Information (PII): Data such as names, addresses, and phone numbers are irrelevant for most analytical purposes and should be removed to protect privacy and comply with data protection regulations .
- URLs and HTML Tags: These are typically not relevant to the analysis and can be removed to clean up the dataset.
- Boilerplate Text: Excessive blank space or boilerplate text (e.g., in emails) adds noise to the data and can be removed.
- Tracking Codes: These are used for tracking user interactions and do not contribute to the analysis.
To implement these steps in Python, Easylibpal might use pandas for data manipulation and filtering. Here's a conceptual example of how to remove irrelevant data:
```python
import pandas as pd
# Load the dataset
dataset = pd.read_csv('your_dataset.csv')
# Remove irrelevant columns (example: email addresses)
dataset = dataset.drop(['email_address'], axis=1)
# Remove rows with missing values (example: if a column is required for analysis)
dataset = dataset.dropna(subset=['required_column'])
# Deduplicate data
dataset = dataset.drop_duplicates()
# Return the cleaned dataset
cleaned_dataset = dataset
```
This example demonstrates how Easylibpal might remove irrelevant data from a dataset using Python and pandas. The actual implementation would need to adapt these steps based on the specific characteristics and requirements of the dataset being processed.
Detecting Inconsistencies
Easylibpal starts by detecting inconsistencies in the data. This involves identifying discrepancies in data types, missing values, duplicates, and formatting errors. By detecting these inconsistencies, Easylibpal can take targeted actions to address them.
Handling Formatting Errors
Formatting errors, such as inconsistent data types for the same feature, can significantly impact the analysis. Easylibpal uses functions like `astype()` in pandas to convert data types, ensuring uniformity and consistency across the dataset. This step is crucial for preparing the data for analysis, as it ensures that each feature is in the correct format expected by the algorithms.
Handling Missing Values
Missing values are a common issue in datasets. Easylibpal addresses this by consulting with subject matter experts to understand why data might be missing. If the missing data is missing completely at random, Easylibpal might choose to drop it. However, for other cases, Easylibpal might employ imputation techniques to fill in missing values, ensuring that the dataset is complete and ready for analysis.
Handling Duplicates
Duplicate entries can skew the analysis and lead to incorrect conclusions. Easylibpal uses pandas to identify and remove duplicates, ensuring that each entry in the dataset is unique. This step is crucial for maintaining the integrity of the data and ensuring that the analysis is based on distinct observations.
Handling Inconsistent Values
Inconsistent values, such as different representations of the same concept (e.g., "yes" vs. "y" for a binary variable), can also pose challenges. Easylibpal employs data cleaning techniques to standardize these values, ensuring that the data is consistent and can be accurately analyzed.
To implement these steps in Python, Easylibpal would leverage pandas for data manipulation and preprocessing. Here's a conceptual example of how these steps might be integrated into the Easylibpal class:
```python
import pandas as pd
class Easylibpal:
def __init__(self, dataset):
self.dataset = dataset
# Load and preprocess the dataset
def clean_and_preprocess(self):
# Detect inconsistencies (example: check data types)
print(self.dataset.dtypes)
# Handle formatting errors (example: convert data types)
self.dataset['date_column'] = pd.to_datetime(self.dataset['date_column'])
# Handle missing values (example: drop rows with missing values)
self.dataset = self.dataset.dropna(subset=['required_column'])
# Handle duplicates (example: drop duplicates)
self.dataset = self.dataset.drop_duplicates()
# Handle inconsistent values (example: standardize values)
self.dataset['binary_column'] = self.dataset['binary_column'].map({'yes': 1, 'no': 0})
# Return the cleaned and preprocessed dataset
return self.dataset
# Usage
Easylibpal = Easylibpal(dataset=pd.read_csv('your_dataset.csv'))
cleaned_dataset = Easylibpal.clean_and_preprocess()
```
This example demonstrates a simplified approach to handling inconsistent or messy data within Easylibpal. The actual implementation would need to adapt these steps based on the specific characteristics and requirements of the dataset being processed.
Statistical Imputation
Statistical imputation involves replacing missing values with statistical estimates such as the mean, median, or mode of the available data. This method is straightforward and can be effective for numerical data. For categorical data, mode imputation is commonly used. The choice of imputation method depends on the distribution of the data and the nature of the missing values.
Model-Based Imputation
Model-based imputation uses machine learning models to predict missing values. This approach can be more sophisticated and potentially more accurate than statistical imputation, especially for complex datasets. Techniques like K-Nearest Neighbors (KNN) imputation can be used, where the missing values are replaced with the values of the K nearest neighbors in the feature space.
Using SimpleImputer in scikit-learn
The scikit-learn library provides the `SimpleImputer` class, which supports both statistical and model-based imputation. `SimpleImputer` can be used to replace missing values with the mean, median, or most frequent value (mode) of the column. It also supports more advanced imputation methods like KNN imputation.
To implement these imputation techniques in Python, Easylibpal might use the `SimpleImputer` class from scikit-learn. Here's an example of how to use `SimpleImputer` for statistical imputation:
```python
from sklearn.impute import SimpleImputer
import pandas as pd
# Load the dataset
dataset = pd.read_csv('your_dataset.csv')
# Initialize SimpleImputer for numerical columns
num_imputer = SimpleImputer(strategy='mean')
# Fit and transform the numerical columns
dataset'numerical_column1', 'numerical_column2' = num_imputer.fit_transform(dataset'numerical_column1', 'numerical_column2')
# Initialize SimpleImputer for categorical columns
cat_imputer = SimpleImputer(strategy='most_frequent')
# Fit and transform the categorical columns
dataset'categorical_column1', 'categorical_column2' = cat_imputer.fit_transform(dataset'categorical_column1', 'categorical_column2')
# The dataset now has missing values imputed
```
This example demonstrates how to use `SimpleImputer` to fill in missing values in both numerical and categorical columns of a dataset. The actual implementation would need to adapt these steps based on the specific characteristics and requirements of the dataset being processed.
Model-based imputation techniques, such as Multiple Imputation by Chained Equations (MICE), offer powerful ways to handle missing data by using statistical models to predict missing values. However, these techniques come with their own set of limitations and potential drawbacks:
1. Complexity and Computational Cost
Model-based imputation methods can be computationally intensive, especially for large datasets or complex models. This can lead to longer processing times and increased computational resources required for imputation.
2. Overfitting and Convergence Issues
These methods are prone to overfitting, where the imputation model captures noise in the data rather than the underlying pattern. Overfitting can lead to imputed values that are too closely aligned with the observed data, potentially introducing bias into the analysis. Additionally, convergence issues may arise, where the imputation process does not settle on a stable solution.
3. Assumptions About Missing Data
Model-based imputation techniques often assume that the data is missing at random (MAR), which means that the probability of a value being missing is not related to the values of other variables. However, this assumption may not hold true in all cases, leading to biased imputations if the data is missing not at random (MNAR).
4. Need for Suitable Regression Models
For each variable with missing values, a suitable regression model must be chosen. Selecting the wrong model can lead to inaccurate imputations. The choice of model depends on the nature of the data and the relationship between the variable with missing values and other variables.
5. Combining Imputed Datasets
After imputing missing values, there is a challenge in combining the multiple imputed datasets to produce a single, final dataset. This requires careful consideration of how to aggregate the imputed values and can introduce additional complexity and uncertainty into the analysis.
6. Lack of Transparency
The process of model-based imputation can be less transparent than simpler imputation methods, such as mean or median imputation. This can make it harder to justify the imputation process, especially in contexts where the reasons for missing data are important, such as in healthcare research.
Despite these limitations, model-based imputation techniques can be highly effective for handling missing data in datasets where a amusingness is MAR and where the relationships between variables are complex. Careful consideration of the assumptions, the choice of models, and the methods for combining imputed datasets are crucial to mitigate these drawbacks and ensure the validity of the imputation process.
USING EASYLIBPAL FOR AI ALGORITHM INTEGRATION OFFERS SEVERAL SIGNIFICANT BENEFITS, PARTICULARLY IN ENHANCING EVERYDAY LIFE AND REVOLUTIONIZING VARIOUS SECTORS. HERE'S A DETAILED LOOK AT THE ADVANTAGES:
1. Enhanced Communication: AI, through Easylibpal, can significantly improve communication by categorizing messages, prioritizing inboxes, and providing instant customer support through chatbots. This ensures that critical information is not missed and that customer queries are resolved promptly.
2. Creative Endeavors: Beyond mundane tasks, AI can also contribute to creative endeavors. For instance, photo editing applications can use AI algorithms to enhance images, suggesting edits that align with aesthetic preferences. Music composition tools can generate melodies based on user input, inspiring musicians and amateurs alike to explore new artistic horizons. These innovations empower individuals to express themselves creatively with AI as a collaborative partner.
3. Daily Life Enhancement: AI, integrated through Easylibpal, has the potential to enhance daily life exponentially. Smart homes equipped with AI-driven systems can adjust lighting, temperature, and security settings according to user preferences. Autonomous vehicles promise safer and more efficient commuting experiences. Predictive analytics can optimize supply chains, reducing waste and ensuring goods reach users when needed.
4. Paradigm Shift in Technology Interaction: The integration of AI into our daily lives is not just a trend; it's a paradigm shift that's redefining how we interact with technology. By streamlining routine tasks, personalizing experiences, revolutionizing healthcare, enhancing communication, and fueling creativity, AI is opening doors to a more convenient, efficient, and tailored existence.
5. Responsible Benefit Harnessing: As we embrace AI's transformational power, it's essential to approach its integration with a sense of responsibility, ensuring that its benefits are harnessed for the betterment of society as a whole. This approach aligns with the ethical considerations of using AI, emphasizing the importance of using AI in a way that benefits all stakeholders.
In summary, Easylibpal facilitates the integration and use of AI algorithms in a manner that is accessible and beneficial across various domains, from enhancing communication and creative endeavors to revolutionizing daily life and promoting a paradigm shift in technology interaction. This integration not only streamlines the application of AI but also ensures that its benefits are harnessed responsibly for the betterment of society.
USING EASYLIBPAL OVER TRADITIONAL AI LIBRARIES OFFERS SEVERAL BENEFITS, PARTICULARLY IN TERMS OF EASE OF USE, EFFICIENCY, AND THE ABILITY TO APPLY AI ALGORITHMS WITH MINIMAL CONFIGURATION. HERE ARE THE KEY ADVANTAGES:
- Simplified Integration: Easylibpal abstracts the complexity of traditional AI libraries, making it easier for users to integrate classic AI algorithms into their projects. This simplification reduces the learning curve and allows developers and data scientists to focus on their core tasks without getting bogged down by the intricacies of AI implementation.
- User-Friendly Interface: By providing a unified platform for various AI algorithms, Easylibpal offers a user-friendly interface that streamlines the process of selecting and applying algorithms. This interface is designed to be intuitive and accessible, enabling users to experiment with different algorithms with minimal effort.
- Enhanced Productivity: The ability to effortlessly instantiate algorithms, fit models with training data, and make predictions with minimal configuration significantly enhances productivity. This efficiency allows for rapid prototyping and deployment of AI solutions, enabling users to bring their ideas to life more quickly.
- Democratization of AI: Easylibpal democratizes access to classic AI algorithms, making them accessible to a wider range of users, including those with limited programming experience. This democratization empowers users to leverage AI in various domains, fostering innovation and creativity.
- Automation of Repetitive Tasks: By automating the process of applying AI algorithms, Easylibpal helps users save time on repetitive tasks, allowing them to focus on more complex and creative aspects of their projects. This automation is particularly beneficial for users who may not have extensive experience with AI but still wish to incorporate AI capabilities into their work.
- Personalized Learning and Discovery: Easylibpal can be used to enhance personalized learning experiences and discovery mechanisms, similar to the benefits seen in academic libraries. By analyzing user behaviors and preferences, Easylibpal can tailor recommendations and resource suggestions to individual needs, fostering a more engaging and relevant learning journey.
- Data Management and Analysis: Easylibpal aids in managing large datasets efficiently and deriving meaningful insights from data. This capability is crucial in today's data-driven world, where the ability to analyze and interpret large volumes of data can significantly impact research outcomes and decision-making processes.
In summary, Easylibpal offers a simplified, user-friendly approach to applying classic AI algorithms, enhancing productivity, democratizing access to AI, and automating repetitive tasks. These benefits make Easylibpal a valuable tool for developers, data scientists, and users looking to leverage AI in their projects without the complexities associated with traditional AI libraries.
2 notes
·
View notes
Text
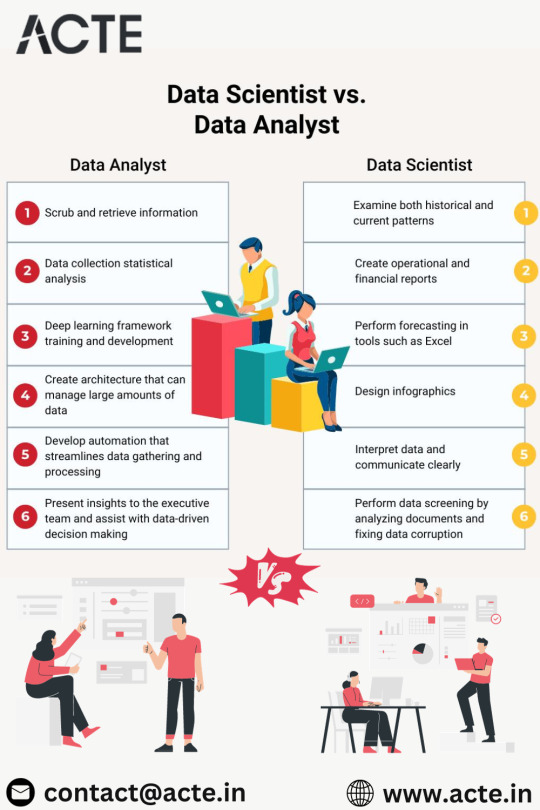
Decoding Data Roles: A Comprehensive Guide to Data Analysts and Data Scientists
In today's data-driven landscape, the roles of data analysts and data scientists share some similarities but differ significantly in terms of their focus, skill sets, and the scope of their work. As organizations increasingly recognize the importance of these roles, the demand for skilled professionals has led to the emergence of various data science institutes. Let's explore the nuances that differentiate a data analyst from a data scientist, while also considering the importance of choosing the best Data Science institute for a comprehensive education in this field.

Let's delve into the nuances that differentiate a data analyst from a data scientist.
1. The Scope of Work:
Data analysts and data scientists play distinct roles when it comes to the scope of their work.
Data Analyst:
Data analysts are the interpreters of historical data. Their primary focus lies in uncovering trends, generating reports, and providing insights that aid day-to-day operations within an organization. They work with structured data, employing tools such as Excel, SQL, and visualization tools like Tableau or Power BI. The problems they address are typically well-defined and pertain to specific queries.
Data Scientist:
Data scientists, on the other hand, have a broader scope. While data analysis is a part of their work, they are also deeply involved in more complex tasks. This includes developing machine learning models, engaging in predictive modeling, and conducting advanced analytics. Data scientists deal with unstructured or semi-structured data, addressing more intricate and less defined problems. Their role extends beyond routine data interpretation to include exploratory data analysis, hypothesis testing, and the development of algorithms.
2. Skill Sets:
The skill sets required for data analysts and data scientists highlight the differences in their roles.
Data Analyst:
Data analysts need a strong foundation in statistical analysis, data cleaning, and proficiency in tools like Excel and SQL. While they may have some programming skills, they typically do not require the same level of expertise in machine learning. Visualization tools are a key part of their toolkit, enabling them to communicate insights effectively.
Data Scientist:
Data scientists require a more comprehensive skill set. They need a deep understanding of statistics, machine learning, and programming languages such as Python or R. Proficiency in data preprocessing, feature engineering, model selection, and evaluation is essential. Data scientists often work with big data technologies and possess advanced knowledge of analytical techniques, enabling them to create and implement complex algorithms.
3. Problem Complexity:
The complexity of problems tackled by data analysts and data scientists varies significantly.
Data Analyst:
Data analysts generally deal with well-defined problems and questions. Their focus is on providing answers to specific queries based on structured data. The insights they provide contribute to the day-to-day decision-making processes within an organization.
Data Scientist:
Data scientists thrive on addressing more complex and less structured problems. They engage in exploratory data analysis, hypothesis testing, and the creation of models capable of handling unstructured or semi-structured data. The solutions they develop often contribute to strategic decision-making, driving innovation, process optimization, and the creation of new products or services.
4. Business Impact:
The impact of data analysts and data scientists on an organization's decision-making processes is another area of distinction.
Data Analyst:
The insights provided by data analysts are integral to operational improvements and day-to-day decision-making. Their work contributes to the efficiency and effectiveness of ongoing processes within the organization.
Data Scientist:
Data scientists play a more strategic role in decision-making. Their insights have a broader impact on the organization, driving innovation, shaping long-term strategies, and contributing to the development of new products or services. The impact of a data scientist's work extends beyond routine operations, influencing the overall direction of the organization.
5. Educational Background:
The educational backgrounds of data analysts and data scientists reflect the differences in the complexity of their roles.
Data Analyst:
Data analysts may have a background in fields such as statistics, mathematics, economics, or business. While a bachelor's degree is often sufficient, some roles may require a master's degree.
Data Scientist:
Data scientists typically hold more advanced degrees, such as a master's or Ph.D., in fields like computer science, statistics, or data science. The nature of their work demands a deeper understanding of advanced mathematical and statistical concepts, as well as expertise in machine learning.
In conclusion, the divergence between data analysts and data scientists is profound, marked by distinctions in complexity, skill prerequisites, and organizational impact. Data analysts concentrate on offering actionable insights from existing data, enhancing day-to-day decision-making processes. In contrast, data scientists embark on tackling intricate issues, employing advanced analytics and machine learning to derive predictive and prescriptive insights that play a pivotal role in shaping an organization's strategic direction.As the demand for skilled professionals in these domains grows, the relevance of quality education becomes paramount. Choosing the best Data Science courses in Chennai is a crucial step in acquiring the necessary expertise for a successful career in the evolving landscape of data science.
3 notes
·
View notes
Text
Inside the Course: What You'll Learn in GVT Academy's Data Analyst Program with AI and VBA

If you're searching for the Best Data Analyst Course with VBA using AI in Noida, GVT Academy offers a cutting-edge curriculum designed to equip you with the skills employers want in 2025. In an age where data is king, the ability to analyze, automate, and visualize information is what separates good analysts from great ones.
Let’s explore the modules inside this powerful course — from basic tools to advanced technologies — all designed with real-world outcomes in mind.
Module 1: Advanced Excel – Master the Basics, Sharpen the Edge
You start with Advanced Excel, a must-have tool for every data analyst. This module helps you upgrade your skills from intermediate to advanced level with:
Advanced formulas like XLOOKUP, IFERROR, and nested functions
Data cleaning techniques using Power Query
Creating interactive dashboards with Pivot Tables
Case-based learning from real business scenarios
This strong foundation ensures you're ready to dive deeper into automation and analytics.
Module 2: VBA Programming – Automate Your Data Workflow
Visual Basic for Applications (VBA) is a game-changer when it comes to saving time. Here’s what you’ll learn:
Automate tasks with macros and loops
Build interactive forms for better data entry
Develop automated reporting tools
Integrate Excel with external databases or emails
This module gives you a serious edge by teaching real-time automation for daily tasks, making you stand out in interviews and on the job.
Module 3: Artificial Intelligence for Analysts – Data Meets Intelligence
This is where things get futuristic. You’ll learn how AI is transforming data analysis:
Basics of machine learning with simple use cases
Use AI tools (like ChatGPT or Excel Copilot) to write smarter formulas
Forecast sales or trends using Python-based models
Explore AI in data cleaning, classification, and clustering
GVT Academy blends the power of AI and VBA to offer a standout Data Analyst Course in Noida, designed to help students gain a competitive edge in the job market.
Module 4: SQL – Speak the Language of Databases
Data lives in databases, and SQL helps you retrieve it efficiently. This module focuses on:
Writing SELECT, JOIN, and GROUP BY queries
Creating views, functions, and subqueries
Connecting SQL output directly to Excel and Power BI
Handling large volumes of structured data
You’ll practice on real datasets and become fluent in working with enterprise-level databases.
Module 5: Power BI – Turn Data into Stories
More than numbers, data analysis is about discovering what the numbers truly mean. In the Power BI module, you'll:
Import, clean, and model data
Create interactive dashboards for business reporting
Use DAX functions to create calculated metrics
Publish and share reports using Power BI Service
By mastering Power BI, you'll learn to tell data-driven stories that influence business decisions.
Module 6: Python – The Language of Modern Analytics
Python is one of the most in-demand skills for data analysts, and this module helps you get hands-on:
Python fundamentals: Variables, loops, and functions
Working with Pandas, NumPy, and Matplotlib
Data manipulation, cleaning, and visualization
Introduction to machine learning with Scikit-Learn
Even if you have no coding background, GVT Academy ensures you learn Python in a beginner-friendly and project-based manner.
Course Highlights That Make GVT Academy #1
👨🏫 Expert mentors with industry experience
🧪 Real-life projects for each module
💻 Live + recorded classes for flexible learning
💼 Placement support and job preparation sessions
📜 Certification recognized by top recruiters
Every module is designed with job-readiness in mind, not just theory.
Who Should Join This Course?
This course is perfect for:
Freshers wanting a high-paying career in analytics
Working professionals in finance, marketing, or operations
B.Com, BBA, and MBA graduates looking to upskill
Anyone looking to switch to data-driven roles
Final Words
If you're looking to future-proof your career, this course is your launchpad. With six powerful modules and job-focused training, GVT Academy is proud to offer the Best Data Analyst Course with VBA using AI in Noida — practical, placement-driven, and perfect for 2025.
📞 Don’t Miss Out – Limited Seats. Enroll Now with GVT Academy and Transform Your Career!
1. Google My Business: http://g.co/kgs/v3LrzxE
2. Website: https://gvtacademy.com
3. LinkedIn: www.linkedin.com/in/gvt-academy-48b916164
4. Facebook: https://www.facebook.com/gvtacademy
5. Instagram: https://www.instagram.com/gvtacademy/
6. X: https://x.com/GVTAcademy
7. Pinterest: https://in.pinterest.com/gvtacademy
8. Medium: https://medium.com/@gvtacademy
#gvt academy#data analytics#advanced excel training#data science#python#sql course#advanced excel training institute in noida#best powerbi course#power bi#advanced excel#vba
0 notes
Text
Choosing a Career in Data Science After High School: A Smart Move for the Future
Today, data emerges as a critical asset in the digital-driven world. Data is the trigger of modern innovation across industries ranging from personalized video suggestions to real-time fraud detection. Data science is a lively venue where rational thinking, technical acumen, and market intuition blend for extracting value-forming patterns out of large information pools.
After class 12, those passionate about career paths beyond elements of the conventional paradigms may consider a promising data science. It is oriented towards modern trends, it pays great attention to practical skills as well as has a lot of room for advancement.

Why Consider Data Science After 12th?
In the past, data science was somewhat synonymous with a postgraduate course; however, things have changed. Aware of the advantages of early data science introduction, various colleges today offer introductory courses, which will enable students to accumulate vital knowledge after finishing school.
Opting for data science after 12th provides an edge. While your mental capabilities are most open to learn, the acquisition of basic programming, statistical analysis, and data handling becomes easier. Since your classmates will only be getting started with the concepts in higher education, you will be busy on projects, doing certifications, and submitting internship applications.
1-Year Data Science Course: A Focused Start
If a full data science degree is a turn off for you, or you are seeking to learn skills quickly a 1-year data science course is a viable option. These courses are designed to help you learn faster by focusing on the most important skills and ideas requested by the industry.
Typically, a 1-year course includes:
Programming languages like Python or R
Fundamentals of statistics and data visualization
Introduction to machine learning algorithms
Real-world data analysis projects
Exposure to tools such as Excel, SQL, Tableau, or Power BI
With these skills, you're not just academically enriched but also job-ready. Many companies now hire freshers with data analytics skills for entry-level roles in operations, marketing, and business intelligence.
Diploma in Data Analytics: Practical and Career-Oriented
Another great option for students after 12th is pursuing a diploma in data analytics. This course is ideal for those who want to focus more on interpreting data and drawing meaningful insights rather than building complex algorithms or models.
While data science includes heavy statistical modeling and machine learning, data analytics focuses on tools and techniques to understand trends, performance, and patterns in datasets.
Most diploma courses cover:
Microsoft Excel and advanced spreadsheets
SQL and relational database management
Visualization tools like Tableau or Power BI
Basic statistics and trend analysis
Capstone projects involving business cases
A diploma in data analytics is particularly useful for roles in business analysis, operations, marketing analytics, and finance. These are practical roles where companies need people who can understand the story behind the numbers and help improve business decisions.
Finding the Right Data Science Colleges in Delhi
Delhi, being one of India's top education hubs, has several reputed colleges offering data science and analytics programs. These colleges offer a wide variety of courses including certification programs, diplomas, and degrees—some of which are tailored for students fresh out of school.
When selecting a college, look for:
Course curriculum and how updated it is
Availability of hands-on learning through labs or projects
Placement support and industry tie-ups
Faculty with industry experience
Certifications and internships included in the course
Being in Delhi also gives students exposure to a large pool of tech startups, data-centric companies, and networking opportunities through seminars and workshops.
Who Should Choose Data Science?
You don’t have to be a math genius or a computer wizard to enter the field of data science. What matters more is your curiosity, problem-solving ability, and interest in technology. If you're someone who:
Likes solving puzzles or logical challenges
Enjoys working with numbers and spotting patterns
Wants to explore a career with real-world impact
Is open to learning new tools and technologies
then data science could be the right path for you. While a background in science or math is helpful, students from commerce or humanities can also excel by focusing on statistics and learning programming gradually.
Career Opportunities Ahead
The beauty of starting early in data science is the variety of roles it opens up. Depending on your skillset and interest, you can grow into roles like:
Data Analyst
Business Intelligence Developer
Data Engineer
Machine Learning Specialist
Marketing Analyst
Financial Data Consultant
These roles are in demand not just in the tech sector but also in healthcare, education, retail, finance, logistics, and more. Companies today understand the value of data-driven decision-making, and professionals with analytical skills are always in demand.
Conclusion
Choosing data science after 12th is a forward-thinking decision that can set you apart in a highly competitive job market. Whether you pursue a diploma in data analytics or a 1-year data science course, you gain practical skills that can lead to a fulfilling and well-paying career.If you’re looking to begin your journey in data science and are searching for a strong academic foundation, institutions like AAFT offer specialized programs that blend theory with real-world application, ensuring students are not only academically prepared but also industry-ready.
#data science course#data science institute#diploma in data science#data science institute in delhi#data analysis courses
0 notes
Text
How to Improve Database Performance with Smart Optimization Techniques
Database performance is critical to the efficiency and responsiveness of any data-driven application. As data volumes grow and user expectations rise, ensuring your database runs smoothly becomes a top priority. Whether you're managing an e-commerce platform, financial software, or enterprise systems, sluggish database queries can drastically hinder user experience and business productivity.
In this guide, we’ll explore practical and high-impact strategies to improve database performance, reduce latency, and increase throughput.
1. Optimize Your Queries
Poorly written queries are one of the most common causes of database performance issues. Avoid using SELECT * when you only need specific columns. Analyze query execution plans to understand how data is being retrieved and identify potential inefficiencies.
Use indexed columns in WHERE, JOIN, and ORDER BY clauses to take full advantage of the database indexing system.
2. Index Strategically
Indexes are essential for speeding up data retrieval, but too many indexes can hurt write performance and consume excessive storage. Prioritize indexing on columns used in search conditions and join operations. Regularly review and remove unused or redundant indexes.
3. Implement Connection Pooling
Connection pooling allows multiple application users to share a limited number of database connections. This reduces the overhead of opening and closing connections repeatedly, which can significantly improve performance, especially under heavy load.
4. Cache Frequently Accessed Data
Use caching layers to avoid unnecessary hits to the database. Frequently accessed and rarely changing data—such as configuration settings or product catalogs—can be stored in in-memory caches like Redis or Memcached. This reduces read latency and database load.
5. Partition Large Tables
Partitioning splits a large table into smaller, more manageable pieces without altering the logical structure. This improves performance for queries that target only a subset of the data. Choose partitioning strategies based on date, region, or other logical divisions relevant to your dataset.
6. Monitor and Tune Regularly
Database performance isn’t a one-time fix—it requires continuous monitoring and tuning. Use performance monitoring tools to track query execution times, slow queries, buffer usage, and I/O patterns. Adjust configurations and SQL statements accordingly to align with evolving workloads.
7. Offload Reads with Replication
Use read replicas to distribute query load, especially for read-heavy applications. Replication allows you to spread read operations across multiple servers, freeing up the primary database to focus on write operations and reducing overall latency.
8. Control Concurrency and Locking
Poor concurrency control can lead to lock contention and delays. Ensure your transactions are short and efficient. Use appropriate isolation levels to avoid unnecessary locking, and understand the impact of each level on performance and data integrity.
0 notes
Text
The Performance Trade-offs Between SELECT * INTO and SELECT THEN INSERT in T-SQL
In the realm of SQL Server development, understanding the intricacies of query optimization can drastically impact the performance of your applications. A common scenario that developers encounter involves deciding between using SELECT * INTO to create and populate a temporary table at the beginning of a stored procedure versus first creating a temp table and then populating it with a SELECT…
View On WordPress
#efficient data handling in SQL#query optimization techniques#SELECT INTO vs INSERT#SQL Server temp tables#T-SQL performance optimization#TempTable
0 notes
Text
ChatGPT & Data Science: Your Essential AI Co-Pilot

The rise of ChatGPT and other large language models (LLMs) has sparked countless discussions across every industry. In data science, the conversation is particularly nuanced: Is it a threat? A gimmick? Or a revolutionary tool?
The clearest answer? ChatGPT isn't here to replace data scientists; it's here to empower them, acting as an incredibly versatile co-pilot for almost every stage of a data science project.
Think of it less as an all-knowing oracle and more as an exceptionally knowledgeable, tireless assistant that can brainstorm, explain, code, and even debug. Here's how ChatGPT (and similar LLMs) is transforming data science projects and how you can harness its power:
How ChatGPT Transforms Your Data Science Workflow
Problem Framing & Ideation: Struggling to articulate a business problem into a data science question? ChatGPT can help.
"Given customer churn data, what are 5 actionable data science questions we could ask to reduce churn?"
"Brainstorm hypotheses for why our e-commerce conversion rate dropped last quarter."
"Help me define the scope for a project predicting equipment failure in a manufacturing plant."
Data Exploration & Understanding (EDA): This often tedious phase can be streamlined.
"Write Python code using Pandas to load a CSV and display the first 5 rows, data types, and a summary statistics report."
"Explain what 'multicollinearity' means in the context of a regression model and how to check for it in Python."
"Suggest 3 different types of plots to visualize the relationship between 'age' and 'income' in a dataset, along with the Python code for each."
Feature Engineering & Selection: Creating new, impactful features is key, and ChatGPT can spark ideas.
"Given a transactional dataset with 'purchase_timestamp' and 'product_category', suggest 5 new features I could engineer for a customer segmentation model."
"What are common techniques for handling categorical variables with high cardinality in machine learning, and provide a Python example for one."
Model Selection & Algorithm Explanation: Navigating the vast world of algorithms becomes easier.
"I'm working on a classification problem with imbalanced data. What machine learning algorithms should I consider, and what are their pros and cons for this scenario?"
"Explain how a Random Forest algorithm works in simple terms, as if you're explaining it to a business stakeholder."
Code Generation & Debugging: This is where ChatGPT shines for many data scientists.
"Write a Python function to perform stratified K-Fold cross-validation for a scikit-learn model, ensuring reproducibility."
"I'm getting a 'ValueError: Input contains NaN, infinity or a value too large for dtype('float64')' in my scikit-learn model. What are common reasons for this error, and how can I fix it?"
"Generate boilerplate code for a FastAPI endpoint that takes a JSON payload and returns a prediction from a pre-trained scikit-learn model."
Documentation & Communication: Translating complex technical work into understandable language is vital.
"Write a clear, concise docstring for this Python function that preprocesses text data."
"Draft an executive summary explaining the results of our customer churn prediction model, focusing on business impact rather than technical details."
"Explain the limitations of an XGBoost model in a way that a non-technical manager can understand."
Learning & Skill Development: It's like having a personal tutor at your fingertips.
"Explain the concept of 'bias-variance trade-off' in machine learning with a practical example."
"Give me 5 common data science interview questions about SQL, and provide example answers."
"Create a study plan for learning advanced topics in NLP, including key concepts and recommended libraries."
Important Considerations and Best Practices
While incredibly powerful, remember that ChatGPT is a tool, not a human expert.
Always Verify: Generated code, insights, and especially factual information must always be verified. LLMs can "hallucinate" or provide subtly incorrect information.
Context is King: The quality of the output directly correlates with the quality and specificity of your prompt. Provide clear instructions, examples, and constraints.
Data Privacy is Paramount: NEVER feed sensitive, confidential, or proprietary data into public LLMs. Protecting personal data is not just an ethical imperative but a legal requirement globally. Assume anything you input into a public model may be used for future training or accessible by the provider. For sensitive projects, explore secure, on-premises or private cloud LLM solutions.
Understand the Fundamentals: ChatGPT is an accelerant, not a substitute for foundational knowledge in statistics, machine learning, and programming. You need to understand why a piece of code works or why an an algorithm is chosen to effectively use and debug its outputs.
Iterate and Refine: Don't expect perfect results on the first try. Refine your prompts based on the output you receive.
ChatGPT and its peers are fundamentally changing the daily rhythm of data science. By embracing them as intelligent co-pilots, data scientists can boost their productivity, explore new avenues, and focus their invaluable human creativity and critical thinking on the most complex and impactful challenges. The future of data science is undoubtedly a story of powerful human-AI collaboration.
0 notes
Text
Decode the Future: Enroll in a Top Data Science Course in Coimbatore Today

Smart devices, big data, and artificial intelligence (AI) have driven need for experts with knowledge of data interpretation and extracting insights. These experts help to create healthcare algorithms, forecast consumer spending, and handle supply networks. Every industry makes decisions based on this information. Xploreitcorp's data science course in Coimbatore could be a pivotal turning point for early-careers professionals and students wishing to explore this emerging area.
Why is the skill of the decade data science?
Data science has evolved into one of the most important disciplines in the modern day. With industries creating data at trillions of gigabytes every day, experts are more and more relied upon to extract data and forecast future trends which can help to solve practical problems. Data science helps you to become a wizard analyzing many fields like Data Science, Business Intelligence, Computer Science, Statistics along with advanced analytical strategies to derive conclusions in difficulties that need to be resolved.
Completing a data science course in Coimbatore prepares the students with a fully developed Coimbatore data science curriculum. Coimbatore, a rising tech center, not only gives education but also lots of chances for using data science in practical corporate environments.
Why Coimbatore is the Greatest Location to Learn Data Science
Coimbatore, sometimes known as the Manchester of South India, is currently turning into one of the fastest-growing technological hotspots thanks to its amazing expansion in the textile and manufacturing sectors. New companies, IT parks, and tech-learning colleges opening in Coimbatore have brought about expansion. This gives everyone following a full data science education in Coimbatore with practical experience, cheap cost of living, and reasonably priced infrastructure a competitive edge.
Further improving the learning environment are access to a vibrant student ecosystem, industrial partnerships, and seasoned mentors. Students are not limited to the intellectual sides of things. Practical work in the form of supervision, industry projects, and internships presents lots of chances.
The Principles: Define Data Science.
Wide-ranging discipline dedicated to obtaining insightful analysis from enormous volumes of unstructured data is data science. One would fulfill tasks including data purification, exploratory data analysis, statistical modeling, machine learning, and data visualization as a data scientist. Programming languages as Python, R, SQL, Tableau or Power BI enable a data scientist to create commercial and technical strategies from challenging data sets.
Selecting a data science course in Coimbatore helps students develop abilities in line with the confidence needed to start thorough data initiatives. From data collecting to predictive analytics, the students pick up knowledge that helps them to address practical data problems.
Data science against data analytics: their relationship
While data analytics is usually connected with trend and pattern finding by means of historical data, data science is more bent toward predictive and prescriptive modeling. The two realms clearly interact, hence the study of one helps the other. This is why numerous institutions, notably Xploreitcorp, include the ideas of a data analytics course in Coimbatore within the data science curricula.
Data analytics allows students to start with simpler techniques include creating Excel dashboards, descriptive statistics, and SQL querying prior to moving to advanced machine learning models. This sequential development helps some students understand all facets of data manipulation and analysis.
Power BI: Data Visualization's Skill
Working with data requires plenty of data visualization, which is sometimes underappreciated. Having a strong analytical toolkit is useless without a means of communication for the results. Often taught together with data science and analytics classes, Power BI is one of the several tools Microsoft created for data visualization.
Students enrolled in a data analytics training in Coimbatore at Xploreitcorp have Power BI abilities that will help them to generate dynamic dashboards and convincing reports from unprocessed data. For students hoping to enter the corporate sector, where the quick presentation of KPIs (Key Performance Indicators) improves decision-making, these abilities become rather valuable.
How Xploreitcorp Organizes Its Course on Data Science
Xploreitcorp's data science course in Coimbatore conforms to industry standards now in use. It covers Python programming, statistics, data wrangling, machine learning, even deep learning. Above all, these paradigms are meant to enable even total novices from non-technical disciplines grow and shine.
Training comprises of the performance of live projects in addition to theoretical education. Students examine actual sales forecasting, consumer segmentation, financial modeling, even sentiment analysis data. Under this kind of instruction, students develop confidence in both theoretical ideas and their pragmatic relevance.
Students registered in the Coimbatore data analytics course also have focused sessions stressing Excel automation, data extraction, and business analysis. Both courses together help one to grasp what it means to engage with data in the modern society.
Jobs Following Data Science Course Completion
Students enrolled in Coimbatore's data science courses are well-known for seeking courses due in large part to the abundance of employment that follow. Data professionals are in more demand than there is supply, hence businesses are rushing to find them in many different sectors. Students qualify for the following designations after the course:
data scientist
Data Analyst
Designer of Business Intelligence
Engineer in Machine Learning
Datas Engineer
Students can also aspire for roles including Business Analyst, Reporting Analyst, and Dashboard Specialist when a data analytics school in Coimbatore finds place within the mix. All of these prospects have excellent opportunity for development, varied experiences per sector, and decent salary.
Who Should Register in this Course?
One thing that distinguishes data science from other disciplines of study is its attraction to students in many spheres of learning. Whether your field of study is engineering, business, statistics, even the arts, you can succeed in this field as long as you are fascinated in numbers and patterns.
Students from B.Sc. and B.Com degrees, MBA, even humanities streams, have effectively completed our data science course in Coimbatore at Xploreitcorp. Night and weekend batches help those already working especially enter analytics more easily.
Mid-career workers in marketing, HR, finance, or operations who want to grasp data concepts would find the Coimbatore data analytics course ideal for them so improving their organizational and strategic skills.
Placement Support and Internships
Xploreitcorp's career services give these students great value in the form of mock interviews, portfolio building, internship advice, and resume writing seminars. Designed especially for students and recent graduates changing careers, career-oriented services provide help in handling the employment obstacles.
Students on the data science course in Coimbatore work with local businesses and startups on real-world projects under part of our industry relationships, therefore enhancing their employability skills. Using customized coaching and seminars, our placement cell helps each of the students get ready for interviews, evaluates their competencies, and finds appropriate job.
Why Xploreitcorp for Data Science?
Theoretical knowledge is insufficient, thus at Xploreitcorp, we also place equal value to practical practice. Our courses include the "Learn by Doing" method. While the students have access to current labs with modern tools and software relevant to their sector, the faculty members that teach our students are actual professionals that have filled real positions in analytics and other similar subjects.
Our Coimbatore data science course is affordable and meant to fit working professionals as well as students. Every student is assured plenty of attention and the ability to practically engage with our tailored mentoring, milestones, and project-based learning.
Combining this curriculum with our Coimbatore data analytics course helps students to improve their basic understanding, therefore increasing their chances for success and employment.
Your Future in Data Science Begins Right Now.
Data is expanding at an unheard-of pace, and the leaders of tommorow will be those who can leverage this capability. Enrolling in a data science degree in Coimbatore could simply be the best decision ever for students hoping for a profession with great growth potential and impact.
Starting with Xploreitcorp provides you the tools and technologies as well as the mentality and critical thinking abilities defining data professionals today. If a data analytics course in Coimbatore additionally provides strategic insights, you will be a whole package suitable for any data related job.
Details of Enrollment
Are you trying to advance in your career? We provide easy ways for you to sign up with us: 🌐 Website: www.xploreitcorp.com
📧 Email: [email protected] 📍 Visit: Xploreitcorp Training Center, Coimbatore
Our team provides assistance with batch schedules, fee details, and other questions you may have.
FAQs:
1. Who can join the Data Science course in Coimbatore? Anyone interested in data—students, graduates, or professionals from any background.
2. How is Data Science different from Data Analytics? Data Science includes analytics plus machine learning and predictive modeling, while analytics focuses on interpreting data trends.
3. What tools will I learn in the course? You'll learn Python, SQL, R, Excel, Tableau, Power BI, and ML libraries.
4. Will I get a certificate after the course? Yes, you’ll receive an industry-recognized certification from Xploreitcorp.
5. Is placement support available? Yes, we provide resume help, mock interviews, and job referrals after course completion.
0 notes
Text
Best Data Science Courses Online in India with Python and Machine Learning
In 2025, India stands at the forefront of the data revolution. Organizations across finance, healthcare, e-commerce, and logistics are leveraging data science to make smarter decisions. From predictive analytics and customer segmentation to fraud detection and supply chain optimization, the demand for skilled data professionals has never been higher.
And what’s at the core of this demand?
Two essential tools: Python and Machine Learning (ML).
If you're looking to build a future-proof career or upskill in one of the most in-demand fields, enrolling in one of the best data science courses online in India with Python and Machine Learning is a strategic move.
This guide explores top programs that deliver high-quality training, hands-on projects, and real-world industry applications—fully online and accessible from anywhere in India.
Why Python and Machine Learning Are a Must for Data Scientists?
Python and machine learning are foundational to modern data science because they provide the tools and techniques necessary to extract insights, build predictive models, and solve complex problems using data. Python, in particular, has become the go-to programming language for data scientists due to its simplicity, readability, and vast ecosystem of data-focused libraries.
Python: A Versatile and Accessible Tool Python’s syntax is beginner-friendly, yet powerful enough for advanced data manipulation and modeling. Libraries such as Pandas, NumPy, and Matplotlib make data cleaning, analysis, and visualization straightforward. Tools like Scikit-learn, TensorFlow, and PyTorch offer seamless integration of machine learning capabilities, allowing data scientists to build and test models efficiently. Its flexibility also allows for integration with web applications, databases, and cloud platforms, making Python a one-stop solution for end-to-end data science projects.
Machine Learning: Turning Data into Predictions Machine learning is essential for turning historical data into actionable insights. It enables data scientists to create models that identify patterns, forecast trends, and make data-driven decisions with minimal human intervention. From customer segmentation to fraud detection, machine learning automates the analytical process and scales it to handle large and complex datasets that traditional methods can't manage effectively.
Industry Demand and Real-World Impact The demand for data scientists who are proficient in Python and machine learning is consistently high across industries including finance, healthcare, retail, and technology. Employers seek professionals who can not only interpret data but also build intelligent systems that learn and adapt over time. Mastery of these tools is no longer optional—it’s expected.
How to Choose the Best Online Data Science Course in India at Boston Institute of Analytics?
Before selecting a course, clearly define what you aim to achieve. Are you looking to switch careers, upskill for a current role, or gain a certification to boost your resume? Boston Institute of Analytics (BIA) offers different levels of courses—from beginner to advanced—so choosing a program that aligns with your goals is essential.
Evaluate the Curriculum Structure A strong data science course should offer a well-balanced mix of foundational theory and practical application. Look for a BIA course that covers key topics such as Python programming, statistics, machine learning, data visualization, SQL, and big data technologies. The best courses also include capstone projects or case studies that simulate real-world scenarios.
Check the Faculty Credentials and Teaching Methodology The quality of instruction plays a significant role in your learning experience. Explore the profiles of faculty members—do they have industry experience? Are they active practitioners or researchers in data science? BIA is known for having instructors with real-world expertise, but it’s worth confirming for the specific course you’re considering.
Look for Hands-On Learning Opportunities Data science is a highly practical field. Choose a BIA course that emphasizes hands-on projects, coding exercises, and tool-based learning using platforms like Jupyter Notebook, Tableau, or Power BI. The more you practice, the better prepared you'll be for actual job roles.
Review Course Format and Flexibility Since you’re considering an online course, make sure it fits your schedule and learning preferences. BIA offers live online sessions, recorded lectures, and doubt-clearing sessions—choose the format that best supports your productivity and discipline.
Check Certification and Career Support A recognized certificate from BIA can enhance your profile. In addition, confirm if the course provides job placement assistance, resume workshops, or access to hiring partners. Strong career support can significantly boost your transition into a data science role.
Compare Cost and ROI Finally, weigh the course fee against the value it offers. BIA’s courses are competitively priced for the Indian market, especially considering the global recognition and practical exposure they provide. Ensure that the skills and certification gained will give you a return on investment through better job opportunities or salary growth.
Final Thoughts: Choosing the Best Data Science Course Online in India with Python and Machine Learning
Whether you’re a student exploring the field or a working professional looking to pivot careers, the combination of Python and machine learning is your gateway into the thriving world of data science.
In India’s digitally transforming landscape, enrolling in a reputed, hands-on, and career-focused data science course online India can set you apart. Look for programs that offer real projects, mentorship, and up-to-date content tailored to industry demands.
#Best Data Science Courses Online India#Artificial Intelligence Course Online India#Data Scientist Course Online India#Machine Learning Course Online India
0 notes
Text
Smart Adaptive Filtering Improves AlloyDB AI Vector Search

A detailed look at AlloyDB's vector search improvements
Intelligent Adaptive Filtering Improves Vector Search Performance in AlloyDB AI
Google Cloud Next 2025: Google Cloud announced new ScaNN index upgrades for AlloyDB AI to improve structured and unstructured data search quality and performance. The Google Cloud Next 2025 advancements meet the increased demand for developers to create generative AI apps and AI agents that explore many data kinds.
Modern relational databases like AlloyDB for PostgreSQL now manage unstructured data with vector search. Combining vector searches with SQL filters on structured data requires careful optimisation for high performance and quality.
Filtered Vector Search issues
Filtered vector search allows specified criteria to refine vector similarity searches. An online store managing a product catalogue with over 100,000 items in an AlloyDB table may need to search for certain items using structured information (like colour or size) and unstructured language descriptors (like “puffer jacket”). Standard queries look like this:
Selected items: * WHERE text_embedding <-> Color=maroon, text-embedding-005, puff jacket, google_ml.embedding LIMIT 100
In the second section, the vector-indexed text_embedding column is vector searched, while the B-tree-indexed colour column is treated to the structured filter color='maroon'.
This query's efficiency depends on the database's vector search and SQL filter sequence. The AlloyDB query planner optimises this ordering based on workload. The filter's selectivity heavily influences this decision. Selectivity measures how often a criterion appears in the dataset.
Optimising with Pre-, Post-, and Inline Filters
AlloyDB's query planner intelligently chooses techniques using filter selectivity:
High Selectivity: The planner often employs a pre-filter when a filter is exceedingly selective, such as 0.2% of items being "maroon." Only a small part of data meets the criterion. After applying the filter (e.g., WHERE color='maroon'), the computationally intensive vector search begins. Using a B-tree index, this shrinks the candidate set from 100,000 to 200 products. Only this smaller set is vector searched (also known as a K-Nearest Neighbours or KNN search), assuring 100% recall in the filtered results.
Low Selectivity: A pre-filter that doesn't narrow the search field (e.g., 90% of products are “blue”) is unsuccessful. Planners use post-filter methods in these cases. First, an Approximate Nearest Neighbours (ANN) vector search using indexes like ScaNN quickly identifies the top 100 candidates based on vector similarity. After retrieving candidates, the filter condition (e.g., WHERE color='blue') is applied. This strategy works effectively for filters with low selectivity because many initial candidates fit the criteria.
Medium Selectivity: AlloyDB provides inline filtering (in-filtering) for filters with medium selectivity (0.5–10%, like “purple”). This method uses vector search and filter criteria. A bitmap from a B-tree index helps AlloyDB find approximate neighbours and candidates that match the filter in one run. Pre-filtering narrows the search field, but post-filtering on a highly selective filter does not produce too few results.
Learn at query time with adaptive filtering
Complex real-world workloads and filter selectivities can change over time, causing the query planner to make inappropriate selectivity decisions based on outdated facts. Poor execution tactics and results may result.
AlloyDB ScaNN solves this using adaptive filtration. This latest update lets AlloyDB use real-time information to determine filter selectivity. This real-time data allows the database to change its execution schedule for better filter and vector search ranking. Adaptive filtering reduces planner miscalculations.
Get Started
These innovations, driven by an intelligent database engine, aim to provide outstanding search results as data evolves.
In preview, adaptive filtering is available. With AlloyDB's ScaNN index, vector search may begin immediately. New Google Cloud users get $300 in free credits and a 30-day AlloyDB trial.
#AdaptiveFiltering#AlloyDBAI#AlloyDBScaNNindex#vectorsearch#AlloyDBAIVectorSearch#AlloyDBqueryplanner#technology#technews#technologynews#news#govindhtech
0 notes
Text
Master SQL in 2025: The Only Bootcamp You’ll Ever Need

When it comes to data, one thing is clear—SQL is still king. From business intelligence to data analysis, web development to mobile apps, Structured Query Language (SQL) is everywhere. It’s the language behind the databases that run apps, websites, and software platforms across the world.
If you’re looking to gain practical skills and build a future-proof career in data, there’s one course that stands above the rest: the 2025 Complete SQL Bootcamp from Zero to Hero in SQL.
Let’s dive into what makes this bootcamp a must for learners at every level.
Why SQL Still Matters in 2025
In an era filled with cutting-edge tools and no-code platforms, SQL remains an essential skill for:
Data Analysts
Backend Developers
Business Intelligence Specialists
Data Scientists
Digital Marketers
Product Managers
Software Engineers
Why? Because SQL is the universal language for interacting with relational databases. Whether you're working with MySQL, PostgreSQL, SQLite, or Microsoft SQL Server, learning SQL opens the door to querying, analyzing, and interpreting data that powers decision-making.
And let’s not forget—it’s one of the highest-paying skills on the job market today.
Who Is This Bootcamp For?
Whether you’re a complete beginner or someone looking to polish your skills, the 2025 Complete SQL Bootcamp from Zero to Hero in SQL is structured to take you through a progressive learning journey. You’ll go from knowing nothing about databases to confidently querying real-world datasets.
This course is perfect for:
✅ Beginners with no prior programming experience ✅ Students preparing for tech interviews ✅ Professionals shifting to data roles ✅ Freelancers and entrepreneurs ✅ Anyone who wants to work with data more effectively
What You’ll Learn: A Roadmap to SQL Mastery
Let’s take a look at some of the key skills and topics covered in this course:
🔹 SQL Fundamentals
What is SQL and why it's important
Understanding databases and tables
Creating and managing database structures
Writing basic SELECT statements
🔹 Filtering & Sorting Data
Using WHERE clauses
Logical operators (AND, OR, NOT)
ORDER BY and LIMIT for controlling output
🔹 Aggregation and Grouping
COUNT, SUM, AVG, MIN, MAX
GROUP BY and HAVING
Combining aggregate functions with filters
🔹 Advanced SQL Techniques
JOINS: INNER, LEFT, RIGHT, FULL
Subqueries and nested SELECTs
Set operations (UNION, INTERSECT)
Case statements and conditional logic
🔹 Data Cleaning and Manipulation
UPDATE, DELETE, and INSERT statements
Handling NULL values
Using built-in functions for data formatting
🔹 Real-World Projects
Practical datasets to work on
Simulated business cases
Query optimization techniques
Hands-On Learning With Real Impact
Many online courses deliver knowledge. Few deliver results.
The 2025 Complete SQL Bootcamp from Zero to Hero in SQL does both. The course is filled with hands-on exercises, quizzes, and real-world projects so you actually apply what you learn. You’ll use modern tools like PostgreSQL and pgAdmin to get your hands dirty with real data.
Why This Course Stands Out
There’s no shortage of SQL tutorials out there. But this bootcamp stands out for a few big reasons:
✅ Beginner-Friendly Structure
No coding experience? No problem. The course takes a gentle approach to build your confidence with simple, clear instructions.
✅ Practice-Driven Learning
Learning by doing is at the heart of this course. You’ll write real queries, not just watch someone else do it.
✅ Lifetime Access
Revisit modules anytime you want. Perfect for refreshing your memory before an interview or brushing up on a specific concept.
✅ Constant Updates
SQL evolves. This bootcamp evolves with it—keeping you in sync with current industry standards in 2025.
✅ Community and Support
You won’t be learning alone. With a thriving student community and Q&A forums, support is just a click away.
Career Opportunities After Learning SQL
Mastering SQL can open the door to a wide range of job opportunities. Here are just a few roles you’ll be prepared for:
Data Analyst: Analyze business data and generate insights
Database Administrator: Manage and optimize data infrastructure
Business Intelligence Developer: Build dashboards and reports
Full Stack Developer: Integrate SQL with web and app projects
Digital Marketer: Track user behavior and campaign performance
In fact, companies like Amazon, Google, Netflix, and Facebook all require SQL proficiency in many of their job roles.
And yes—freelancers and solopreneurs can use SQL to analyze marketing campaigns, customer feedback, sales funnels, and more.
Real Testimonials From Learners
Here’s what past students are saying about this bootcamp:
⭐⭐⭐⭐⭐ “I had no experience with SQL before taking this course. Now I’m using it daily at my new job as a data analyst. Worth every minute!” – Sarah L.
⭐⭐⭐⭐⭐ “This course is structured so well. It’s fun, clear, and packed with challenges. I even built my own analytics dashboard!” – Jason D.
⭐⭐⭐⭐⭐ “The best SQL course I’ve found on the internet—and I’ve tried a few. I was up and running with real queries in just a few hours.” – Meera P.
How to Get Started
You don’t need to enroll in a university or pay thousands for a bootcamp. You can get started today with the 2025 Complete SQL Bootcamp from Zero to Hero in SQL and build real skills that make you employable.
Just grab a laptop, follow the course roadmap, and dive into your first database. No fluff. Just real, useful skills.
Tips to Succeed in the SQL Bootcamp
Want to get the most out of your SQL journey? Keep these pro tips in mind:
Practice regularly: SQL is a muscle—use it or lose it.
Do the projects: Apply what you learn to real datasets.
Take notes: Summarize concepts in your own words.
Explore further: Try joining Kaggle or GitHub to explore open datasets.
Ask questions: Engage in course forums or communities for deeper understanding.
Your Future in Data Starts Now
SQL is more than just a skill. It’s a career-launching power tool. With this knowledge, you can transition into tech, level up in your current role, or even start your freelance data business.
And it all begins with one powerful course: 👉 2025 Complete SQL Bootcamp from Zero to Hero in SQL
So, what are you waiting for?
Open the door to endless opportunities and unlock the world of data.
0 notes
Text

Intuitive Powerful Visual Web Scraper - WebHarvy can automatically scrape Text, Images, URLs & Emails from websites, and save the scraped content in various formats. WebHarvy Web Scraper can be used to scrape data from www.yellowpages.com. Data fields such as name, address, phone number, website URL etc can be selected for extraction by just clicking on them! - Point and Click Interface WebHarvy is a visual web scraper. There is absolutely no need to write any scripts or code to scrape data. You will be using WebHarvy's in-built browser to navigate web pages. You can select the data to be scraped with mouse clicks. It is that easy ! - Scrape Data Patterns Automatic Pattern Detection WebHarvy automatically identifies patterns of data occurring in web pages. So if you need to scrape a list of items (name, address, email, price etc) from a web page, you need not do any additional configuration. If data repeats, WebHarvy will scrape it automatically. - Export scraped data Save to File or Database You can save the data extracted from web pages in a variety of formats. The current version of WebHarvy Web Scraper allows you to export the scraped data as an XML, CSV, JSON or TSV file. You can also export the scraped data to an SQL database. - Scrape data from multiple pages Scrape from Multiple Pages Often web pages display data such as product listings in multiple pages. WebHarvy can automatically crawl and extract data from multiple pages. Just point out the 'link to the next page' and WebHarvy Web Scraper will automatically scrape data from all pages. - Keyword based Scraping Keyword based Scraping Keyword based scraping allows you to capture data from search results pages for a list of input keywords. The configuration which you create will be automatically repeated for all given input keywords while mining data. Any number of input keywords can be specified. - Scrape via proxy server Proxy Servers To scrape anonymously and to prevent the web scraping software from being blocked by web servers, you have the option to access target websites via proxy servers. Either a single proxy server address or a list of proxy server addresses may be used. - Category Scraping Category Scraping WebHarvy Web Scraper allows you to scrape data from a list of links which leads to similar pages within a website. This allows you to scrape categories or subsections within websites using a single configuration. - Regular Expressions WebHarvy allows you to apply Regular Expressions (RegEx) on Text or HTML source of web pages and scrape the matching portion. This powerful technique offers you more flexibility while scraping data. - WebHarvy Support Technical Support Once you purchase WebHarvy Web Scraper you will receive free updates and free support from us for a period of 1 year from the date of purchase. Bug fixes are free for lifetime. WebHarvy 7.7.0238 Released on May 19, 2025 - Updated Browser WebHarvy’s internal browser has been upgraded to the latest available version of Chromium. This improves website compatibility and enhances the ability to bypass anti-scraping measures such as CAPTCHAs and Cloudflare protection. - Improved ‘Follow this link’ functionality Previously, the ‘Follow this link’ option could be disabled during configuration, requiring manual steps like capturing HTML, capturing more content, and applying a regular expression to enable it. This process is now handled automatically behind the scenes, making configuration much simpler for most websites. - Solved Excel File Export Issues We have resolved issues where exporting scraped data to an Excel file could result in a corrupted output on certain system environments. - Fixed Issue related to changing pagination type while editing configuration Previously, when selecting a different pagination method during configuration, both the old and new methods could get saved together in some cases. This issue has now been fixed. - General Security Updates All internal libraries have been updated to their latest versions to ensure improved security and stability. Sales Page:https://www.webharvy.com/ DOWNLOAD LINKS & INSTRUCTIONS: Sorry, You need to be logged in to see the content. Please Login or Register as VIP MEMBERS to access. Read the full article
0 notes