#Set Chart Axis Properties
Explore tagged Tumblr posts
Visit Tumblr Blog
Explore Tumblr blogs with no restrictions, modern design and the best experience.
Last Seen Tumblr Blogs


Fun Fact
There were a total of 171.5 billion posts on Tumblr in 2019.
Note
drop the choso axis coward
v1, i had dreams of a circular chart to emphasize choso but it was too illegible so the three corners are naoya, choso and todo

not restricted to eldest siblings but tilts that way heavily ofc, like naoya is younger but operates on a meritocracy, i include sets of HBO siblings and the zenin twins, etc
siblicide (cain): killed or attempted to kill sibling but either feels bad or faces crazy karma for it
siblicide (absalom): killed sibling but they don't feel bad about it, only incidentally because sibling sucked
the x-region between "uses for own ends" and "deep guilt" is the weirdest because of two old men i know shhhhhh shhh
i believe the included properties here are AoT, jjk, naruto, asoiaf, hotd, succession and the godfather part II and no i didn't think of the bear for some reason but mikey is up there between maki and marcel imo
this can grow exponentially and the x-axis needs refining but this is where i land with my zekeblogging, my eldest daughter blogging
4 notes
·
View notes
Text
Everyone’s ignoring these investors’ warnings on climate risk. You shouldn’t. (Washington Post)
Excerpt from this story from the Washington Post:
Three years ago, Owen Woolcock was on Zoom trying to convince a real estate investor to swap some of his buildings in the New York City area for properties incities around the Great Lakes.
Climate change was overturning assumptions about what makes a profitable housing investment, argued Woolcock, an Australian who had recently launched an investment firm called Climate Core Capital. Desirable locations from Austin to Miami were set to become expensive, riskier bets. Overlooked locales, he argued, would begin to draw money and people as they avoided the worst of the 21st century’s volatile climate.
The Wall Street veteran on the other end of the call managed tens of millions of dollars in real estate for a wealthy family, Woolcock recalled. Although he said he agreed with Woolcock’s forecast, he couldn’t sign on.
“The problem is,” Woolcock remembered him saying, “I have spent the last seven years going to my investment committee and telling them to invest in the Sun Belt, so my personal track record is tied to the opposite of what you guys are saying.”
In the past decade, hundreds of thousands of people have moved to places threatened by climate change, bidding up real estate from flood-prone coastlines to the fire-scarred Southwest. But a small group of investors — including Woolcock and his partner Rajeev Ranade, along with iconoclasts like David Burt of DeltaTerra Capital — are pushing in the opposite direction.
Their argument: As Americans wake up to the threat of climate change, the value of homes in risky markets will begin to slide. That’s created opportunities to profit by betting against housing markets exposed to weather catastrophes or investing in places that will attract people who want to avoid the worst.
For anyone expecting to buy or sell a homein the United States in the coming years,their insights may help you decide where to go next.
Five years ago, Woolcockbegan analyzing a dataset charting climate risk and population growth in large American cities over the next 30 years. The fastest population growth, he saw, overlapped with the riskiest areas from Austin to Phoenix.
“These were places where everyone was making a lot of money very quickly,” he told me. “It was immediately apparent it was a ticking time bomb.”
So Woolcock set out to convince investors to do the opposite, co-founding Climate Core Capital with Ranade in 2021. They’re promoting a thesis that might be calledthe “big long”: redirect money into growing, climate-resilient cities.
I was sitting in a conference room in their co-working space in Boston this summer as the two gave the pitch they normally delivered to investors. The market hasn’t yet learned to properly price climate risk — or resilience. Investors could earn more, and risk less, by investing in better buildings in safer cities. A chart displayed on the wall showed a point representing Naples, Florida, a bull’s eye for rising seas and hurricanes. It barely fit on the chart’s risk axis. On the opposite side was what they see as a low-risk climate haven prepared for a volatile century: Ann Arbor, Michigan.
2 notes
·
View notes
Note
was there any consensus about mercury magic?
-- wizorb 🔮
Well, most agree that it's the state of matter, not the elemental composition that actually denotes the category of magic. Therefore, mercury magic would be classed as aquemancy at room temperature, but that would change depending on if it was cold enough to solidify. Some scholars continue to (very heatedly) argue that its more metallic properties (like high conductivity) still class it as metallomancy, but for the average Joe Shmoe, what matters is that it's liquid.
If you wanna get into some more of the technical details of it...
In this setting, magic is performed by taking ambient mana and causing it to take on an "alignment." "Alignment," in this case, referring to some physical object or phenomenon in your environment. Additionally, ambient mana is everywhere, all the time, flowing through everything.
So, if you're sitting in a room with a glass of water, the mana passing through the water at that moment is water-aligned, and if you can reach out to that mana and use it to move the water, that makes you an aquemancer.
Theoretically, you could be a "mancer" of anything. In the first place, this category system (used by the magicians of the Central Basin) is actually kind of outdated! It takes a retroactive approaching to categorizing magic—looking at what people can do then trying to create categories around that.
If you want better idea of what people can potentially do with magic, you'll want to look at the system used by the peoples of the Black Ridge. They use a system more akin to those political alignment charts, where you plot two axes and then see where whatever you're measuring falls.
The most basic of these charts has an axis for "cold/solid" <- -> "hot/liquid", and one for "pure element" <- -> "complex compound," so mercury would fall squarely on the far end of "pure element" + "liquid."
There, problem solved!
Of course, these charts can get a lot more complex, and some people even take the time to assign numerical values to each axis and try and calculate out where exactly any given kind of mancy falls.
The benefit is that when looking at it as a field of possibility, rather than just observed reality, you can spot potential in places people simply haven't tried before. What would "hot" + "complex compound" magic look like? Lava, perhaps? The possibilities are limitless!
There have been sporadic attempts to bring the system over to the Central Basin magicians' guilds, but due to a mix of stubborn tradition, pre-existing structures built around the old system, and a lack of translations into Plains Tongue, it has yet to see widespread adoption. The farmhand who picked up a bit of water magic to help with cleaning the stables doesn't care if water is technically the "warm" form of ice, it's all just aque.
#oc tag#oc lore#gershwe's project#fict got an ask#also omg baby's first ask?? thanks haha#i will take ANY and all opportunity to ramble about this story
4 notes
·
View notes
Text
Understanding the Grammar of Graphics in R
The Grammar of Graphics is a conceptual framework for data visualization that allows you to create a wide range of plots using a consistent set of principles. It forms the foundation of the ggplot2 package in R, enabling you to build complex and layered visualizations in a systematic way. Understanding this grammar will not only help you use ggplot2 effectively but also give you deeper insights into how data visualization works at a fundamental level.
1. The Concept of the Grammar of Graphics
The Grammar of Graphics, introduced by Leland Wilkinson in his 1999 book, is a theoretical approach to visualization that breaks down the process of creating a plot into a set of independent components. Each plot is constructed by layering these components, much like how a sentence in language is constructed using grammar.
Key Components:
Data: The dataset that contains the information you want to visualize.
Aesthetics (aes): The visual properties of the plot, such as position, color, size, and shape, which are mapped to variables in your data.
Geometries (geom): The type of visual element used to represent the data, such as points, lines, bars, or boxplots.
Scales: The mappings from data values to visual properties, such as how data values are translated into axis positions, colors, or sizes.
Facets: The division of data into subplots based on a categorical variable, allowing for the comparison of subsets of data.
Coordinates: The system that determines how data points are mapped onto the plot, such as Cartesian coordinates or polar coordinates.
Layers: The different components or elements added on top of each other to build the final plot.
2. Building a Plot Using the Grammar of Graphics
In ggplot2, each plot is constructed using layers, where each layer represents one or more of the components of the Grammar of Graphics. The process typically starts with defining the data and aesthetics, followed by adding geometries and other components.
Basic Plot Structure:
ggplot(data = dataset, aes(x = x_variable, y = y_variable)) + geom_point()
Data: The data argument specifies the dataset you want to use.
Aesthetics: The aes() function maps variables from the dataset to visual properties like the x and y axes.
Geometry: geom_point() adds a layer of points to the plot, creating a scatter plot.
3. Understanding Aesthetics (aes)
Aesthetics in ggplot2 refer to how data variables are mapped to visual properties. These mappings determine how your data is visually represented in the plot.
Common Aesthetics:
x and y: The variables mapped to the x and y axes.
color: The color of points, lines, or bars, which can be mapped to a categorical or continuous variable.
size: The size of points or lines, often mapped to a continuous variable.
shape: The shape of points in a scatter plot, typically used with categorical variables. Example:
ggplot(data = dataset, aes(x = x_variable, y = y_variable, color = category_variable)) + geom_point()
4. Working with Geometries (geom)
Geometries in ggplot2 define the type of plot you create, such as a scatter plot, line plot, bar chart, or histogram. Each geometry function corresponds to a different type of plot.
Common Geometries:
geom_point(): Creates a scatter plot.
geom_line(): Creates a line plot.
geom_bar(): Creates a bar chart.
geom_histogram(): Creates a histogram.
geom_boxplot(): Creates a boxplot.
Example:ggplot(data = dataset, aes(x = x_variable, y = y_variable)) + geom_line()
5. Understanding Scales and Coordinates
Scales in ggplot2 control how data values are mapped to visual properties, such as the position on the axes, colors, or sizes. Coordinates define the plotting area and how data points are placed within it.
Scales:
scale_x_continuous() and scale_y_continuous(): Adjust the continuous scales of the x and y axes.
scale_color_manual(): Customize color scales.
scale_size_continuous(): Customize the size scale.
Example:ggplot(data = dataset, aes(x = x_variable, y = y_variable, color = category_variable)) + geom_point() + scale_color_manual(values = c("red", "blue"))
Coordinates:
coord_cartesian(): Adjust the limits of the plot without affecting the data.
coord_flip(): Swap the x and y axes.
coord_polar(): Convert Cartesian coordinates to polar coordinates for circular plots.
Example:ggplot(data = dataset, aes(x = factor_variable, y = value_variable)) + geom_bar(stat = "identity") + coord_flip()
6. Faceting for Comparison
Faceting allows you to create multiple subplots based on the values of a categorical variable, enabling you to compare different subsets of data.
Faceting Functions:
facet_wrap(): Creates a series of plots wrapped into a grid.
facet_grid(): Creates a grid of plots based on the combination of two categorical variables.
Example:ggplot(data = dataset, aes(x = x_variable, y = y_variable)) + geom_point() + facet_wrap(~ category_variable)
7. Combining Layers to Build Complex Plots
One of the powerful aspects of the Grammar of Graphics is the ability to layer multiple geometries and aesthetics in a single plot. This allows you to create complex visualizations that convey more information.
Example of a Multi-Layer Plot:
ggplot(data = dataset, aes(x = x_variable, y = y_variable)) + geom_point() + geom_smooth(method = "lm", se = FALSE) + labs(title = "Scatter Plot with Linear Regression Line")
In this example, geom_point() adds the points to the plot, while geom_smooth() overlays a linear regression line.
The Grammar of Graphics provides a powerful framework for understanding and creating data visualizations in R using ggplot2. By breaking down the components of a plot into layers, aesthetics, geometries, scales, coordinates, and facets, you can systematically build complex and meaningful visual representations of your data. Mastering this grammar is essential for creating effective visualizations that can reveal insights and support data-driven decision-making.
Full coverage at Strategic leap
0 notes
Text
Visualizing Relationships: A Step-by-Step Guide to XY Scatter Charts in Excel
Data Visualization: Key Queries Explained
1.How do you create a XY scatter chart?
To create an XY scatter chart, first, select your data points (two numerical variables). In Excel, go to the "Insert" tab, click on "Scatter" in the Charts group, and choose the desired scatter chart style. Adjust the chart title, axis labels, and other formatting options as needed. Save your work to keep the chart.
2. How to change bubble size in scatter plot excel?
To change bubble size in a scatter plot in Excel, right-click on a bubble, select "Format Data Series," then go to the "Size & Properties" section. Adjust the "Bubble Size" settings by changing the scale or entering a specific value. You can also change the data series values that determine bubble sizes in your data table.
3. Is a line chart a scatter chart?
A line chart is not the same as a scatter chart, though they are related. A line chart connects individual data points with lines to show trends over time, while a scatter chart displays individual data points without connecting lines, highlighting relationships between two variables. Both visualize data but serve different purposes in analysis.
4. How to add labels in a bubble chart?
To add labels in a bubble chart, use charting software like Excel or Google Sheets. After creating the chart, click on the bubbles to select them, then choose the option to add data labels. You can customize the labels to display values, categories, or other information as needed. Adjust the label position for clarity if necessary.
5. What is the difference between a bubble chart and a scatter plot?
A scatter plot displays points representing two variables, showing their relationship. A bubble chart is similar but adds a third variable, represented by the size of the bubbles. This allows bubble charts to convey more information visually, as the size indicates another dimension of data alongside the x and y coordinates.

Visit: VS Website See: VS Portfolio
0 notes
Text
Brief 5: Pushing Boundaries, Student Competitions in Games Art and Design (Blueprints)
I decided to create the game solely in Unreal Engine using blueprints. It is a newer form of programming that involves a heavy use of nodes over the traditional programming codes.
I created a project in Unreal Engine and set a directory for my project. I also downloaded an animation pack for the locomotion of a character provided by a youtuber Gorka Games.

Figure 1 (Project creation, 2024)
I added the preset animation pack to the content browser and added SK_Mannequin as the skeleton when importing it.

Figure 2 (Binding skeleton to animation, 2024)
Since there were different poses for locomotion for the character, I decided to branch it into different poses. I added an animation 'Blend Space 1D' to content browser and merged idle animations in its property editor. I set the maximum axis velocity to 500 units.
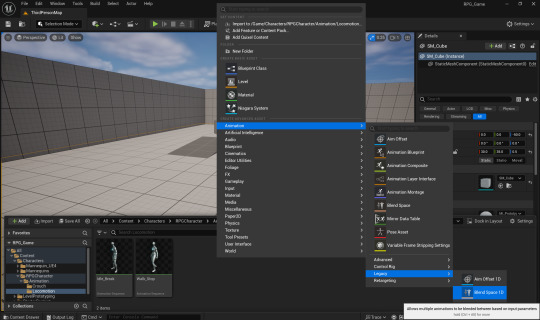
Figure 3 (Blend Space 1D, 2024)
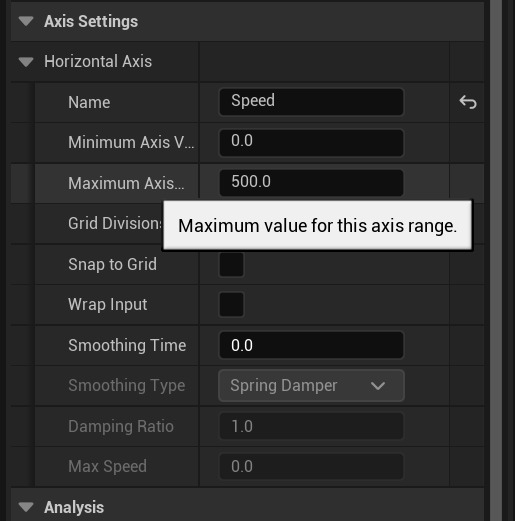
Figure 4 (Maximum axis speed, 2024)
Inside the blend graph editor, I added an idle, walk and run animation keyframe and blended it together.

Figure 5 (Keyframes for locomotion, 2024)
I created a blueprint class for my RPG character to add my locomotion states and added the animation packs to all the relevant pose output nodes required.

Figure 6 (Idle animation, 2024)
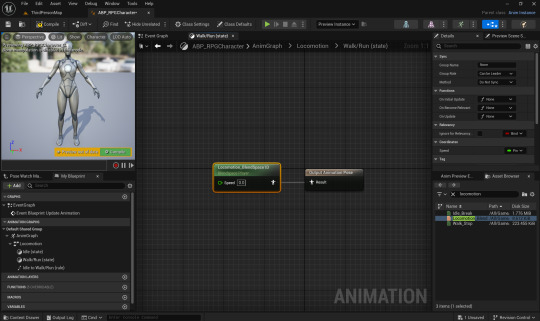
Figure 7 (Locomotion blend space animation, 2024)
I then set the properties of the transition from Idle to Walk/Run pose. I created a speed float variable and plugged it into a > logic node. If the speed is greater than 0 units, the character transitions from idle to walk/run pose. The output is plugged into the result.

Figure 8 (Transition from idle to walk/run pose, 2024)
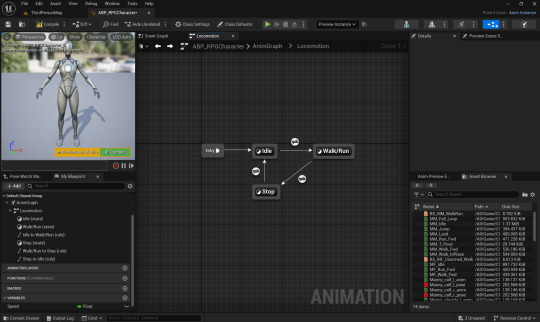
Figure 9 (Graph chart for locomotion, 2024)
I then assigned a cache for the locomotion node so that it can easily be referenced for further node setups without creating the entire thing from scratch.
0 notes
Text
HighCharts API And Looker Chart Config Editor Tips & tricks

Make your data story more comprehensive by using personalized Looker charts and visualizations with HighCharts API.
Looker Chart Config Editor Tips And tricks
A collection of numbers is all that data is unless it can be used to tell a story and obtain further information. Google Cloud is always working to enhance Looker’s features so you can work together with reliable metrics and share your data stories. It has added the capability to add bullet chart, sunburst, venn, and treemap visualizations to Looker Explores and dashboards by utilizing the Chart Config Editor to previously available Looker visualizations. It wanted to offer some best practices on how to use the Chart Config Editor to enrich your visualizations and make meaningful data experiences so that you can make the most of these new Looker visuals.
HighCharts API
For those who are unfamiliar with the Chart Config Editor, Looker visualizations show your data using the Highcharts interactive charting library. You may customize your visualizations by utilizing the editor, which exposes portions of the Highcharts library API. In order to enhance your visualizations, it will explore the Highcharts API and discover some useful Chart Config Editor tips and tricks in this post. You need have access to Chart Config Editor and be familiar with the JSON format in order to fully comprehend its examples in order to get the most out of this post.
HighCharts API reference
In a line chart, set the labels and look of each line
Consider a representation of a line chart that shows several time series, each represented by a single line. You might find it difficult to distinguish between the lines in the dashboard viewer, or you might want to highlight a certain line more than others. Highchart offers several `series} properties that you can use to modify how each line is presented and styled. Among the qualities are:
{dashStyle} to alter the pattern of each line
To alter the thickness of every line, use {lineWidth}.
{opacity} to alter the opacity of each line
Use dataLabels to add labels to the values or data on a line.
You can apply each {series} property in any combination to make the data in your line visualization easier for your stakeholders to grasp.
By setting the default styling across all lines using Highchart’s plotOptions attribute, you can further simplify the settings shown in the above sample. Afterwards, you may use the {series} element, which changes the default styling, to further modify individual lines. The following Chart Config Editor setting sample shows both the overriding and default styling:
Allowing visuals to scroll inline
Imagine a column chart visualization where each column represents a month and the date time x-axis spans several decades. The width of your dashboard limits the visualization you may use, so as time goes on, the widths of each column get smaller and the monthly or annual trends are compressed, making them difficult to grasp.
To enable horizontal scrolling for your stakeholders through a column or line-chart visualization, try defining the width of your visualization using Highchart’s chart.scrollablePlotArea} attribute. TheminWidthattribute allows you to establish the minimum width of your visualization, while thescrollPositionX` attribute allows you to specify the visualization’s starting scrolling position. The visualization’s minimum width of 2,000 pixels and its initial scrolling position to the right are established in the Chart Config Editor configuration sample below.
chart: { scrollablePlotArea: { minWidth: 2000, scrollPositionX: 1 } },
Try experimenting with the scrollPositionY} andminHeight` attributes as well to allow scrolling vertically in your visualizations.
Complete control over the data labels for additional chart visualizations, such as pie charts
You can name each pie slice using the plot menu options in a pie chart visualization, but usually you can just display the slice’s value or percentage. To fully comprehend all of the data, the observer must perform a double take, glancing between the legend and the data labels. Additionally, all of the data will not be accessible in a scheduled PDF delivery of the dashboard containing the visualization, even if users might mouseover each pie slice to view it.
To help your stakeholders quickly extract information from your charts, you can use the Chart Config Editor to display any information that is available on the HighCharts PointLabelObject on the data labels. This includes the percentage and value displayed simultaneously. You can also further customize the labels with HTML. To modify the format and style of a chart’s data labels, you must set up the previously stated Highchart {dataLabels} attribute from its first example. The following {dataLabels` attributes need to be configured:
{enabled}, as demonstrated in our first example, to enable data labels on the chart
To enable HTML styling of data labels, use useHTML.
To apply CSS styles to every data label, use {style}.
Use {format} to specify the piece and format.
The data labels of the pie chart are shown in the Chart Config Editor configuration sample below with a font size of 12 pixels. If the property name for the format} attribute is enclosed in curly braces, then all of the PointLabelObject's properties can be shown in the data label. The example assigns the following string to theformat` attribute}:
The pie slice name bolded with the key attribute of the PointLabelObject within an HTML Draw Focus On This Aspect
The value of the data point with the `y} property of the PointLabelObject
Specifies the percentage of the data point with one decimal place formatting using the PointLabelObject’s percentage property
The format of the final data label is as follows: Category: 11.5%, 596524.
Keep in mind that the tooltip.format} attribute and thedataLabels.format} attribute function similarly; the documentation has more information on this. Also take note that for pie charts, it need the plotOptions.pie.dataLabels} attribute. You must override theplotOptions.line.dataLabelsattribute if you wish to format a line chart with the same data-label style. The interface and functionality of many chart kinds are mostly shared via thedataLabels` element.
Make your charts more insightful and powerful
We hope that these illustrations will work as a springboard for you as you investigate the HighCharts API and discover how to set up your Looker visualizations to convey useful and compelling narratives. You now know how to enable inline scrolling of visualizations, edit data labels, and change the appearance of each series of your data using the Looker Chart Config Editor and HighCharts API.
Read more on govindhtech.com
#HighChartsAPI#LookerChartConfig#EditorTips#GoogleCloud#dashboard#Lookervisualizations#Makeyourcharts#chartvisualizations#datalabels#tricks#api#technology#technews#news#govindhtech
0 notes
Text
gemstones
gemstones cast
gemstones hbo
gemstone caverns
gemstones season 3
gemstones season 2
gemstone rings
gemstone names
gemstone engagement rings
gemstone gods
gemstone caverns mtg
gemstone meanings
gemstone jewelry
gemstone amory ms
gemstone appraisal
gemstone art
gemstone auctions
gemstone appraisal near me
gemstone apartments
gemstone august
gemstone amethyst
a gemstone mining game
a gemstone is an example of a
a gemstone is a mineral that has what properties
a gemstone for a girl crossword clue
a gemstone is a hard colorful mineral
a gemstone produced in volcanoes
a gemstone right at sea
a gemstone which repels the ketu influence
gemstone beads
gemstone bracelets
gemstone birthstone
gemstone beads wholesale
gemstone baby names
gemstone beads for jewelry making
gemstone buyers near me
gemstone band rings
b gemstones
b grade gemstones
samuel b gemstone bracelet
samuel b gemstone ring
b r gemstones
outward gemstone b
gemstone b l2
gemstone b где взять
gemstone cast
gemstone colors
gemstone cuts
gemstone climbing
gemstone chart
gemstone communities
c gemstone mm2
c gemstones
c gemstone m2
gemstone c axis
4 c's gemstones
c grade gemstone
c dunaigre gemstone report
r&c gemstone
gemstone dice
gemstone dragons
gemstone definition
gemstone dig kit
gemstone drawing
gemstone dragons dragonvale
gemstone dolphins
gemstone drill
d gemstones
d&d gemstone prices
d-men gemstone guide
d&d gemstone dragons
d&d gemstone generator
gemstone dnd dice
d&d gemstone table
d&d gemstone weight
gemstone earrings
gemstone excavation kit
gemstone earrings dangle
gemstone engagement rings etsy
gemstone eternity band
gemstone engagement ring sets
gemstone earrings studs
e gemstones
gemstone ebay
gemstone e color
e righteous gemstones
3709 e gemstone circle
3709 e gemstone cir
ebay gemstone jewellery
ebay gemstone rings
gemstone from the sea
gemstone from the sea crossword clue
gemstone for december
gemstone factory
gemstone for june
gemstone for october
gemstone for november
gemstone for august
f gemstones
gemstone globe
gemstone gymnastics
gemstone golem fragments
gemstone gauntlet
gemstone green contacts
gemstone girl names
gemstone guide
g gemstone bracelet
gemstone g string
p g gemstone inc
g f williams gemstones
eva g gemstone
gemstone hbo
gemstone hardness scale
gemstone hypixel skyblock
gemstone healing properties
gemstone homes
gemstone hunting near me
gemstone hoop earrings
gemstone heat therapy mat
h gemstone necklace
gemstone h ranch
gemstone h arena
h stern gemstones
h samuel gemstone rings
h stern gemstone rings
march gemstone
h.pearls.gemstones
gemstone identification
gemstone identifier
gemstone iv
gemstone identification chart
gemstone international group
gemstone identification app
gemstone in spanish
gemstone iv wiki
i gemstone jewelry
gemstone i.d. lab inc
gemstones i hindi
gemstone i stock
i have gemstones to sell
i love gemstones
r.i. gemstones
i sell gemstones
gemstone jewelry near me
gemstone jewelers
gemstone january
gemstone june
gemstone jewelry making kit
gemstone july
gemstone jasper
j gemstones
em j gemstones
j crew gemstone sweater
j crew gemstone necklace
jtv gemstones
j frank golden gemstones
j l white gemstones
gemstone king
gemstone kaseki
gemstone kit
gemstone king reviews
gemstone key elden ring
gemstone knife
gemstone king amazon
gemstone keychains
k gemstones
oh k gemstone mini masks
14k gemstone rings
kmart gemstones
milestone gemstone k. ltd nairobi
gems that start with a k
gemstone lights
gemstone list
gemstone league of legends
gemstone legends
gemstone lights cost
gemstone lamp
gemstone lights price
gemstone llc
l gemstones
l gemstone pendant
l'oreal tourmaline gemstone
l g webb gemstones
blue gemstone l
labradorite gemstones l
gemstone mm2
gemstone mining
gemstone months
gemstone mining near me
gemstone mixture
gemstone movie
gemstone mm2 value
gemstone m 2
a&m gemstone craft
m jade&gemstone
m p jewellers gemstones prices
m/v ocean gemstone
m-stone white gemstone
gemstone necklaces
gemstone names for girls
gemstone names for boys
gemstone nails
gemstone near me
gemstone november
gemstone name generator
gemstones in silver
traps n gemstones apk
traps n gemstones
traps n gemstones secret chambers
traps n gemstones walkthrough
7465 n gemstone rd
6460 n gemstone rd
traps n gemstones complete map
gemstone of mexico
gemstone october
gemstone ornaments
gemstone of the sea
gemstone opal
gemstone outline
gemstone orchids
gemstone of new mexico
o gemstones
gemstone o rings
o'neills gemstones
gemstones o que significa
gemstone o que e
o que significa gemstone
gemstone o que são
gemstones o que é
gemstone potatoes
gemstone pendant
gemstone properties
gemstone prices
gemstone palace
gemstone powder
gemstone property management
gemstone prices 2021
p gemstones
p c chandra gemstone
double p gemstone
gemstone quality
gemstone quiz
gemstone quotes
gemstone quilt pattern
gemstone quartz
gemstone quilt
gemstone quality chart
gemstone quality aaaa
gemstone q
gemstone q significa
q significa gemstone en ingles
gemstone rings for women
gemstone rocks
gemstone rings for men
gemstone righteous
gemstone rings near me
gemstone rarity chart
gemstone rework league
r gemstones
gemstone r and co
gemstone r grade lineage 2
r+co gemstone color shampoo
r+co gemstone color conditioner
r+co gemstone color shampoo + conditioner
r+co gemstone color shampoo review
r+co gemstone color shampoo & conditioner liters
gemstone show
gemstone store near me
gemstone shapes
gemstone season 3
gemstone store
gemstone stud earrings
gemstone shops near me
gemstone series
s gemstones
s gemstones wheel of fortune
s gemstone drive
s gemstone где взять
gemstone s lineage 2
gemstone/as database
5940 s gemstone dr
5961 s gemstone dr
gemstone trader ffxiv
gemstone tarot
gemstone tree
gemstone tester
gemstone tv show
gemstone types
gemstone tattoos
gemstone trader endwalker
t gemstones
gemstone t shirt
gemstone t strap sandals
gemstone t-strap sandals (wide width)
gemstone t shirts for sale
gemstone t shirt designs
t. jazelle gemstone
stussy gemstone t shirt
gemstone umd
gemstone universe
gemstone uses
gemstone ultra shine glossing treatment
gemstone uses botw
gemstone update league of legends
gemstone usa
gemstone utah
gemstone u.k
u.s. national gemstone
gemstone voucher ffxiv
gemstone value mm2
gemstone value
gemstone vs crystal
gemstone value chart
gemstone vendors ffxiv
gemstone vineyard
gemstone value calculator
gemstone or crystal
gemstone v neck
smt v gemstones
gta v gemstones
gemstone wedding rings
gemstone wholesale
gemstone wholesale suppliers
gemstone water bottle
gemstone winery
gemstone wedding bands
gemstone weight calculator
gemstone wallpaper
w gemstone sdn bhd
big w gemstones
2812 w gemstone meridian id
13519 w gemstone dr
ring with gemstones
w scott forrest gemstones
vermeil earring with/ gemstone sapphire
vermeil necklace with/ gemstone sapphire
gemstone xmas lights
gemstone x ray
gemstone xray skyblock
gemstone crossword
gemstone xmas
xanthite gemstone
xenotime gemstone
ragnarok x gemstone
ragnarok x gemstone uses
what is x stone
gemstone yorkies
gemstone yarn
gemstone yellow
gemstone youtube
gemstone years
gemstone yellow color
gemstone yoni
gemstone yountville
gemstone y necklace
y are gemstones important
gemstone zodiac
gemstone zircon
gemstone zodiac chart
gemstone zultanite
gemstone zodiac necklace
gemstone zirconia
gemstone zentangle
gemstone zircon safety glasses
a-z gemstones meanings
what is z stone
gemstone 007
00g gemstone plugs
0g gemstone
gemstone ibt 0 75 l
sigg gemstone 0 75
sigg gemstone 0.5
gemstone in 0.5l
sigg gemstone 0.5l
sigg gemstone 0 5
gemstone 1613-uvo
gemstone 1014-vo
gemstone 101
gemstone 1812-vo
gemstone 1410-vo
gemstone 1512-v
gemstone 16x
gemstone 10mg
1 gemstone way oakhurst
1 gemstone ring
$1 gemstone
$1 gemstone beads
1 carat gemstone
witcher 1 gemstone
type 1 gemstones
1 carat gemstone size
gemstone 2022
gemstone 2 cast
gemstone 2015-es
gemstone 2018 cabernet sauvignon
gemstone 2012 estate red wine
gemstone 2016 cabernet
gemstone 2009 estate red wine
gemstone 2010 estate red wine
2 gemstone ring
2 gemstone necklace
2 gemstone boulevard carine
2 gemstone blvd carine
2 gemstone boulevard carine wa 6020
2 gemstones found in pakistan
2 gemstone boulevard carine wa
2 gemstones found in metamorphic rocks
gemstone 302
gemstone 301
gemstone 3d model
gemstone 32x
gemstone 3d scanner
gemstone 302 trial
gemstone 3 mud
gemstone 3 game
3 gemstone ring
3 gemstone necklace
3 gemstone boulevard carine
3 gemstone court warragul
3 gemstone drive upper hutt
3 gemstone lane brampton
3 gemstone lane
3 gemstone earrings
gemstone 4 wiki
gemstone 4 armor
gemstone 4 herbs
gemstone 4 maps
gemstone 4 lich
gemstone 4 creatures by level
gemstone 4 hess
gemstone 4 330
4 gemstone ring
4 gemstone keys outward
4 gemstones
4 gemstone necklace
4 gemstone court warragul
4 gemstone court mount gambier
gemstone 4 letters
gemstone 5 letters
gemstone 5e
gemstone 5 letters beginning with b
gemstone 50
gemstone 5mm cabochon
gemstone 5mm
gemstone 5p
5mm gemstone actual size
5 gemstones
5 gemstone ring
5 gemstones marvel
5 gemstone lane
5 gemstone lane brampton on
5 gemstone way oakhurst
5 gemstone necklace
5 gemstone bracelet
gemstone 60th birthday
gemstone 6 letters
gemstone 6 sided dice
gemstone 6mm
gemstone 6mm engagement ring
6mm gemstone beads
6 gemstone boulevard carine
6350 gemstone place mechanicsville va
6 gemstones
6 gemstones marvel
6 gemstones in a necklace
6 gemstones in a necklace permutation
6 gemstone road winter valley
6 gemstone ring
6 gemstones of earth
gemstone 7 letters
7 gemstone chakra
7 gemstone names
7 gemstone ring
7 gemstone drive collinsville ct
7 gemstone blvd
gemstone 7 chakra bracelet
gemstone 7 chakra necklace
gemstone 8 letters
gemstone 8 point scrabble
gemstone 8mm beads
8mm gemstone size
8mm gemstone beads wholesale
88 gemstone lane acworth ga
8mm gemstone
810 gemstone bullhead city az
8 gemstones
8 gemstone way oakhurst
8 gemstone globe
8 gemstone park
gemstones 8 letters
gemstones 8 hardness
march 8 gemstone
gemstone 9 letters
gemstone 925 silver earrings
gemstone 925 bracelet
gemstones 94
gemstone 9 letters crossword clue
gemstone 925 silver ring
gemstone 9 inch globe
gemstone 9ct bracelet
9 gemstones
9 gemstone ring
9 gemstones in tamil
9 gemstones names
9 gemstones names in hindi
9 gemstones names in telugu
9 gemstones in court warragul
Gemstone names
Gemstones prices
Gemstone names and colors
Gemstones list with pictures and meanings
Natural gemstones
Pearl
Organic gemstones
Tanzanite
Underrated gemstones
Image of Gemstone chart
Gemstone chart
Gemstones for sale
Show me gemstones
Gemstone jewelry
Gemstone MM2
Gemstone rings
Rare gemstones
Precious gemstones
Gemstone for sale near northwest
Gemstone for sale near bamenda
Gemstones prices
Raw gemstones for sale
Natural gemstones for sale near me
Buy certified gemstones online
Gemstones and crystals
Best place to buy gemstones online
Gemstones for sale wholesale
Gemstones names
Best place to buy loose gemstones online
Gemstones for sale Australia
Natural gemstones list
Natural Loose Gemstones
Precious gemstones
Where to buy real gemstones online
Best place to buy gemstones online
Natural gemstones UK
Loose gemstone Auctions UK
Semi precious stones list
Real gemstones vs fake
Gemstones prices
Gemstone wholesale price list
Gemstone mining near douala
Gemstone mining near bamenda
Gem mines open to the public near me
Free public mining near me
Gem mining in Florida
Rock mining near me
Gem mining in Georgia
Where to find gemstones near me
Gem mining in Virginia
Fee mining near me
Gem Mining in Texas
Where to go crystal hunting near me
Amethyst mines near me
Gem mining in PA
Public mining near me
Where can I dig for gems in PA
Fee mining near me
Amethyst mines near me
Real gem mining in Tennessee
Gemstone mining
Free gem mining California
Fee mining near me
Amethyst mines near me
Real gem mining in Tennessee
Gemstone names
Gemstones prices
Gemstone names and colors
Gemstones list with pictures and meanings
Natural gemstones
Pearl
Organic gemstones
Tanzanite
Underrated gemstones
Image of Gemstone chart
Gemstone chart
Gemstones for sale
Show me gemstones
Gemstone jewelry
Gemstone MM2
Gemstone rings
Rare gemstones
Precious gemstones
Gemstone for sale near northwest
Gemstone for sale near bamenda
Gemstones prices
Raw gemstones for sale
Natural gemstones for sale near me
Buy certified gemstones online
Gemstones and crystals
Best place to buy gemstones online
Gemstones for sale wholesale
Gemstones names
Best place to buy loose gemstones online
Gemstones for sale Australia
Natural gemstones list
Natural Loose Gemstones
Precious gemstones
Where to buy real gemstones online
Best place to buy gemstones online
Natural gemstones UK
Loose gemstone Auctions UK
Semi precious stones list
Real gemstones vs fake
Gemstones prices
Gemstone wholesale price list
Gemstone mining near douala
Gemstone mining near bamenda
Gem mines open to the public near me
Free public mining near me
Gem mining in Florida
Rock mining near me
Gem mining in Georgia
Where to find gemstones near me
Gem mining in Virginia
Fee mining near me
Gem Mining in Texas
Where to go crystal hunting near me
Amethyst mines near me
Gem mining in PA
Public mining near me
Free public mining near me
Where can I dig for gems in PA
Fee mining near me
Amethyst mines near me
Real gem mining in Tennessee
Gemstone mining
Public mining near me
Free public mining near me
Where can I dig for gems in PA
Fee mining near me
Amethyst mines near me
Real gem mining in Tennessee
Gemstone mining
Free gem mining California
Where can I find gemstones in nature?
Where can I find crystals in my yard?
How do you find gems in creeks?
Where can I collect gemstones?
Peridot for sale near northwest
Raw Peridot for sale
Real Peridot stone price
High quality peridot stones
Raw Peridot stone
Peridot meaning
Peridot Crystal
Peridot sale
Peridot stone benefits
Raw Peridot Necklace
Natural Untreated Huge Aquamarine
66.30 carat
1 piece
$5 per carat only
#gemstone #gemstones #gemstonejewelry #gemstonejewellery #gemston #gemstonebracelet #gemstoneearrings #gemstonering #gemstoneindonesia #gemstonejewelryforsale #gemstonejewelrymadewithlove #gemstonejewelleryforsale #gemstonejewels #rubystonejewellery #rubystonering #rubystonenecklace #rubystones #rubystonered #rubystone #rubystoneproductions #rubystar #rubystartraders #rubystarsocietyfabric #rubystarsociety #RUBYST #amethyste #amethyststone #emeraldtradecenter #diamondforsale #SAPPHIRESTAR #diamondsareagirlsbestfriend #diamondearrings #diamondsareforever #diamondplatnumz #diamondjewelry #ironore #ironoremine #ironoremining #diamondmining #diamondmind #diamondminis #diamondmines #diamondminersassociation #diamondminecart #gemstonemining #exploresingapore #exploretheworld #exploremore #explore #exploreeverything #explorepage✨ #büyükbeden #buynowpaylater #buyselltrade #trader #trade #tradegold #goldsale #goldsaleph #amethystcluster #amethystcrystal #amethystjewelry #amethysts #amethyst #amethyststone #amethist #amethystnecklace #emeralds #emeraldlake #emeraldislenc #emeraldcutdiamond #emeraldisle #buynow #büyükbeden #buylessbuybetter #buylocal #buyblack #buyersagent #buy #selling #sellersmarket #sell #goldjewelry #goldcoast #gold #goldbuyers #goldbuyer #goldbuying #goldbuy #goldbuyingcompany #goldbuyer #goldbuyers #goldbuying #goldbuy #goldbuyersdallas #goldukraine #golduk #golddrip #diamondukraine #diamonduk #diamondbuyers #diamondbuyer #emeraldbuyers #emeraldbuyer #emeraldforsale #sapphiresale #rubysale #diamondearrings #diamond #metal #metalcore #ironoremining #ironore #mining #miningindustry #miningengineering #extractions #buyersagent #buy #buyselltradesurfboards #buylocal #buy #buynow #buylessbuybetter #forextraders #daytraders #tradersclub #gold #goldsellers #goldsellerph #GoldSeller #goldseller #goldforsale #goldforsaleph #goldforsalephilippines #goldmining #goldminers #goldminer #goldmineandcoco #goldmine #turkishgold #germanytourism #malaysia #investinyourfuture #investimentos #investimento #sapphiresale #sapphires #sapphireonline #diamondtrader #topaz #topazlabs #topazjewelry #topazring #topazforsale #topazdetailing #sapphireengagementring #sapphirejewelry #sapphirering #ruby #rubyforsale #diamondtrade #diamondtrading #diamondtrader #minerals #mineralcollection #mineral #mineralwater #miners #mineralcollecting #mineralogy #gemstones #gemston #gemstone #gemstonelover #gemstoneearrings #gemstoneindonesia #gemstoneforsale #amethystcrystal #amethystcrystal #CrystalShop #crystalsg #crystals #crystalwholesale #crystalcollection #crystallove #cryptoinvestor #cryptocurrency #crystal #crystalclear #meth #methaddict #diamondjewelry #diamonds #diamondplatnumz #gemstonelover #gemstonejewellery #gemstones #gemstonejewelry #gemstone #buyingandselling #buying #goldtraders #goldtrader #goldtrading #goldtrade #blackmarket #blackmarketplace #sapphireforsale #methane #goldforsale #goldforinvestment #goldformingjewelry #goldforex #goldforever #goldfornecedores #goldforcash #goldforeverybody #diamondforsalemanila #diamondforsaleph #diamondforsale #emeraldcut #emeraldcoast #methsmoker #meth #methaddict #sapphireonline #sapphiresale #sapphirepk #rubyredshoes #RubyBridges #rubyribbon #ruby #gemstone #gemstones #gemston #gemstoneindonesia #gemstonelover #preciousstones #preciousgems #preciousstones #preciousjewellery #preciousgems #preciousmetals #precious #preciousgemstones #preciousgemstone #preciousgemsport #preciousgems💎 #preciousgemsakcchihuahuas #preciousgemswarrior #preciousgemsjewellery #gemsandminerals #gemstoneearrings #gemskinbeautyline #gemstones #gems #gemstoneshop #gemstonesforsale #gemstonesupplier #gemstonesale #gemstonesforjewelry #emeraldsale #emeraldsanddiamonds #sapphiresale #sapphiresanddiamonds #sapphiresa #goldsale #goldtrading #goldtradermalaysia #goldtrader #goldtraders #goldtradersingapore #goldtraderuk #goldtraderindia #goldgermany #goldgerupolish #gems #gemstone #gemokisawesome #gem #gemstones #gemstonejewelry #gemstonelover #gemstonerings #gemstonering #bead #beads #beadedjewelry #beading #beadjewelry
2 notes
·
View notes
Text
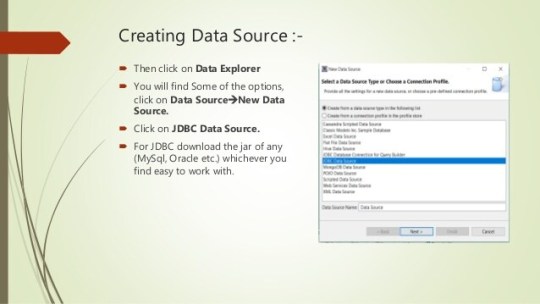
Birt Pojo Data Source

Eclipse Birt Pojo Data Source
Birt Report Pojo Data Source Example
Birt Pojo Data Source Example
Birt Pojo Data Source Examples
Use esProc with BIRT. Here is the SPL script. Your BIRT reports can have a query from two data sources no matter what kind of database and go on other computations that are not convenient on BIRT.
Using POJO DataSource in BIRT 4.3 To create a report in BIRT 4.3 we can use POJO dataSource. In 4.3 this DataSource is supported. To use this we need to create a dataset class.
BIRT is an open source engine to create data visualizations that can be integrated into Java web applications. It's a top-level software project within the Eclipse Foundation and leverages contributions by IBM and Innovent Solutions. It was started and sponsored by Actuate at the end of 2004.
Eclipse Birt Pojo Data Source
Primary tabs
. Data - Databases, web services, Java objects all can supply data to your BIRT report. BIRT provides JDBC, XML, Web Services, and Flat File support, as well as support for using code to get at other sources of data. BIRTs use of the Open Data Access (ODA) framework allows anyone to build new UI and runtime support for any kind of tabular data.
= unsolved/reopened
BIRT (146)Build (4)
101416 Incorrect font format in BIRT Developer Guide in Help menu (closed/fixed)
103303 The chart engine.jar in the runtime distribution is the wrong file (closed/fixed)
105638 Rotated text report item displays in palette by default (closed/fixed)
106247 Eclpse Distro Path (closed/fixed)
Chart (46)
102417 Chart title is set to Chinese, can not be previewed correctly.(resolved/wontfix)
103130 Chart title is overlapped when previewed.(closed/worksforme)
103143 Data format doesn't work in Chart (closed/invalid)
103153 Scatter chart, if tick transposed, image does not be changed.(closed/fixed)
103168 X Axis data is lost when transposed.(closed/fixed)
103298 X series in a pie chart in wrong order (resolved/fixed)
103438 Scatter chart is displayed differently when it is transferred from another chart type.(closed/fixed)
103439 Steps in chart builder can't be restored to default setting when cleared out.(closed/fixed)
103453 Scale for 'datetime' type in chart builder doesn't work.(closed/fixed)
103460 Multiple x axis are not supported.(closed/fixed)
103463 Datetime marker line can't be set.(closed/worksforme)
103595 Datetime data in Chart axis of example are displayed inconsistently in layout.(closed/invalid)
103599 Resizing chart results in Eclipse hang up.(closed/fixed)
103602 Exception is thrown when setting chart height or width.(closed/worksforme)
103613 Linking chart by parameter causes error when a NULL param value is reached (resolved/fixed)
103617 if Label positioin is changed, then can not return initial state.(closed/fixed)
103618 Bar Chart , Label position is lack of inside item.(closed/fixed)
103770 don't use hyperlink (resolved/invalid)
103780 Chart is not displayed in layout view when transposed.(closed/fixed)
103782 Attached chart design file can't be previewed.(closed/fixed)
103787 Add a new Y-axis and set it's title to visible will cause chartException.(closed/fixed)
103960 If x axis type is 'Linear', scale should be grayed out.(closed/fixed)
103961 Marker and line doesn't work for X Axis.(closed/fixed)
103963 If there is no data for series, it should pop up a friendly error message to remind.(closed/fixed)
104248 Axis types on Chart dialog are not displayed in localized language.(verified/fixed)
104252 Sort option on Chart X-Series dialog is not displayed in localized language.(verified/fixed)
104254 Type and Action value on Chart Y-Series are not displayed in localized language.(verified/fixed)
104278 Values in Tick Style list box are not displayed in localized language.(verified/fixed)
104283 Value for Label Position on Chart dialog are not displayed in localized language.(verified/fixed)
104290 Hard coded strings on Chart Attributes>Y Series dialog (verified/fixed)
104313 Set the image to the chart label background, system throws exception (closed/fixed)
104315 Plot background image can not always take effort .(closed/worksforme)
104450 If plot background is set, data set binding is lost.(closed/fixed)
104465 Data values of Y-series cannot be displayed correctly (closed/invalid)
104613 Steps changed after chart is transposed.(closed/invalid)
104628 Chart Major.Minor Grid line style won't display in layout (closed/wontfix)
104631 If set a long title to chart X Axis,Axis type will be truncated (closed/fixed)
99331 Eclipse hangs when closing 'Chart Dialog' (resolved/fixed)
100746 Whole chart should display smaller on scale, not only display title and legend after resize (closed/invalid)
101039 Series colors do not have different default values (closed/fixed)
101179 Unfriendly error message display when preview chart with invalid data set (closed/fixed)
101806 Chart axis label background is not displayed properly in layout view.(closed/fixed)
101827 Exception should be processed before written to error log or some error message should pop up to warn user (closed/fixed)
101855 Chart title top.bottom inset should display right in layout view (closed/fixed)
101868 series value format can display as setting (closed/fixed)
102455 Pie Chart is not round (closed/fixed)
Data (22)
94542 Grouping versus Sorting (closed/invalid)
99479 After Update Birt 1.0 error Cannot load JDBC Driver class (resolved/fixed)
101553 Report Parameters are not working (resolved/duplicate)
101864 NullPointerException throws out when setting the parameter type as auto (closed/fixed)
101865 Try to set report parameter's value in beforeOpen method of data source,error occurred when save but preview was correct.(closed/duplicate)
103135 Change the name of one computed column which are used in dataset filter will cause the dataset filter invalid.(closed/fixed)
103151 When a data set parameter is generated automatically, error message doesn't always pop up.(closed/fixed)
103292 No error message when group key dismatches the interval (closed/fixed)
103296 Data set column doesn't work when it is entered by keyboard in data set filter page.(closed/fixed)
103346 Weekly interval groups by 7 day increments, not by week (resolved/fixed)
103625 Database URL will be refreshed when editing JAR files in Manage drivers dialog (closed/fixed)
104174 If I re-select csv file name, columns selected before in right pane disappeared.(closed/fixed)
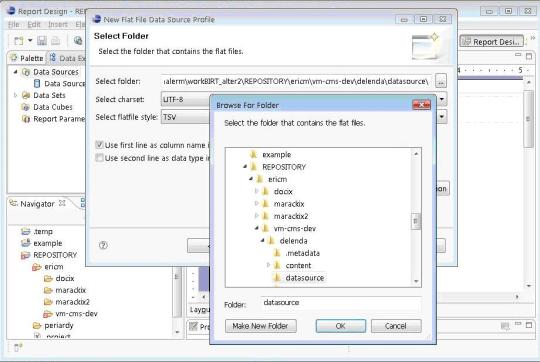
104178 Linux:No file listed for '*.*' filter when new a flat file data source (closed/fixed)
104185 An additional column is generated when create a script data set (closed/fixed)
104204 Test connection fail when try to connect birt derby sample db.(closed/fixed)
104397 JDBC Data Set Editor showing empty.system schemas (resolved/fixed)
104452 IllegalArgumentException thrown out when double click on data set after change flatfile data source charset (closed/fixed)
104578 German labels are truncated on Manage JDBC drivers dialog.(verified/fixed)
104611 Smoke Test: Jdbcodbc data source can't be connected.(closed/fixed)
104616 A sql statement with parameter can not be changed if you go out of 'Edit DataSet'->'Query' (closed/fixed)
106250 POJO Data Source (closed/fixed)
103802 Aggregate function in a group footer using Total.OVERALL fails (resolved/fixed)
Data Access (16)
99872 Implementing the ODA Log Configuration in BIRT ODA Drivers (resolved/fixed)
100090 JDBC driver loaded either by data explorer or report viewer (resolved/fixed)
100495 'next' button is grayed out in 'new data source' window when create a data source.(closed/fixed)
100501 NPE thrown out when new a flat file data set (closed/fixed)
101185 NullPointerException thrown out after click on Finish in data set dailog (closed/fixed)
101372 Limit the data set to a particular schema for JDBC connection (resolved/fixed)
102405 Broken display names when Qry has Dup col names (resolved/fixed)
103531 Change data set type from Flatfile Data Set to Flat File Data Set (resolved/fixed)
103533 Change Flatfile Data Source to Flat File Data Source (resolved/fixed)
103544 Allow any filename extension for CSV files (resolved/fixed)
103598 Flat file - Use second line as data type indicator only works for String (resolved/invalid)
103600 Change spelling in error message (resolved/fixed)
103942 Cannot create a JDBC connection (resolved/invalid)
104306 ODA Consumer handling of a null argument for IQuery.prepare (resolved/fixed)
104630 Column icons don't show up in connecting derby database (closed/fixed)
105112 ODA Log Configuration's Optional Attributes (resolved/fixed)
Documentation (3)
101582 Smoke Test: NullPointerException is thrown out when open an existing report design file in which there is grid.(closed/invalid)
101969 Wrong reference in BIRT Developer Guide (closed/fixed)
101977 API document is inconsistent with real implementation (closed/fixed)
Report (7)
87022 Use preservelastmodified in Ant Copy scripts (closed/fixed)
92091 rom.def - allowsUserProperties set to false for Styles, and other entries (resolved/fixed)
101825 Set bold style to grid in property editor and it will be reflected in grid highlight box when you add a highlight rule but will not when you modify it.(closed/fixed)
102496 onRender of Data item isn't executed (resolved/fixed)
102725 DimensionHandle can not parse '1,2in' (resolved/fixed)
103517 Cannot load 'Driver' class (resolved/fixed)
104769 org.eclipse.birt.report.model.metadata.ExtensionException found in meta.log (resolved/fixed)
Report Designer (28)
87803 Data Explorer view doesn't show new data source or data set (resolved/fixed)
87804 Incorrect rendering in BIRT property editor (closed/fixed)
87830 NullPointerException in org.eclipse.birt.report.designer.internal.ui.editors.schematic.ReportDesigner.selectionChanged (resolved/fixed)
88935 Wrong string formatting (upper and lower) (resolved/fixed)
100354 '%datasource.name' is listed in data sources list when create a data source.(closed/fixed)
100964 Provide Support for the Eclipse 3.1 Platform Release (resolved/fixed)
100965 Create a RCP version of BIRT Report Designer (resolved/fixed)
100999 Ctrl+Z.Y doesn't work in expression builder (closed/fixed)
101000 Font is not sorted in order.(closed/fixed)
101586 Exception throw out when new a table group with invalid group field (closed/fixed)
101973 Digit number for ruler displays partially when setting bigger value (closed/fixed)
102598 i18n bug mulitplies numbers by 10 (resolved/fixed)
102713 Undo.Redo can't be refreshed right away after setting hyperlink.(closed/fixed)
102969 Paste should be disabled when nothing is copied (closed/wontfix)
102973 Table group interval shouldn't change after preview (closed/fixed)
103126 hyperlink content in property editor can't be cleared (closed/fixed)
103158 NPE throw out when click on edit group in cheat sheet when delete table group (closed/fixed)
103171 edit the dynamic text won't restore last expression to expression builder (closed/invalid)
103526 New Data Set dialog box has red square on right side (resolved/fixed)
103788 Display inconsistantly in BIRT GUI (closed/fixed)
103962 RCP:Project icon can not displayed (closed/wontfix)
104184 The button in Dataset.Filters can not work (closed/fixed)
104307 when group on a double type field, set interval less than zero should be permitted (closed/fixed)
104617 In chinese testing environment, translation need to be improved.(closed/fixed)
104623 Highlight preview doesn't work when change two highlight rules order.(closed/fixed)
104764 Acceptance Test: New Report repeatly produces same name of file (closed/fixed)
101403 Smoke Test: Property editor view doesn't work.(closed/fixed)
101407 NullPointerException when selecting Save As in top menu (closed/fixed)
Report Engine (14)
96357 Projects contain errors when opened in Eclipse (resolved/worksforme)
101361 Bugs in org.eclipse.birt.report.engine.extension.internal.ExtensionManager (resolved/fixed)
101685 Unable to use the Report Item Extension framework, when no query exists (resolved/fixed)
101751 Enhance IImagehandler interface to allow full customization of birt image handling mechanism (resolved/fixed)
103050 PDF Hyperlinks (resolved/fixed)
103106 Generates incompatible FOP files (resolved/fixed)
103120 Hyperlink file can't be retrived when click it in PDF page (closed/invalid)
103169 Format number with Symbol prefix should display right size when preview in Linux (closed/wontfix)
103449 Log BIRT extension loading details information (resolved/fixed)
103622 Inline for two grids doesn't work in layout view and pdf preview.(closed/duplicate)
104172 Blank pages will be generated when set Page Break to always.left.right.(closed/invalid)
104239 Value-Of Problem (resolved/fixed)
104457 Set table drop to all, preview does not take effect.(closed/worksforme)
104629 Generating report in custom plugin cause exception fop.xml malformed URL (resolved/fixed)
Report Viewer (5)
Birt Report Pojo Data Source Example
100596 DateTime parameters not functioning as report parameters (resolved/invalid)
104177 Spaces in parameter value which is entered are trimmed when previewed in html.(closed/wontfix)
104462 There is a parameter in a parameter group, 'show report parameters' button is always grayed out when previewed.(closed/fixed)
104759 Image imported from a related path in file system can't be previewed.(closed/invalid)
104962 Smoke Test: Data can't be displayed when previewed if data source type is 'sample datasource' or 'JDBC Data Source' except 'JDBCODBC driver'.(closed/fixed)
Test Suite (1)
100968 Provide Daily Build Test Reports on eclipse.org.birt Web Site (closed/fixed)
In a previous blog post I created a skeleton class for rendering a report using BIRT runtime. You can pass it the report parameters, the report definition (rptdesign) and an OutputStream and it will render HTML to that stream.
If your report definition contains graphs we run into a problem. Normally, in HTML an image is a separate resource. BIRT will generate the images containing your graphs in a temporary directory and will link to them in your HTML. For this to work, you will have to configure the Platform to write the images to a publicly accessible directory and write the links using the correct domains. Furthermore, you’ll probably need some process to clean up the images after the reports have been viewed. If your reports are being used in some website and generated on the fly, this is most likely quite difficult to determine. Maybe when the user logs out?
Luckily, in modern browsers we can embed the images in the same stream, bypassing the need of a temporary directory. The following trick will encode the image with base64 and embed it directly into the HTML stream using css data . This will work on most modern browsers but of course Internet Explorer lags a bit behind. PNG support is available up until 32kb in Internet Explorer 8 and SVG not at all. Internet Explorer 9 works fine, as well as the other major browsers.
So how does it work? First, we explicitly tell the render engine to use PNG or SVG. SVG provides sharper images but will not work in Internet Explorer 8 as mentioned above. Next, we inject our own HTMLServerImageHandler which encodes the image data to base64.
Birt Pojo Data Source Example
2
4
6
8
10
12
14
16
18
20
22
24
privateHTMLRenderOption getHtmlRenderOptions(OutputStream outs)(
HTMLRenderOption options=newHTMLRenderOption();
options.setSupportedImageFormats('SVG');
options.setSupportedImageFormats('PNG');
setupImageHandler(options);
options.setOutputFormat('html');
)
privatevoidsetupImageHandler(finalHTMLRenderOption options)(
options.setImageHandler(newHTMLServerImageHandler()(
protectedStringhandleImage(IImage image,Objectcontext,Stringprefix,booleanneedMap)(
StringembeddedImage=Base64.encode(image.getImageData(),false);
return'data:'+image.getMimeType()+';base64,'+embeddedImage;
));
Birt Pojo Data Source Examples
Some references:
1 note
·
View note
Text
A Guide In Firefox to New And Creative CSS DevTools
Over the last few years, our team at
Firefox
has been operating on new CSS gear that address both cutting-edge strategies and age-old frustrations. We’re the Layout Tools team, a subset of Firefox Developer Tools, and our quest is to improve the modern-day internet layout workflow.
The internet has seen an first-rate evolution inside the final decade: new HTML/CSS functions, browser improvements, and design strategies. Our crew is dedicated to constructing gear that fit that innovation so that designers and developers can harness extra of the performance and creativity that’s now possible.
In this guide, we’ll proportion a top level view of our seven new equipment, with memories from the design system and realistic steps for trying out each tool.
1. Grid Inspector
It all started out three years in the past while our CSS format expert and dev advocate, Jen Simmons, labored with members of Firefox
DevTools
to construct a device that would aid customers in examining CSS Grid layouts.
As one of the most powerful new functions of the cutting-edge internet, CSS Grid had quick gained decent browser adoption, but it still had low internet site adoption. There’s a steep studying curve, and you nevertheless need fallbacks for sure browsers. Thus, part of our purpose turned into to help popularize Grid by way of giving developers a more hands-on manner to research it.
The middle of the device is a grid outline, overlaid at the page, which facilitates devs visualize how the grid is positioning their elements, and the way the layout modifications once they tweak their styles. We introduced numbered labels to identify each grid line, the capability to view up to 3 grids at once, and colour customization for the overlays. Recently, we also introduced support for subgrid, a modern day CSS specification implemented in Firefox and hopefully in extra browsers soon.
Grid Inspector changed into an idea for all of the tools that followed. It was even an notion for a brand new team: Layout Tools! Formed in late 2017, we’re unfold across 4 time zones and collaborate with many others in Mozilla, like our rendering engine builders and the best parents at MDN.
TRY OUT THE GRID INSPECTOR
In Firefox, go to our Grid example site.
Open the Inspector with Cmd + Shift + C.
Turn on Grid overlay through one of 3 ways:
Layout Panel:
In the Grid section, check the checkbox subsequent to .Content.Grid-content;
Markup View:
Toggle the “grid” badge next to ;
Rules View:
Click the button next to display:grid; inside
#page
-intro .Grid-content;
Experiment with the Grid Inspector:
Change the crimson overlay coloration to red;
Toggle “Line numbers” or “Extend strains infinitely”;
Turn on greater grid overlays;
See what takes place while you disable grid-gap: 15px in Rules.
2. The Editor of Form Path
The next project we have been working on has been the Shape Path Editor: our first visual editing tool.
CSS Shapes permits you to define shapes for textual content to drift around: a circle, a triangle, or a many-sided polygon. It can be used with the clip-path assets which permits you to trim elements to any of those equal shapes. These two techniques collectively open the opportunity for a few very specific graphic design-stimulated layouts.
However, creating these sometimes complicated shapes can be difficult. Typing all the coordinates manually and the use of the right CSS units is error-inclined and some distance eliminated from the creative mind-set that Shapes allows. Therefore, we made a device that allows you to edit your code through at once clicking and dragging shapes on the web page.
This kind of feature—visible editing—became new for us and browser tools in general. It’s an instance of how we will go beyond inspecting and debugging and into the world of design.
TRY OUT THE SHAPE PATH EDITOR
In Firefox, go to this web page at the An Event Apart website.
Open the Inspector with Cmd + Shift + C and pick out the first circular image.
In Rules, click on the icon subsequent to the shape-outside property.
On the web page, click on the factors of the shape and notice what happens while you drag to make the shape massive or tiny. Change it to a size that appears exact to you.
3. Text Reader
We have had a Fonts panel in Firefox for years which displays an informative list of all the fonts used in a website. We decided to convert this into a Font Editor to fine-tune the properties of a font by continuing our trend of designing in the browser.
A driving force behind this assignment become our purpose to support Variable Fonts at the same time that the Firefox rendering engine team changed into adding support for it. Variable Fonts gives font designers a way to offer fine-grained variations alongside axes, like weight, within one font file. It also supports custom axes, which offer each font creators and web designers an exceptional amount of flexibility. Our device routinely detects these custom axes and offers you a manner to alter and visualize them. This would otherwise require specialized websites like Axis-Praxis. Additionally, we added a characteristic that gives the ability to hover over a font name to spotlight in which that particular font is being used at the page. This is helpful because the manner browsers select the font used to render a bit of text can be complex and depend upon one’s computer. Some characters may be abruptly swapped out for a special font due to font subsetting. TRY OUT THE FONTS EDITOR
In Firefox, go to this variable fonts demo site.
Open the Inspector with Cmd + Shift + C and pick out the word “variable” within the title (the element’s selector is .Title__variable-web__variable).
In the 1/3 pane of the Inspector, navigate to the Fonts panel:
Hover over the font name Output Sans Regular to look what receives highlighted;
Try out the load and slant sliders;
Take a take a look at the preset font versions within the Instances dropdown menu.
4. Flexbox Inspector
Our Grid, Shapes, and Variable Fonts equipment can together electricity some very advanced graphic layout at the internet, but they’re still somewhat present day based on browser support. (They’re nearly there, however still require fallbacks.) We didn’t need to work most effective on new features—we were drawn to the problems that maximum web builders face on a every day basis.
So we started work at the Flexbox Inspector. Design-wise, this has been our most ambitious assignment, and it sprouted some new consumer research strategies for our team.
Like Grid, CSS Flexbox has a fairly steep learning curve while you first get started. It takes time to truely recognize it, and a lot of us hotel to trial and error to gain the layouts we need. At the beginning of the assignment, our team wasn’t even sure if we understood Flexbox ourselves, and we didn’t recognize what the main challenges have been. So we leveled up our understanding, and we ran a survey to discover what human beings wanted the most when it got here to Flexbox.
The outcomes had a big effect on our plans, making the case for complicated visualizations like grow/decrease and min/max. We continued operating with the community at some point of the task by means of incorporating remarks into evolving visual prototypes and Nightly builds.
The tool consists of two main parts: a highlighter that works just like the Grid Inspector’s, and a detailed Flexbox device inside the Inspector. The middle of the tool is a flex item diagram with sizing info.
With help from Gecko format engineers, we have been able to show the step-by-step size choices of the rendering engine to offer users a full image of why and the way a flex object ended up with a positive size.
Note: Learn the full tale of our design manner in “Designing the Flexbox Inspector”.
TRY OUT THE FLEXBOX INSPECTOR
In Firefox, visit Mozilla’s Bugzilla.
Open the Inspector with Cmd + Shift + C and pick out the element div.Inner (simply inside the header bar).
Turn on the Flexbox overlay through one of 3 ways:
Layout Panel:
In the Flex Container section, turn on the switch;
Markup View:
Toggle the “flex” badge next to ;
Rules View:
Click the button next to display:flex.
Use the Flex Container panel to navigate to a Flex Item known as nav#header-nav.
Note the sizes shown within the diagram and length chart;
Increase and reduce your browser’s width and see how the diagram modifications.
Interlude: Doubling Down On Research
As a small team and not using a formal person research support, we’ve regularly resorted to design-by-dogfooding: basing our critiques on our personal stories in using the tools. But after our achievement with the Flexbox survey, we knew we wanted to be better at collecting statistics to guide us. We ran a new survey to assist tell our subsequent steps. We crowdsourced a list of the 20 largest demanding situations faced by internet devs and asked our community to rank them using a max-diff format. When we discovered that the huge winner of the demanding situations was CSS Layout Debugging, we ran a follow-up survey on unique CSS insects to discover the largest pain points. We supplemented these surveys with user interviews and user testing. We also asked folks to rank their frustrations with browser developer tools. The clear pinnacle difficulty became moving CSS modifications returned to the editor. This became our subsequent project.
5. Changes Panel
The difficulty in shifting one’s work from a browser developer device to the editor is one of those age-old issues that we all just got used to. We were excited to make a easy and straight away usable solution.
Edge and Chrome DevTools got here out with versions of this device first. Ours is centered on assisting a wide range of CSS workflows: Launch DevTools, trade any patterns you want, and then export your modifications by means of either copying the overall set of changes (for collaboration) or simply one changed rule (for pasting into code). This improves the robustness of the whole workflow, such as our other format tools. And this is just a start: We recognize accidental refreshing and navigation from the web page is a huge source of facts loss, so a manner to bring persistence to the tool may be an essential next step. TRY OUT THE CHANGES PANEL
In Firefox, navigate to any website.
Open the Inspector with Cmd + Shift + C and pick an element.
Make some adjustments to the CSS:
Modify patterns inside the Rules pane;
Adjust fonts within the Fonts pane.
In the right pane of the Inspector, navigate to the Changes tab and do the following:
Click Copy All Changes, then paste it in a text editor to view the output;
Hover over the selector name and click Copy Rule, then paste it to view the output.
6. Inactive CSS
Our Inactive CSS feature solves one of the top troubles from our layout debugging survey on precise CSS bugs: “Why is this CSS assets now not doing anything?”
Design-wise, this feature is very simple—it grays out CSS that doesn’t affect the page, and shows a tooltip to give an explanation for why the property doesn’t have an effect. But we understand this can enhance efficiency and cut down on frustration. We have been bolstered by research from Sarah Lim and her colleagues who constructed a similar device. In their studies, they observed that novice builders had been 50�ster at building with CSS when they used a device that allowed them to ignore beside the point code.
In a way, that is our favorite sort of feature: A low-placing UX fruit that barely registers as a feature, however improves the complete workflow without actually wanting to be determined or learned. Inactive CSS launches in Firefox 70 but may be used now in prerelease variations of Firefox, consisting of Developer Edition, Beta, and Nightly. TRY OUT INACTIVE CSS
Download Firefox Developer Edition;
Open Firefox and navigate to
wikipedia.Org;
Open the Inspector with Cmd + Shift + C and choose the center content material area, called central-featured;
Note the grayed out vertical-align declaration;
Hover over the data icon, and click on “Learn extra” if you’re interested.
7. Accessibility Panel
Along the way we’ve had accessibility functions developed by means of a separate group that’s typically one person — Yura Zenevich, this year together with his intern Maliha Islam.Together they’ve turned the brand new Accessibility panel in Firefox into a powerful inspection and auditing tool. Besides displaying the accessibility tree and properties, you could now run different varieties of checks on a page. So far the checks include shade contrast, textual content labels, and keyboard attention styling.
Now in Nightly, you can strive the new shade blindness simulator which harnesses our upcoming WebRender tech.
TRY OUT THE ACCESSIBILITY PANEL
Download Firefox Developer Edition;
Navigate to
meetup.Com;
In the developer tools, navigate to the Accessibility tab, and click the “Turn on Accessibility Features” button;
Click the drop-down menu subsequent to “Check for problems” and pick out “All Issues”;
Take a have a look at the diverse contrast, keyboard, and text label troubles, and click the “Learn greater” links if you’re interested.
Next Up
We’re currently hard at paintings on a browser compatibility tool that uses facts from MDN to expose browser-specific problems for a particular element. You can follow along on GitHub to learn extra. The Future
We’re committed to helping the modern-day web, and that means continuously converting and growing. New specs get implemented via browser vendors all of the time. Guidelines and nice practices around progressive enhancement, responsiveness, and accessibility evolve constantly. Us device makers need to hold evolving too.
And what of the long-lived, ever-present troubles in creating the web? What ordinary user interfaces need to be rethought? These are a number of the questions that preserve us going!
What approximately a better manner to navigate the DOM tree of a page? That a part of DevTools has gone essentially unchanged since the Firebug days.
We’ve been experimenting with functions like again and forward buttons that might ease navigation between lately visited elements. A extra dramatic trade we’re discussing is including a compact DOM view that makes use of a syntax much like HTML templating engines. The attention could be on the most common use case—navigating to CSS—as opposed to viewing/enhancing the source.
We’ve additionally been thinking about a higher element selector. We realize how it can be more effective to work inside the web page, with much less jumping backward and forward into DevTools. We should make the detail selector extra effective and greater persistent. Perhaps it could choose whitespace on a page and tell you what causes that space, or it can shed mild at the relationships between extraordinary elements.
As a reputed Software Solutions Developer we have expertise in providing dedicated remote and outsourced technical resources for software services at very nominal cost. Besides experts in full stacks We also build web solutions, mobile apps and work on system integration, performance enhancement, cloud migrations and big data analytics. Don’t hesitate to
get in touch with us!
Source:
whizzystack.co
#b2b ecommerce
#b2b content marketing
#b2b seo
#b2b marketing blog
1 note
·
View note
Text
Set Chart Axis Properties & Text Handling Before/After Switches During Mail Merge using Java
What's New in this Release?
Aspose development team is happy to announce the monthly release of Aspose.Words for Java 17.12. 0. There are 91 improvements and fixes in this regular monthly release. The most notable are: PixelFormat property in ImageSaveOptions class, Metered License upgraded to REST API 1.2, Fixed few Veracode issues reported by user, Implemented API to set chart axis properties, Added feature to get the docPartGallery valze of StructuredDocumentTag of type SdtType.DocPartObj, Horizontal and vertical flipping attributes are now taken into account when rendering DML textboxes, Improved rendering of diacritics for “Courier New” font, Multiline MathML expressions rendering fixed, EMR_ROUNDRECT records processing while rendering metafiles fixed, PDF Rendering of indexed images while converting to CMYK color space fixed, OTF(CFF) fonts to PDF/A documents export fixed, DML Charts with empty area do not throw exception on rendering now, Fixed scaling problem with DML bubble charts on rendering, LINQ Reporting Engine supports dynamic setting of chart axes’ titles, Improved handling of decimal tab alignment in cells when paragraph has hanging indent, Improved text wrapping when line contains single or no characters, Improved handling of cell margins and table alignment, Improved cell alignment when line has trailing spaces and custom tabs, improved handling of collapsed paragraphs, Fixed exception in rare case when line break point cannot be found and Fixed exception when document is saved with revision balloons inside of a cell. If users want to work with chart axis, scaling, and display units for the value axis, please use ChartAxis, AxisDisplayUnit, and AxisScaling classes. Following article shows how to define X and Y axis properties. It has provided typed access to a merge field’s properties in this release of Aspose.Words. It has changed the return type of the FieldMergingArgsBase.Field property (and hence of the corresponding descendants’ properties) from Field to FieldMergeField. The list of new and improved features added in this release are given below
Implement PixelFormat property in ImageSaveOptions class in Aspose.Words for Java
Metered License code upgraded to REST API 1.2.
Add feature to Format X/Y/Z Axis of chart.
Add feature to format axis numbers of chart
Add feature to format axis (minimum and maximum bounds)
Add feature to set Axis Title of Chart using LINQ Reporting
Adding the chart axis label formatting.
Add feature to set/get "Specify interval unit" of axis label
Add feature to Format Axis Number
Add feature to get the docPartGallery value of StructuredDocumentTag of type SdtType.DocPartObj
Implement Aspose.Words for .NET Core
Add feature to support Aspose.Words for .NET Core 2.0
Different behavior of Section New Page Break in 16.7 and 17.11
Extra empty space appear after conversion from Docx to Pdf
Document.UpdateFields does not update the AUTOTEXT
Content shifts down to the pages in PDF
Empty page is created after section break in output Pdf
Identify elements close to page boarder.
Transparent images are lost in output Pdf
Text is shifted down to the page in output PDF
Wrong empty formula appears in document after accepting revisions
Shape's position is changed in output PDF
DOCX to PDF, table on page moved down
Contents are pushed down to the page in output PDF
Table's position is changed after conversion from Docx to Pdf
Simplified font is used instead of Traditional in Chinese (Taiwan) document
Rtf's text font is changed
Position of numbers in cell is changed after conversion from DOCX to PDF
Expose switches in MailMerge Field
Add exception when TableEnd field is missing
Add support for svgBlip drawing extension.
Check on summer 2015 // Doc to tiff conversion issue with text rendering issue
Merged cells are lost after when UpdateTableLayout method is called
/rounding/ Blank page is created after conversion from Docx to Pdf
TestCmykImageDefectJ21 is rendered to PDF incorrectly when ShowAllFormattingMarks are set to true
/text wrap/ Text moves after converting Word to PDF
/delete revisions balloons/ Failed to render revisions balloons when the last table row is deleted
Aspose Word hang when processing HTML
RTF to PDF, Issues with margins/indents
Image Rendering Issue
Document.UpdateFields does not stop (endless loop)
Chart get blurry when convert word to html
Borders specified for "colgroup" element are not applied to cell
RTF: Background image is lost for textboxes inlined with text
/Courier New + diacritics with non-zero advance/ Russian text accent rendering issue in resultant PDF
/Courier New + diacritics with non-zero advance/ Herbew text accent rendering issue in resultant PDF
Page number shifted to right in DOCX to PDF conversion
XmlMapping.SetMapping throws System.InvalidOperationException
DOCX to DOCX conversion issue with font of pie chart title
Footnote formatting is changed after joining RTF documents
/revisions/ List rendering issue in PDF document
DOCX to PDF rendering truncate the footer shape
Tables are not properly aligned in pdf output
Empty Area Chart. Exception is thrown when converting to PDF .
Cell's top border is lost after using Borders.Top
ImageSaveOptions.PageIndex is ignored when IPageSavingCallback is implements
System.ArgumentNullException when converting specific file
Symbol Field Color in Footer is lost in PDF conversion
Save as PDF Compliance PDF/A incorrectly includes OpenType Font
Incorrect inserting ole object as "htmlfile"
An exception raises when loading HTML document.
Position of cell's text is changed in output PDF
Text is rendered on next page in output PDF
Extra empty space is rendered in table's cell
Other most recent bug fixes are also included in this release
Newly added documentation pages and articles
Some new tips and articles have now been added into Aspose.Words for .NET documentation that may guide users briefly how to use Aspose.Words for performing different tasks like the followings.
How to Set Chart Axis Properties
How to Handle Text Before and After Switches During Mail Merge Operation
Overview: Aspose.Words
Aspose.Words is a word processing component that enables .NET, Java & Android applications to read, write and modify Word documents without using Microsoft Word. Other useful features include document creation, content and formatting manipulation, mail merge abilities, reporting features, TOC updated/rebuilt, Embedded OOXML, Footnotes rendering and support of DOCX, DOC, WordprocessingML, HTML, XHTML, TXT and PDF formats (requires Aspose.Pdf). It supports both 32-bit and 64-bit operating systems. You can even use Aspose.Words for .NET to build applications with Mono.
More about Aspose.Words
Homepage Java Word Library
Download Aspose.Words for Java
Online documentation of Aspose.Words
#Set Chart Axis Properties#Format X/Y/Z Axis of chart#format axis numbers of chart#Transparent images are lost#improved DOCX to PDF#DOCX to TIFF image rendering#Java Word Processing
0 notes
Text
America: Not The New Jerusalem, Merely Another Rome
”When I was a child, I spake as a child, I understood as a child, I thought as a child: but when I became a man, I put away childish things.” -- Paul the Apostle (1 Corinthians 13:11 KJV)
”And ye shall know the truth, and the truth shall make you free.” -- Jesus Christ of Nazareth (John 8:34 KJV)
Ronald Reagan, tending the garden of thorns Dick Nixon had sown, referred to America as “a city on a hill”, thus appropriating Jesus’ words via John Winthrop through John F. Kennedy.
It’s interesting to chart the progression. Let’s do so in reverse.
Reagan: ”I've spoken of the shining city all my political life, but I don't know if I ever quite communicated what I saw when I said it. But in my mind it was a tall, proud city built on rocks stronger than oceans, wind-swept, God-blessed, and teeming with people of all kinds living in harmony and peace; a city with free ports that hummed with commerce and creativity. And if there had to be city walls, the walls had doors and the doors were open to anyone with the will and the heart to get here. That's how I saw it, and see it still.”
Kennedy: ”I have been guided by the standard John Winthrop set before…’We must always consider…that we shall be as a city upon a hill—the eyes of all people are upon us’. Today the eyes of all people are truly upon us—and our governments, in every branch, at every level, national, state and local, must be as a city upon a hill—constructed and inhabited by men aware of their great trust and their great responsibilities…History will not judge our endeavors—and a government cannot be selected—merely on the basis of color or creed or even party affiliation. Neither will competence and loyalty and stature, while essential to the utmost, suffice in times such as these. For of those to whom much is given, much is required…”
Winthrop: ”Now the only way to…provide for our posterity is to follow the counsel of Micah, to do justly, to love mercy, to walk humbly with our God, for this end, we must be knit together in this work as one man, we must entertain each other in brotherly affection, we must be willing to abridge ourselves of our superfluities, for the supply of others’ necessities, we must uphold a familiar commerce together in all meekness, gentleness, patience and liberality, we must delight in each other, make others’ conditions our own, rejoice together, mourn together, labor, and suffer together, always having before our eyes our commission and community in the work, our community as members of the same body, so shall we keep the unity of the spirit in the bond of peace… for we must consider that we shall be as a City upon a Hill, the eyes of all people are upon us; so that if we shall deal falsely with our God in this work we have undertaken and so cause Him to withdraw His present help from us, we shall be made a story and a byword through the world, we shall open the mouths of enemies to speak…curses upon us till we be consumed out of the good land whether we are going”
Jesus: ”Ye are the light of the world. A city that is set on an hill cannot be hid.” (Matthew 5:14 KJV)
Go back and read Reagan’s statement.
While I’ve trimmed Kennedy and Winthrop’s quotes and edited the latter for clarity (God bless Noah Webster for standardized spelling!), there’s a striking difference between what they saw as a city on a hill and what Reagan saw.
Reagan operates under the presumption that of course we’re the best, of course everyone else will look up to us, of course we are the New Jerusalem referenced in the Bible.
We are God’s anointed, His new chosen people. America is God’s Promised Land, a nation to which all other nations can merely hope to aspire to be.
Our shitte truly stinketh notte.
Reality? We have fucked up and we have fucked up badly.
Compare Reagan’s self-congratulatory, ignorant nostalgia with the dire warnings of Kenney and Winthrop.
Yes, there is great promise.
Yes, there is great potential.
Yes, we are a city on a hill.
But Kennedy and Winthrop both cautioned that history and the world would not be kind if we failed to live up to our own grandiose promises.
(And, yeah, there’s irony in that, considering how both failed to make good on those promises, ///but at least they knew the danger was there///.)
Look at Matthew 5:13, the verse immediately preceding Jesus’ original “city on a hill” reference: ”Ye are the salt of the earth: but if the salt have lost his savour, wherewith shall it be salted? it is thenceforth good for nothing, but to be cast out, and to be trodden under foot of men.”
America is no New Jerusalem, no Holy Israel of the New World, no Promised Land.
Rather, we are the New Rome, an empire built on greed and ruthlessness and blood and genocide.
And slavery. Let us never omit that original sin, or its bastard step-sibling, white supremacy.
As long as the history of this nation was written by the Parson Weems of the world, be they well meaning hagiographers or unprincipled propagandists, it was the history of white Christianist* men of property succeeding because God and / or providence had deemed them the masters of the universe, the unquestioned rulers of the earth.
(Oh, there might be a mean one once in a while, maybe an occasional bad one, but it was a white man with money’s world, and if non-whites and non-males wanted to enjoy even the slightest taste, the first thing they had to doo was make sure white Christianist male supremacy reigned supreme.)
Our nation has been at war virtually its entire existence.
It has slaughter and subjugated literally millions of people around the world.
Don’t give me that bullshit about the American Revolution being a good and just war -- Canada stayed under British rule and did just fine, thank you, and although they have their own problems, a far less bloody history than the United States.**
Don’t give me that bullshit about the Civil War being a good and just war -- there shouldn’t have been any need for a civil war if the first shipload of African slaves to arrive in North America had simply been seized and freed.
Don’t give me that bullshit on World War Two being a good and just war -- if Hitler hadn’t declared war on us, we would have never gotten involved in Europe.***
America has waged incessant war against other nations and native peoples in order to make a few wealthy people even wealthier.
Can we justify the War of 1812? No.
Can we Justify the Mexican War? No.
Can we justify the Spanish-American War or the too numerous to recount Latin American bush wars? No.
Can we justify the Philippines, or Korea, or Vietnam?
Don’t even pretend we can justify what we’ve done in the Middle East.
And as terrible as those are, those are the crimes we’ve committed against others.
Look at how terribly we treat one another.
After centuries of enslavement, African-Americans then needed to endure the humiliation of segregation.
Hispanic Americans who can trace their ancestry in this land much further back than any Anglo found themselves aliens in their own country.
Women and non-Christians and anybody outside of toxic white male heterosexual norms declared unfit and excluded from the public sphere.
And we allowed the tiny greedy few at the very top to rob us and pick our pockets and let our families and children suffer because they promised us if we did so, they’d let us feel that we were the best simply because we were white Christianist males.
We are long overdue for our moment of clarity, our agonizing reappraisal, out “come to Jesus” moment when we recognize our sins and shortcomings.
We gotta stop eating our own bullshit and recognize ourselves for the villains we are.
Only by identify the source of the contagion and draining the virulent infection can we hope to cure it.
”Ye are of your father the devil, and the lusts of your father ye will do. He was a murderer from the beginning, and abode not in the truth, because there is no truth in him. When he speaketh a lie, he speaketh of his own: for he is a liar, and the father of it.
”And because I tell you the truth, ye believe me not.” -- Jesus Christ of Nazareth (John 8:44-45 KJV)
© Buzz Dixon
* “Christianist” is a term coined by the political commentator Andrew Sullivan to refer to those people who are culturally Christian, who may even think of themselves as Christian, but in reality are as far from the teachings of Christ as is possible and just use their so-called Christian identity as an excuse to do whatever the fuck they feel like doing because “God loves us and forgives us and wants us to be in charge”.
** The taxation in “no taxation without representation” referred to England trying to get the colonies to take at least partial responsibility for triggering the bloody Seven Years War (in the U.S., the French & Indian War) that virtually drained England’s treasury and wrecked a couple of European empires in the process. One may argue the crown made a fatal misstep in not allowing token colonial participation in parliament, but you can’t say they were unfair in wanting the colonials to help pay for a war ///we started/// in direct violation of international treaties.
*** Not only were many prominent Americans against getting involved in European affairs, but a large number were pro-Nazi to boot, and they went to ground only when Hitler made it impossible to defend him any longer. And while we’re at it, let’s dispel with the myth that Hitler and the Axis would have won if the U.S. hadn’t stepped into the fray; Hitler lost WWII on June 22, 1941 when he invaded Russia. Contrary to the popular culture of the US and western Europe, it was Russia that took on the brunt of the German war machine, and Russia that painstakingly ground them down at great cost. To put it simply, Russia would have still beaten Germany without the help of the Allies; the Allies might not have beaten Germany without the help of the Russians. And while Japan was reeling from saturation bombings and the destruction of Hiroshima and Nagasaki, Russia declaring war on them was the moment they realized there was no hope left.
4 notes
·
View notes
Text
August Forecast for Capricorn
Stay centered, Capricorn. Your energy could come in waves this month, spiking to a high-pitched intensity one day and dropping into the depths the next. The Sun is taking its annual plunge in Leo and your eighth house of intimacy, merging and transformation, a time when you’ll crave more privacy and one-on-one encounters. Skip the huge crowds that make you feel overwhelmed. You’re an emotional sponge and could soak up everyone’s feelings; or you might just have your mind on one specific matter during this tunnel-vision transit, and it will be hard to engage in lighthearted small talk. With the Sun heating up your erotic eighth house, this could also be one steamy season—hello, sizzling summer escapades!
But be careful where you aim that concentrated Capricorn power, especially when the emotional thunderclouds gather. Communication planet Mercury is retrograde in Leo and this potent zone from July 26 to August 19, which notoriously mucks up communication, technology and travel plans. With Mercury awry in Leo, a problematic ex may resurface, along with some old trust issues or unhealed wounds from a past betrayal. You might be unsure of someone’s true motives and whether they’re being above-board with you.
The eighth house rules joint ventures and shared finances, so money matters could be lit up with both opportunities and complicated entanglements in August. While Mercury is retrograde, go easy on the spending, especially with your credit cards (lock them up—or cut ’em up—if you can!). Guard against identity theft by strengthening passwords and deleting anything in a social media feed or in your email that could potentially be compromising. Better safe than sorry. Watch where you send those racy texts and DMs—during Mercury retrograde, they could end up in the wrong person’s feed. Oops!
The fiercest day of the month arrives August 11, when a Leo solar (new moon) eclipse beams into your alchemical eighth house, bringing a supercharged fresh start to your most intimate ties and financial endeavors. You might receive a windfall through a loan, grant, commission or inheritance or have a chance to buy or sell property or renovate your home. An exciting opportunity to merge your powers for mutual gain may come out of the blue. The eclipse could also bring a soulmate encounter (with steamy benefits!) or unexpected news of a proposal or pregnancy (yours or someone close to you).
In astrology, solar and lunar eclipses are harbingers of change. They push us off the fence if we’ve been procrastinating or wishy-washy, and force events to culminate quickly. While that pace can be jarring, once the dust settles, everything starts to make sense. This is the second-to-last eclipse in a series that’s been touching down on the Leo/Aquarius axis since February 2017, bringing waves of change to your self-confidence, work, money management, living situation and daily habits. One final eclipse will arrive here in January 2019. Anything you invest in at today’s eclipse could start to show returns—or at least let you know whether it will ever pay off—by early next year.
You’ll be glad to let the drama (hopefully) simmer down starting August 7, when combustible Uranus starts a five-month retrograde. Since May 15, Uranus has been in Taurus, causing sweeping change in your fifth house of passion, self-expression and theatrics. This is Uranus’ first visit here since 1942, a once-in-a-lifetime transit for many Capricorns that will last until April 2026. If your love life has suddenly become spicy—or wildly unpredictable—that’s the side-spinning planet playing the role of a quirky Cupid.
The first four months of Uranus’ retrograde could slow down some of the curveballs—or possibly bring the return of an ex, since retrogrades rule the past. You might also decide to get a little experimental in the boudoir or to date someone who’s a dramatically different “type” than the usual. Uranus in your spotlight-stealing fifth house may have brought fame or increased attention. Has it gone to your head a little bit? If you’ve been playing the diva role, Uranus retrograde will remind you to keep it humble. On the other hand, if you haven’t been speaking up for yourself and your ideas, you could work through old confidence issues, perhaps with some mentorship or training. Steady Capricorn, have you become a little fickle? Rambunctious Uranus can make you run hot and cold, so be mindful not to lead people on.
You’ll get another chance to self-assess starting August 12, when energizing Mars plows into Capricorn for its second visit this year (its first trip was from March 17 to May 16). While this would normally give you a jolt of inspiration and sexy magnetism, Mars will be retrograde until August 27, which could cause you to come on way too strong or hit a sour note with people. The silver lining: From August 27 to September 10, you’ll have Mars moving full steam ahead through your sign. Your confidence and charisma should rocket off the charts—and others will surely take note!
This will only accelerate starting August 23, when the Sun starts a month-long visit to Virgo and your expansive ninth house. Adventure, travel and endless possibilities spread out in front of you as you emerge from that emo cocoon. And when the Sun snaps into a rare and harmonious grand trine with radical Uranus in your passion sector and your ruling planet, structured Saturn, in Capricorn, some of those starry-eyed visions could turn into tangible reality. The caveat? You’ll need to ditch some (not all!) of your trademark caution to seize this moment. An opportunity for love, fame or a chance to spread a powerful message could arise. Make sure you’re at your glamorous and charismatic best! (Every Cap we know has secret “stage presence,” even if you only pull it out for select occasions.) You could multiply your fanbase and following…or follow your heart with a love affair, whether that’s a romantic adventure with your one-and-only or a far-flung fling with someone wildly different than your usual type.
The next day, August 26, the year’s only Pisces full moon spotlights your communication house, bringing exciting news or long-overdue dialogue. At last, you’ll get the answer you’ve been waiting for, and you can proceed accordingly instead of staying stuck in limbo. Local events could turn up kindred spirits and great conversations that lead to more. Hit the street fair or late summer festival or host a gathering at your favorite hotspot where you can play superconnector and introduce your savviest friends. Don’t be afraid to “go there” in your conversations—move beyond small talk and voice your opinions and ideas. When sizzling Mars ends its two-month retrograde on August 27 and speeds forward in Capricorn, there will be no holding you back!
Love & Romance
Time to set some love #goals, Capricorn? On August 6, Venus pings into Libra and your tenth house of career and long-range planning for the first of two trips this year. You may get suddenly serious about the future, both in terms of your profession and your relationship. If you’re in one, you might find yourself initiating conversations that begin with, “So, I’ve been thinking about our holiday plans,” or “Next summer, I’d really like to…” Single? Stay open to people you meet at work or industry events. As long as you’re not breaking company policy, consider them fair game.
Keep in mind: Venus will be retrograde for its second trek through Libra, which is from October 31 to November 16. New relationships may hit a speed bump, or issues that you’re working on might take a sideways turn. Here’s where that famous Capricorn patience will come in very handy! An office romance could sour when Venus makes its U-turn later this year, so be very sure you’re both mature adults who will handle things with civility if things don’t work out.
With Mercury retrograde in Leo and your erotic eighth house until August 19, you might be tempted to hook up with an ex or go down a clandestine rabbit hole that’s a clear dead end. What do you really want out of this? Be sure you can answer that before you get entangled emotionally or sexually. For couples, this could be a powerful time to work through a thorny issue, perhaps with a therapist or healer to mediate. Money matters could be a source of tension, but the hidden blessing is that you’ll actually start talking about them—and all the embedded feelings of pain, shame or old baggage that might be underlying those power struggles. If you’re splitting up, you might need to have a painful conversation about how to divide up the shared property.
An especially potent day for building security and having a serious talk about the long term comes on August 7, when cosmic lovebirds Venus and Mars form a rare, harmonious trine (120-degree angle). Attached? Do something luxe and upscale to celebrate your couplehood. Singles should raise your standards and keep the bar high. Skip the local dive bar and go somewhere you have to dress up. That alone could help you meet a successful someone who’s got their life together.
But careful where you cast your charms. Mars is retrograde from June 26 to August 27. It’s been back-pedaling through Aquarius and your zone of career and money, which may have ramped up work stress that cut into your relationship or given you a few waves of anxious insecurity. On August 12, it will back into Capricorn for the duration of the retrograde, which could leave you feeling intensely self-conscious. During this signal-scrambling transit, your message might be lost in translation. Rather than assume everyone knows what you’re saying, make a point of being simple and precise. As a backup, get assurances that people heard you loud and clear.
Key Dates
August 9: Venus-Saturn Square Second thoughts? Cautious Saturn slams the brakes on dreamy Venus, who might be getting a little carried away with romantic pipe dreams or plans for the future. Make sure you both want the same things for the long haul before you start picking baby names or china patterns.
Money & Career
Balance those books, Capricorn. This is one of your annual “money months,” as the Sun visits Leo and your eighth house of property, long-term wealth and shared assets. With an August 11 Leo solar eclipse shaking up business as usual, you might start looking at your personal financial model through a new lens over the next six months. An exciting opportunity to multiply your moolah could arrive unexpectedly—and you’ll need to adapt fast! Keep a keen eye on every transaction while Mercury is retrograde in Leo from July 26 to August 19, which can cause technological glitches, erroneous charges (read those monthly bank statements) and risks to sensitive data.
Another reason not to rush into anything? Hasty Mars is spinning backward for nearly the whole month, which could cause you to miscalculate. Mars has been retrograde in Aquarius and your money house since June 26, which may have heaped on some financial stress. While Mars won’t straighten out until August 27, it WILL leave your money sector on August 12, which could lift some of the tension around work, bills and budgets. Stressful assignments, unexpected expenses and demanding clients may have left you hustling through the summer, and at the same time, colleagues’ tempers could have been short.
You’ll be happy to see Mars go, but unfortunately it will back into YOUR sign for the duration of its retrograde, from August 12 to 27, joining structured Saturn and power-tripping Pluto, which are both retrograde in Capricorn. Whew! If you have any vacation days, take them now. Otherwise, keep a very low profile and work behind the scenes. This is an excellent time to finish a project you started a while back. But hold off on any splashy launches until next month if you can—when Saturn straightens out on September 6, your ideas will have velocity AND staying power.
Key Dates
August 10: Mercury-Jupiter Square When supersizer Jupiter flashes its high beams at a retrograde Mercury, you or someone you work closely with may present an outsized dream but not have any idea how to pull it off. Nip it in the bud before you waste precious time, money or other resources trying to develop this. If anything, this is a good day to revisit an idea and see how much you can scale it BACK.
Love Days: 4, 9 Money Days: 15, 24 Luck Days: 12, 22 Off Days: 6, 11, 19
33 notes
·
View notes
Text
Skychart rotate 3d images

#Skychart rotate 3d images code
#Skychart rotate 3d images series
(myVScrollBar) // Place the bars on the panel, at chart edges MyHScrollBar.Maximum = 180 // Same stuff for horizontal scrollbar MyVScrollBar.Value = -15 // Starting angle MyVScrollBar.LargeChange = largeDeltaY // How far when clicking MyVScrollBar.SmallChange = smallDeltaY // How far when dragging MyVScrollBar.Maximum = 90 // Set limits and starting values, these could be properties MyHScrollBar.SetBounds( 0, height, width, scrollBarWidth) MyVScrollBar.SetBounds(width, 0, scrollBarWidth, height) // How big are they. MyHScrollBar.Location = new ( 0, height) // Where to pin scrollbars MyHScrollBar.Scroll += new ScrollEventHandler( this.myHScrollBar_Scroll) MyVScrollBar.Scroll += new ScrollEventHandler( this.myVScrollBar_Scroll) This gives you a "form" surface on which to draw the new control.Ĭ3D = true // Turn on 3DĬ = chartDepth // How deep is the chartĪxis axisY = // Set up for the axis dataĪxis axisX =
#Skychart rotate 3d images code
Note that the file holding the cls3DChart code was added to the project using the "Add User Control" option from the "Project" menu. With the call to InitializeChart(), the code for which appears in Listing 2. The code then adds the newly-defined control ( m圜hart) to theįorm via the Add(m圜hart) method call. The source code for this method is also in the demo file.)
#Skychart rotate 3d images series
Simply generates a series of random numbers and stores them in an array named series. Generates some random numbers by a call to GenerateTestData(). The code then sets a few of the chart's property members and then Upper-left corner of the control on whatever form you may be using to host theĬhart. The "x" and "y" coordinates are used to pin the At runtime, the "width" and "height" arguments determine the size of In that class, the Microsoft chart control is placed on a panelĬontrol. Sensed because we need the size and coordinates passed into the "cls3DChart"'sĬonstructor. Theĭefinition of m圜hart is deferred until the click event is The declaration of m圜hart appears earlier in the class using class scope. Part of the Calculate button click event. (I have omitted the numeric checks here, but they are in the demo source code.) The following code fragment is from Calculate button's click even in the demo program shown in Figure 1. The class by adding more properties and methods as you see fit. There are roughly a bazillion properties and methods for the basic Microsoft chart control, and my class only uses a few of them. While also smooth, there are some minor hiccups at 45 and 90 degrees as the graph's perspective changes. The horizontal scrollbar rotates the graph through 180 degrees. If the user drags the vertical scrollbar control, the graph's inclination angle is changed. While 3D charts are built into the Chart control, adding the scrollbars makes the chart a little more interesting. So I don't think you would have any difficulty converting it to some other language. While the language I used is C#, the basic chart class is available for all of the Visual Studio languages. The class is built on Microsoft's Chart control, which is integrated into Visual Studio. Making the chart rotatable in 3D just added some aroma to the sizzle.įigure 1 shows a demo use of the chart class used in this article. For me, using a 3D chart instead of a simple 2D chart was Supplied data series in a way that was useful to the management. All they asked for was a simple program that would display the That would give the prospective client some idea of what the project results would look like. On a recent consulting project, bidders were asked to supply a simple program Sometimes it's the sizzle that sells an idea rather than the idea itself.
0 notes
Text
React dist unpkg

#React dist unpkg how to#
#React dist unpkg install#
#React dist unpkg code#
#React dist unpkg code#
To lint your code, run the tests, and create code coverage reports: npm run full-test Requirementsreact-vis makes use of ES6 array methods such as.
#React dist unpkg install#
DevelopmentTo develop on this component, install the dependencies and then build and watch the static files: npm install & npm run startOnce complete, you can view the component's example in your browser (will open automatically).Īny changes you make to the example code will run the compiler to build the files again. Sunbursts about making sunburst diagrams. Parallel Coordinates about making parallel coordinate charts.
#React dist unpkg how to#
Scales and Data about how the attributes can be adjusted.Īnimations about how to tweak animations in the library. #4 More informationTake a look at the folder with examples or check out some docs: The global reactVis object will now be available for you to play around. If you're working in a non-node environment, you can also directly include the bundle and compiled style using basic html tags. … and add the following code to your render function: Import the necessary components from the library. Here's an example of importing only the legends "~react-vis/dist/styles/legends" This helps minimize the size of the outputted CSS. You can also select only the styles you want to use. npm install react-vis -saveInclude the built main CSS file in your HTML page or via "~react-vis/dist/style" react-vis supports the React's lifecycle and doesn't create unnecessary nodes. The library provides a set of defaults which can be overridden by the custom user's settings. This provides a high level of control of chart layout for applications that need it. For instance, separate X and Y axis components. react-vis provides a set of basic building blocks for different charts. react-vis doesn't require any deep knowledge of data visualization libraries to start building your first visualizations. This project initially started as a mozilla-services project.OverviewA collection of react components to render common data visualization charts, such as line/area/bar charts, heat maps, scatterplots, contour plots, hexagon heatmaps, pie and donut charts, sunbursts, radar charts, parallel coordinates, and tree maps. Title: Ĭonst log = (type) => (console, type) įor more information on what themes we support, see Using Themes. You'll also need to alias the default export property to use the Form component: const Form = fault Note: The CDN version does not embed react or react-dom. You can also install react-jsonschema-form (the 1.x version) which works with React 15+. Then import the dependency as follows: import Form from latest version requires React 16+. Installation ¶įirst install the dependency from npm: $ npm install -save React-jsonschema-form also comes with tools such as uiSchema and other form props to customize the look and feel of the form beyond the default themes. If you have a priori knowledge of your data and want a toolkit for generating forms for it, you might look elsewhere. If you want to generate a form for any data, sight unseen, simply given a JSON schema, react-jsonschema-form may be for you. React-jsonschema-form is meant to automatically generate a React form based on a JSON Schema. A simple React component capable of building HTML forms out of a JSON schema.Ī live playground is hosted on GitHub Pages:
0 notes
Text
Solana and Avalanche are rising in tandem as belief in the crypto market enhances. Key Takeaways Solana and Avalanche have actually increased by approximately 20% in the past 36 hours. SOL requires to remain above $42 to advance to $52 AVAX might set off a growth to $28 if it breaks $24 Solana and Avalanche are acquiring bullish momentum after slicing through essential resistance locations. Solana and Avalanche Overcome Resistance Solana and Avalanche appear well-positioned for gains as the wider cryptocurrency market takes pleasure in brand-new tailwinds Solana's SOL token has actually increased by almost 20% over the past 36 hours. It skyrocketed from a low of $3860 to publish a brand-new month-to-month high of $4610 The unexpected increase has actually permitted Solana to conquer an important location of resistance, possibly causing greater highs. Solana sliced through the middle trendline of a parallel channel that had actually established on its four-hour chart. Trading history reveals that whenever SOL has actually breached this barrier because June 20, it has actually advanced towards the channel's upper limit. Now, comparable rate action might press the property to $49 and even $52 SOL/USD four-hour chart (Source: TradingView) Avalanche has actually likewise seen a wave of bullish momentum over the past 36 hours, rising from a low of $2060 to a high of $2480 The upward impulse was activated after AVAX broke out of a balanced triangle that had actually established on its four-hour chart. With 2 corrections happening after the breakout, it appears that the token has actually gathered enough liquidity to advance even more. The height of the triangle's Y-axis recommends that Avalanche has actually gotten in a 38% uptrend towards $28 A continual four-hour candlestick close above the $2430 resistance level might even more confirm the bullish thesis. AVAX/USD four-hour chart (Source: TradingView) Although the chances appear to prefer the bulls, the assistance levels are important due to the continuous unpredictability throughout crypto and worldwide monetary markets. If Solana stops working to keep the channel's middle trendline at $42 as assistance, the positive outlook might be revoked. A four-hour candlestick close listed below this important level might activate a spike in profit-taking that sends out SOL to $3850 or $3520 Avalanche requires to prevent dipping listed below $22 as the downswing might start a retracement to $20 Disclosure: At the time of composing, the author of this piece owned BTC and ETH. For more crucial market patterns, sign up for our YouTube channel and get weekly updates from our lead bitcoin expert Nathan Batchelor. The details on or accessed through this site is gotten from independent sources our company believe to be precise and dependable, however Decentral Media, Inc. makes no representation or guarantee regarding the timeliness, efficiency, or precision of any details on or accessed through this site. Decentral Media, Inc. is not a financial investment consultant. We do not provide tailored financial investment recommendations or other monetary guidance. The details on this site goes through alter without notification. Some or all of the details on this site might end up being out-of-date, or it might be or end up being insufficient or unreliable. We may, however are not bound to, upgrade any out-of-date, insufficient, or unreliable details. You must never ever make a financial investment choice on an ICO, IEO, or other financial investment based upon the info on this site, and you must never ever translate or otherwise depend on any of the details on this site as financial investment guidance. We highly advise that you seek advice from a certified financial investment consultant or other competent monetary expert if you are looking for financial investment suggestions on an ICO, IEO, or other financial investment. We do decline settlement in any type for evaluating or reporting on any ICO, IEO, cryptocurrency, currency, tokenized sales, securities, or products.
See complete terms Solana Unveils Web3 Mobile Phone Solana is preparing to launch a cellphone, marking among the market's very first efforts to grow Web3 innovation beyond the desktop. Consisted of in the phone will be a dApp ... Solana Integrates Chainlink Price Oracles on Mainnet News Jun. 3, 2022 Chainlink revealed today that its decentralized rate oracles have actually appeared on Solana, at first permitting designers to source trustworthy, real-time rate information for 7 various trading sets, with hundreds more ... Avalanche Wants Otherside to Ditch Ethereum for a Subnet Avalanche has actually sent a proposition to ApeCoin DAO, recommending it moves the APE token and develops the Otherside Metaverse on an Avalanche Subnet. Avalanche Suggests Otherside Migration Avalanche has actually welcomed ... Read More
0 notes