#Tableau Software
Explore tagged Tumblr posts
Visit Tumblr Blog
Explore Tumblr blogs with no restrictions, modern design and the best experience.
Last Seen Tumblr Blogs


Fun Fact
Tumblr is available in 18 languages.
Text
Vizualizarea în Tableau Software
Misiunea Tableau Software este să vă ajute să vedeți și să înțelegeți datele dvs., permițând analiza vizuală cu auto-servire. Software-ul este conceput pentru a facilita analiza consumatorilor de informații non-tehnice. Figura 5 Show Me afișează opțiunile de diagrame Acesta este conceptul din spatele butonului Show Me de la Tableau, prezentat în figura 5. Show Me va fi asistentul dumneavoastră…
0 notes
Text
Industry-Leading Visualization with Tableau Data Visualization

1. User-Friendly Interface: The intuitive design allows anyone to easily start visualizing data.
2. Seamless Integration: Connects easily with various data sources for efficient analysis.
3. Quick Insights: Generate actionable insights within minutes.
4. Integrated Collaboration Tools: Share dashboards and insights with your team effortlessly.
5. Regular Updates: Tableau continuously evolves with new features and improvements.
Want to take your skills to the next level? Join our 1-day Tableau Bootcamp on 2nd November (Online)!
#tableau#tableau software#data visualization#data visualisation#dataviz#software#technology#cavillion#cavillion learning#data analytics#data#tableau online training#tableaudesktop#tableau dashboard#big data#business analytics#data analysis#data science#tableau course#salesforce#Tableau Tutorial#Tableau Visualization#Tableau Training#learn tableau#tableau certification#Tableau Visualisation
1 note
·
View note
Text
How AI-Powered Analytics Is Transforming Healthcare in 2025
In healthcare, seconds save lives. Imagine AI predicting a heart attack hours before symptoms strike or detecting cancer from a routine scan. This isn’t science fiction—AI-powered analytics in healthcare is making this a reality, turning data into life-saving insights.

By analyzing vast amounts of data, AI healthcare analytics help decode hidden patterns, improving diagnoses and personalizing treatments, which were unimaginable until a few years ago. The global healthcare analytics market is projected to hit $167 billion by 2030, growing at a 21.1% CAGR, thereby proving that data is becoming the foundation of modern medicine.
From real-time analytics in healthcare to AI-driven insights, the industry is witnessing a revolution—one that enhances patient care, optimizes hospital operations, and accelerates drug discovery. The future of healthcare is smarter, faster, and data-driven.
What Is AI-Powered Analytics in Healthcare?
AI-powered analytics uses artificial intelligence and machine learning to analyze patient data, detect patterns, and predict health risks. This empowers healthcare providers to make smarter, faster, and more personalized decisions. Here’s how this data revolution is reshaping healthcare:
1. Early Diagnosis and Predictive Analytics
AI-powered analytics can analyze massive datasets to identify patterns beyond human capability. Traditional diagnostic methods often rely on visible symptoms, but AI can detect subtle warning signs long before they manifest.
For example, real-time analytics in healthcare is proving life-saving in sepsis detection. Hospitals that employ AI-driven early warning systems have reported a 20% drop in sepsis mortality rates as these systems detect irregularities in vitals and trigger timely interventions.
2. Personalized Treatment Plans
AI-powered analytics can customize plans for individual patients based on genetic data, medical history, and lifestyle. This shift towards precision medicine eliminates the conventional one-size-fits-all approach.
AI also enables real-time patient monitoring and adjusting treatments based on continuous data collection from wearable devices and electronic health records (EHRs). This level of personalization is paving the way for safer, more effective treatments.
3. Smarter Hospital Operations
Hospitals generate 2,314 exabytes of data annually, yet much of it remains underutilized. AI-powered analytics is changing that by optimizing hospital operations to reduce inefficiencies and improve patient flow management.
For instance, Mount Sinai Hospital in New York uses AI-powered analytics for patient care by predicting life-threatening complications before they escalate. A clinical deterioration algorithm analyzes patient data daily, identifying 15 high-risk patients for immediate intervention by an intensive care rapid response team. Beyond emergency care, AI also prevents falls, detects delirium, and identifies malnutrition risks, ensuring proactive treatment.
4. Drug Discovery and Development
Developing a new drug is expensive and time-consuming, often taking 10-15 years and costing over $2.6 billion. However, AI-powered analytics is significantly reducing both time and costs by analyzing millions of chemical compounds, predicting potential drug candidates, and streamlining clinical trials faster than traditional methods.
During the COVID-19 pandemic, AI played a crucial role in identifying potential antiviral treatments by rapidly analyzing millions of drug interactions – a process that would have taken human researchers years. Additionally, AI is now being used to repurpose existing drugs, optimize trial designs, and predict patient responses, making pharmaceutical development faster, more efficient, and data-driven.
5. 24/7 Patient Support with AI Chatbots and Virtual Assistants

A survey by Accenture estimates that AI applications, including chatbots, could save the U.S. healthcare system around $150 billion annually by 2026. These savings stem from improved patient access and engagement, as well as a reduction in costs linked to in-person medical visits. AI-driven healthcare analytics is making healthcare more efficient, patient-centric, and responsive to individual needs.
Challenges in AI-Driven Healthcare
Despite its potential to revolutionize healthcare, AI-powered healthcare data & analytics come with challenges that must be addressed for widespread adoption. Some of the challenges are:
Data Privacy and Security: Healthcare systems handle sensitive patient data, making them prime targets for cyberattacks. Ensuring robust encryption, strict access controls, and compliance with HIPAA and GDPR is critical to maintaining patient trust and regulatory adherence.
Bias in AI Models: If AI systems are trained on biased datasets, they can perpetuate healthcare disparities, thereby leading to misdiagnoses and unequal treatment recommendations. Developing diverse, high-quality datasets and regularly auditing AI models can help mitigate bias.
Regulatory Compliance: AI-driven healthcare solutions must align with strict regulations to ensure ethical use. Organizations must work closely with regulatory bodies to maintain transparency and uphold ethical AI practices.
What’s Next in Smart Healthcare?
AI-Powered Surgeries: Robotic assistance enhances precision and reduces risks.
Smart Wearables: Track vital signs in real-time and alert patients to anomalies.
Mental Health Tech: Predictive tools offer proactive support and personalized therapy.
Why It Matters
AI isn’t replacing doctors—it’s augmenting their decision-making with data-driven insights. Healthcare systems that adopt analytics will see:
Improved patient outcomes
Reduced costs
Streamlined operations
#data analytics#no code platforms#business intelligence#ai tools#software#predictiveinsights#predictive modeling#tableau#tableau alternative#agentic ai#textile manufacturing analytics#analytics tools
0 notes
Text
Designing Eye-Catching Dashboards in Power BI: Best Practices
In today’s data-driven world, turning raw numbers into meaningful visual insights is more important than ever. Power BI has become one of the leading tools for business intelligence and data visualization, enabling users to create powerful, interactive dashboards. But what makes a Power BI dashboard not just functional—but truly eye-catching?
In this article, we'll explore best practices for designing visually appealing and user-friendly dashboards using Power BI. Whether you're just starting with Power BI training or you're a seasoned pro, these tips will help elevate your data presentation skills.

Why Dashboard Design Matters
A well-designed dashboard improves decision-making by highlighting the right data at the right time. It enhances user experience, reduces cognitive load, and ensures that insights are quickly and clearly understood. Bad design, on the other hand, leads to confusion, missed insights, and ultimately poor decisions.
Best Practices for Designing Eye-Catching Dashboards in Power BI
1. Know Your Audience
Before diving into Power BI, identify who will be using the dashboard. Are they executives, analysts, or operations teams? Different users have different data needs. Tailoring the dashboard content and complexity to your audience is key.
2. Keep It Simple and Clean
Less is more. Avoid clutter by only including essential visuals. Use whitespace effectively to create breathing room between elements. A clean design ensures better readability and quicker insights.
3. Use Consistent Colors and Fonts
Maintain a consistent theme throughout your dashboard. Use your brand colors or predefined color palettes. Stick to 1–2 font styles and sizes for uniformity. This enhances professionalism and visual harmony.
4. Choose the Right Visuals
Bar charts, pie charts, line graphs, cards, maps—Power BI offers a range of visuals. Choose the one that best represents your data. Avoid fancy visuals just for aesthetics; ensure they serve a purpose.
5. Leverage Filters and Slicers
Interactive slicers allow users to slice and dice the data based on specific criteria. Filters improve usability and make the dashboard dynamic and personalized.
6. Highlight Key Metrics
Use KPIs and cards to draw attention to critical values. Place these visuals prominently so decision-makers can quickly scan the dashboard and identify performance indicators.
7. Use Tooltips and Drill-Throughs
Tooltips provide additional context without cluttering your visuals. Drill-throughs allow users to click on visuals and view detailed reports—offering both high-level overviews and deep dives.
8. Test on Multiple Devices
Power BI dashboards can be accessed on desktops, tablets, and mobile devices. Always test your design on various screen sizes to ensure responsiveness and usability.
Bonus Tip: Stay Updated with Power BI Training
Power BI is continuously evolving. Staying updated through Power BI training courses will help you explore new features, advanced visuals, and performance tips. Continuous learning is essential to remain competitive in the field of data analytics and business intelligence.
FAQs
Q1: What is Power BI? Power BI is a Microsoft business analytics tool that provides interactive visualizations and business intelligence capabilities with an interface simple enough for end users to create their own reports and dashboards.
Q2: Who can benefit from Power BI training? Anyone from business analysts to data scientists, marketing professionals to finance managers can benefit. Whether you're a beginner or looking to advance your skills, Power BI has something for everyone.
Q3: Is Power BI suitable for small businesses? Absolutely. Power BI offers scalable solutions for small to large businesses with flexible pricing and robust features.
Q4: How long does it take to learn Power BI? With dedicated Power BI training, most users can become proficient within a few weeks, depending on prior experience and commitment.
Q5: Where can I get expert Power BI training? You can visit our website for structured Power BI training programs designed by industry experts. Our curriculum covers everything from the basics to advanced dashboarding techniques.
Conclusion
Designing eye-catching dashboards in Power BI isn't just about aesthetics—it's about delivering the right insights in the most efficient way. By following these best practices, you’ll create dashboards that not only look great but also empower better business decisions.
Ready to master the art of Power BI? 👉 Visit our website for hands-on Power BI training, tips, and expert support!
#powerbi#dataanalytics#BusinessIntelligence#data#DataInsights#python#DataDrivenDecisions#tableau#DataTools#sql#dashboard#DataReporting#onlinelearning#analytics#courses#dynamics#bi#software#nareshit
0 notes
Text
Tableau Software Course in Noida
Training Basket offers the best Tableau Software Course in Noida. We provide advanced coaching with high-tech infrastructure and well-equipped lab facilities. Our complete Tableau Software Course in Noida includes flexible class options to suit your learning schedule. With expert trainers and hands-on practice, we ensure students gain in-depth knowledge and real-time experience.
0 notes
Text
The Future of Tableau Jobs: Trends and Predictions
Insights from Hachion Trainings
The landscape of data analytics is rapidly evolving, and Tableau remains at the forefront of this transformation. As organizations increasingly rely on data-driven decision-making, the demand for skilled Tableau professionals is soaring. At Hachion Trainings, we’ve identified key trends and predictions shaping the future of Tableau jobs.

Growing Demand for Data Visualization
Data-Driven Culture: Companies are embedding data into their organizational culture. As a result, the need for intuitive data visualization tools like Tableau is growing, driving demand for skilled Tableau developers and analysts.
Complex Data Needs: With the surge in big data and IoT, organizations need professionals who can interpret and present complex data in accessible formats. Tableau’s ability to handle large datasets makes it indispensable.
Emerging Trends in Tableau Careers
Integration with AI and ML: Tableau is integrating with artificial intelligence and machine learning, enabling more sophisticated data analysis and predictive modeling. This integration is creating new roles and opportunities for Tableau professionals skilled in AI and ML.
Cloud Adoption: As more businesses move their data to the cloud, the demand for Tableau professionals proficient in cloud-based solutions like Tableau Online and Tableau Server is increasing.
Real-Time Analytics: The need for real-time data analysis is growing. Tableau's capabilities in real-time analytics are creating a surge in demand for experts who can deliver immediate insights.
Skill Sets in Demand
Advanced Tableau Skills: Expertise in advanced Tableau features such as Tableau Prep, Tableau Public, and Tableau Server is highly sought after.
Data Storytelling: The ability to tell compelling stories with data using Tableau’s visualization tools is becoming crucial. Employers are looking for candidates who can transform raw data into actionable insights.
Interdisciplinary Skills: Professionals who combine Tableau expertise with knowledge in fields like business intelligence, data science, and software development are particularly valuable.
Predictions for the Future
Increased Job Opportunities: The demand for Tableau professionals is expected to grow exponentially as more companies recognize the value of data-driven insights.
Higher Salaries: As demand outstrips supply, salaries for Tableau experts are predicted to rise, making it a lucrative career choice.
Diverse Roles: The future will see a proliferation of diverse roles for Tableau professionals, from data analysts and business intelligence developers to data scientists and AI specialists.
Preparing for the Future with Hachion Trainings
At Hachion Trainings, we are dedicated to preparing you for the future of Tableau jobs. Our comprehensive training programs are designed to equip you with the skills and knowledge needed to excel in the evolving data analytics landscape.
Join Hachion Trainings today and stay ahead of the curve in the dynamic world of Tableau!
1 note
·
View note
Text
Best Power Bi Course at Naresh IT
Unleash the Power of Data with Naresh IT's Power BI Course
In today's data-driven world, the ability to transform raw data into actionable insights is critical. This is where Power BI comes in. By mastering this powerful business intelligence (BI) tool, you can create compelling visualizations, generate informative reports, and gain a deeper understanding of your business.
Naresh IT offers a comprehensive Power BI course designed to equip you with the skills you need to become a data rockstar. Here's what you can expect:
Dive Deep into Power BI:
Go beyond the basics: The course starts with a solid foundation in BI concepts and the role Power BI plays in transforming data.
Unlock the ecosystem: Learn about the entire Power BI landscape, including Power BI Desktop, Power BI Service, and Power BI Mobile.
Become a data wrangling pro: Master data loading, transformation, and manipulation techniques to prepare your data for analysis.
Craft Compelling Visualizations:
Tell a story with data: Learn how to create impactful charts, graphs, and other visuals that effectively communicate insights.
Go beyond the defaults: Explore customization options to tailor your visuals to your specific needs and brand identity.
Engage your audience: Discover best practices for designing clear and concise dashboards that resonate with viewers.
Empower Data Exploration:
Unleash the power of DAX: Learn Data Analysis Expressions (DAX) to write custom formulas and calculations for deeper data exploration.
Ask questions, get answers: Harness the power of Power BI Q&A to gain insights through natural language queries.
Share your findings: Learn how to effectively share reports and dashboards with colleagues and stakeholders.
Real-World Ready:
Project-based learning: Solidify your learnings through real-world project simulations that mimic practical scenarios.
Expert guidance: Benefit from the knowledge and experience of Naresh IT's industry-expert instructors.
Flexible learning options: Choose between live online classes with or without recorded sessions to fit your schedule and learning style.
Investing in Your Future:
A Power BI course at Naresh IT is an investment in your future. This versatile skillset can open doors to exciting career opportunities in data analysis, business intelligence, and other data-driven fields.
Ready to take the plunge? Visit the Naresh IT website to learn more about their Power BI course and transform your data into a powerful asset.
#powerbi#microsoft#businessintelligence#excel#dataanalytics#datascience#data#tableau#datavisualization#sql#dashboard#office#analytics#python#business#dynamics#bi#software#bigdata#digitaltransformation#azure#dataanalysis#powerapps#machinelearning#technology#microsoftpowerbi#cloud#businessanalytics
1 note
·
View note
Text
In this comprehensive exploration, we’ll take a deep dive into the capabilities of Dataiku and Tableau, evaluating their strategies and implications for firms looking to harness the potential of deep learning.
0 notes
Text
Scope of A.I
If you are interested in a career in AI, there are a number of things you can do to prepare. You can start by taking courses in computer science, data science, and machine learning. You can also gain experience by working on AI projects or internships. And finally, you can network with other professionals in the field.The most in demand job profilesin AI are
Robotics Scientist: Robotics scientists are responsible for designing, developing, and testing robots. They use their knowledge of AI, computer science, and engineering to create robots that can perform a variety of tasks, such as manufacturing, healthcare, and transportation.
Big Data Engineer: Big data engineers are responsible for collecting, storing, and processing large datasets. They use their knowledge of data science, cloud computing, and software engineering to build and maintain big data systems.
BI Developer: BI developers are responsible for creating and maintaining business intelligence (BI) solutions. They use their knowledge of data analysis, visualization, and reporting to help businesses make better decisions.
Data Scientist: Data scientists are responsible for collecting, cleaning, and analyzing data. They use their knowledge of statistics, machine learning, and programming to extract insights from data and help businesses make better decisions.
Machine Learning Engineer: Machine learning engineers are responsible for designing, developing, and deploying machine learning models. They use their knowledge of statistics, machine learning, and programming to build models that can learn from data and make predictions. The demand for AI skills is expected to continue to grow in the coming years. As a result, those who are skilled in AI will be in high demand in the workforce. Some of the reputed platforms that offers courses in A.I are Coursera, Udemy, edX, DigiCrome Academy, Next Hikes
If you like my blog, don't forget to subscribe and like.
#artificial intelligence#programming#data scientist#machine learning#data science#mobile app development#software development#web development#my writing#jobs in education#digicrome#nexthikes#engineering#power bi#data analysis#tableau#robotics#robotification#big data analytics#big data management#science#science fiction#science communication#science news#science fantasy#scientists
0 notes
Text
um să ne conectăm datele la Tableau Software pentru vizualizare
Când deschideți Tableau Software, sunteți direcționat către pagina de pornire de unde puteți selecta cu ușurință din registrele de lucru anterioare, exemple de registre de lucru (fișierele Tableau Workbook [twb] sunt tipul principal de fișier creat de Tableau pentru a vă salva întregul registru de lucru.) și sursele de date salvate. De asemenea, ne conectăm la noi surse de date selectând…
0 notes
Text
Why Learn Tableau? Here are 5 powerful reasons to get started with this industry-leading tool

1. Industry-Leading Visualization: Transform raw data into stunning visuals!
2. High Demand in Data Analytics: Tableau skills are highly valued in today’s job market.
3. Actionable Insights in Minutes: Make data-driven decisions faster.
4. User-Friendly Interface: Easy to learn, even for beginners.
5. Boost Your Career: Stand out in data roles and advance your career! Want to take your skills to the next level?
Join our 1-day Tableau Bootcamp on 2nd November (Online)!
#tableau#Learn tableau#Tableau Bootcamp#data analytics#data visualization#software#big data#dataviz#technology#cavillion#cavillion learning#data visualisation#tableau dashboard#tableau software#salesforce#data#tableau community#Tableau Developer#business analytics#businessintelligence
0 notes
Text
#data analysis#data science#analytics tool#data analytics#werqlabs#Tableau#Power BI#business analytics#SAS#Statistical Analysis Software
0 notes
Text
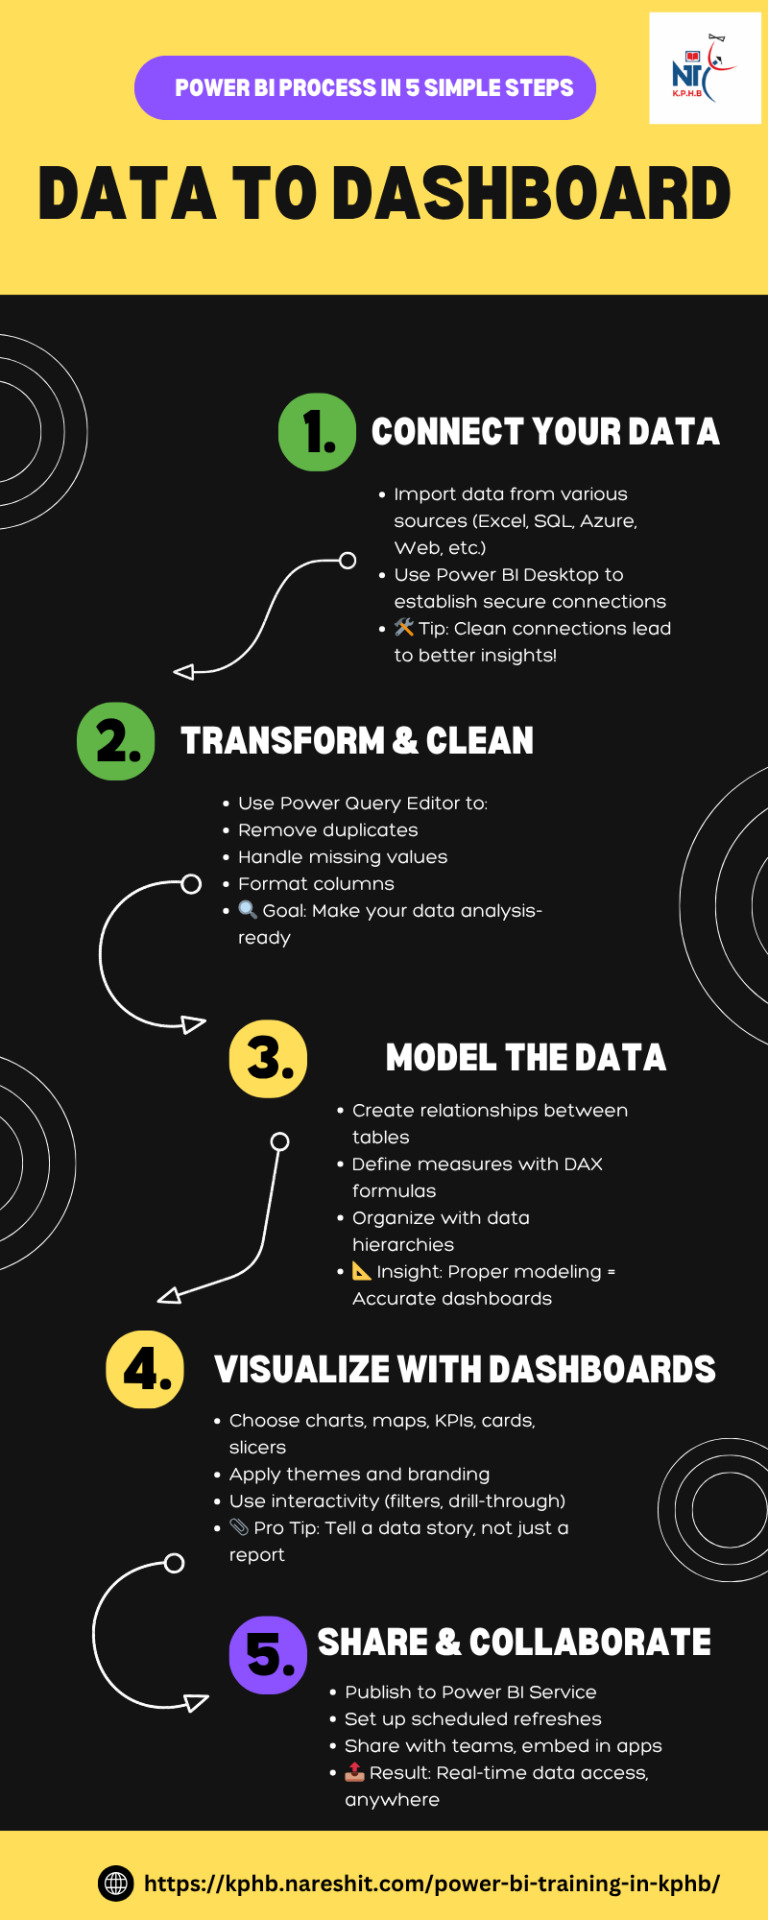
Data to Dashboard: Power BI Process in 5 Simple Steps
#powerbi#dataanalytics#BusinessIntelligence#data#DataInsights#python#DataDrivenDecisions#tableau#DataTools#sql#dashboard#DataReporting#onlinelearning#analytics#courses#dynamics#bi#software#nareshit
0 notes
Text
#learn#free#resource#python#r#postgresql#chatgpt#tableau#power bi#excel#scala#apache spark#shell#git#oracle#programming#software
0 notes
Note
As a fellow poll runner and data lover you should try microsoft power bi and/or tableau my beloved data visualization and cleaning softwares
alright thanks!! ill check those out :) i am a little familiar with tableau but ive never used it
36 notes
·
View notes
Text
Data Analysis: Turning Information into Insight
In nowadays’s digital age, statistics has come to be a vital asset for businesses, researchers, governments, and people alike. However, raw facts on its personal holds little value till it's far interpreted and understood. This is wherein records evaluation comes into play. Data analysis is the systematic manner of inspecting, cleansing, remodeling, and modeling facts with the objective of coming across beneficial information, drawing conclusions, and helping selection-making.
What Is Data Analysis In Research

What is Data Analysis?
At its middle, records analysis includes extracting meaningful insights from datasets. These datasets can variety from small and based spreadsheets to large and unstructured facts lakes. The primary aim is to make sense of data to reply questions, resolve issues, or become aware of traits and styles that are not without delay apparent.
Data evaluation is used in truely every enterprise—from healthcare and finance to marketing and education. It enables groups to make proof-based choices, improve operational efficiency, and advantage aggressive advantages.
Types of Data Analysis
There are several kinds of information evaluation, every serving a completely unique purpose:
1. Descriptive Analysis
Descriptive analysis answers the question: “What happened?” It summarizes raw facts into digestible codecs like averages, probabilities, or counts. For instance, a store might analyze last month’s sales to decide which merchandise achieved satisfactory.
2. Diagnostic Analysis
This form of evaluation explores the reasons behind beyond outcomes. It answers: “Why did it occur?” For example, if a agency sees a surprising drop in internet site visitors, diagnostic evaluation can assist pinpoint whether or not it changed into because of a technical problem, adjustments in search engine marketing rating, or competitor movements.
3. Predictive Analysis
Predictive analysis makes use of historical information to forecast destiny consequences. It solutions: “What is probable to occur?” This includes statistical models and system getting to know algorithms to pick out styles and expect destiny trends, such as customer churn or product demand.
4. Prescriptive Analysis
Prescriptive analysis provides recommendations primarily based on facts. It solutions: “What have to we do?” This is the maximum advanced type of analysis and often combines insights from predictive analysis with optimization and simulation techniques to manual selection-making.
The Data Analysis Process
The technique of information analysis commonly follows those steps:
1. Define the Objective
Before diving into statistics, it’s essential to without a doubt recognize the question or trouble at hand. A well-defined goal guides the entire analysis and ensures that efforts are aligned with the preferred outcome.
2. Collect Data
Data can come from numerous sources which includes databases, surveys, sensors, APIs, or social media. It’s important to make certain that the records is relevant, timely, and of sufficient high-quality.
3. Clean and Prepare Data
Raw information is regularly messy—it may comprise missing values, duplicates, inconsistencies, or mistakes. Data cleansing involves addressing these problems. Preparation may include formatting, normalization, or growing new variables.
Four. Analyze the Data
Tools like Excel, SQL, Python, R, or specialized software consisting of Tableau, Power BI, and SAS are typically used.
5. Interpret Results
Analysis isn't pretty much numbers; it’s about meaning. Interpreting effects involves drawing conclusions, explaining findings, and linking insights lower back to the authentic goal.
6. Communicate Findings
Insights have to be communicated effectively to stakeholders. Visualization tools including charts, graphs, dashboards, and reports play a vital position in telling the story behind the statistics.
7. Make Decisions and Take Action
The last aim of statistics analysis is to tell selections. Whether it’s optimizing a advertising marketing campaign, improving customer support, or refining a product, actionable insights flip data into real-global effects.
Tools and Technologies for Data Analysis
A big selection of gear is available for facts analysis, each suited to distinct tasks and talent levels:
Excel: Great for small datasets and short analysis. Offers capabilities, pivot tables, and charts.
Python: Powerful for complicated facts manipulation and modeling. Popular libraries consist of Pandas, NumPy, Matplotlib, and Scikit-learn.
R: A statistical programming language extensively used for statistical analysis and statistics visualization.
SQL: Essential for querying and handling information saved in relational databases.
Tableau & Power BI: User-friendly enterprise intelligence equipment that flip facts into interactive visualizations and dashboards.
Healthcare: Analyzing affected person statistics to enhance treatment plans, predict outbreaks, and control resources.
Finance: Detecting fraud, coping with threat, and guiding investment techniques.
Retail: Personalizing advertising campaigns, managing inventory, and optimizing pricing.
Sports: Enhancing performance through participant records and game analysis.
Public Policy: Informing choices on schooling, transportation, and financial improvement.
Challenges in Data Analysis
Data Quality: Incomplete, old, or incorrect information can lead to deceptive conclusions.
Data Privacy: Handling sensitive records requires strict adherence to privacy guidelines like GDPR.
Skill Gaps: There's a developing demand for skilled information analysts who can interpret complicated facts sets.
Integration: Combining facts from disparate resources may be technically hard.
Bias and Misinterpretation: Poorly designed analysis can introduce bias or lead to wrong assumptions.
The Future of Data Analysis
As facts keeps to grow exponentially, the sector of facts analysis is evolving rapidly. Emerging developments include:
Artificial Intelligence (AI) & Machine Learning: Automating evaluation and producing predictive fashions at scale.
Real-Time Analytics: Enabling decisions based totally on live data streams for faster reaction.
Data Democratization: Making records handy and understandable to everybody in an business enterprise
2 notes
·
View notes