#Tableau Visualization
Explore tagged Tumblr posts
Visit Tumblr Blog
Explore Tumblr blogs with no restrictions, modern design and the best experience.
Last Seen Tumblr Blogs


Fun Fact
Tumblr has been providing a Korean-language service since 2013.
Text
Industry-Leading Visualization with Tableau Data Visualization

1. User-Friendly Interface: The intuitive design allows anyone to easily start visualizing data.
2. Seamless Integration: Connects easily with various data sources for efficient analysis.
3. Quick Insights: Generate actionable insights within minutes.
4. Integrated Collaboration Tools: Share dashboards and insights with your team effortlessly.
5. Regular Updates: Tableau continuously evolves with new features and improvements.
Want to take your skills to the next level? Join our 1-day Tableau Bootcamp on 2nd November (Online)!
#tableau#tableau software#data visualization#data visualisation#dataviz#software#technology#cavillion#cavillion learning#data analytics#data#tableau online training#tableaudesktop#tableau dashboard#big data#business analytics#data analysis#data science#tableau course#salesforce#Tableau Tutorial#Tableau Visualization#Tableau Training#learn tableau#tableau certification#Tableau Visualisation
1 note
·
View note
Note
will the ao3 stats include other oscar ships? wonder if theres a spike for choscar after yhe adoptiongate
i only scraped the landoscar tag (approx 3400 fics), but i can include both 1) analysis of side ships tagged within the existing dataset and 2) some rudimentary comparisons to other tags in general!!! :')
8 notes
·
View notes
Text

#Finance#Business#Work Meme#Work Humor#Excel#Hilarious#funny meme#funny#accounting#office humor#consulting#big data#data analysis#data visualization#data analytics#data#dashboard commentary#tableau#power bi
13 notes
·
View notes
Text

You still been using outdated design tools to create dashboard mockups? 🥴 OOF. Issokay We've all been there.
Now create hi-fi dashboard wireframes with Mokkup.ai in under 30 mins. Share, comment, export and present your designs to the world! 🌎
#data analytics#dashboard#data#powerbi#tableau#visualization#dashboards#dashboard simulator#datascience#free#freetools
2 notes
·
View notes
Text
How to Analyze Data Effectively – A Complete Step-by-Step Guide
Learn how to analyze data in a structured, insightful way. From data cleaning to visualization, discover tools, techniques, and real-world examples. How to Analyze Data Effectively – A Complete Step-by-Step Guide Data analysis is the cornerstone of decision-making in the modern world. Whether in business, science, healthcare, education, or government, data informs strategies, identifies trends,…
#business intelligence#data analysis#data cleaning#data tools#data visualization#Excel#exploratory analysis#how to analyze data#predictive analysis#Python#Tableau
0 notes
Text
Maximizing Report Creation: A Comparison of Power BI and Tableau Migration
Introduction: The Evolution of Business Intelligence
In the fast-paced business world, data visualization plays a pivotal role in driving strategic decisions. The choice of a business intelligence (BI) tool significantly impacts how organizations analyze and present their data. With technology continuously evolving, staying ahead with cutting-edge BI solutions is crucial for maintaining a competitive edge.
If you are currently using Tableau but are considering a switch to Power BI, you may be wondering whether it’s worth the effort. In this blog, we’ll guide you through the transition process, explore the key advantages of Power BI, and highlight best practices to ensure a smooth migration.
Data Source Connection: New Beginnings vs. Existing Connections
Building from Scratch: In Power BI, starting fresh with report creation means establishing new data connections.
Migration from Tableau: During migration, you connect to the pre-existing data sources that were used in Tableau, ensuring continuity and reducing the need for data reconfiguration.
Rebuilding in Power BI: Replication vs. New Creation
Building from Scratch: Creating reports from scratch allows full customization of visualizations and structure without constraints from existing designs, giving greater creative freedom.
Migration from Tableau: Migration requires replicating Tableau’s reports and visualizations, often involving reverse-engineering the work done in Tableau to rebuild similar dashboards and reports in Power BI.
Read More about Why Move from Tableau to Power BI: Key Benefits Explained
Translating Logic: Adapting Tableau’s Logic to DAX in Power BI
Building from Scratch: When creating reports from scratch, you have the flexibility to design new calculations using Power BI’s DAX language.
Migration from Tableau: One of the most intricate parts of migration is converting Tableau’s calculated fields and logic into Power BI’s DAX language, ensuring that functionality is retained while adapting to Power BI’s unique environment.
Styling and Formatting: Matching the Look vs. Redesigning from Scratch
Building from Scratch: Rebuilding reports in Power BI from scratch allows for more flexibility, offering a fresh, modern design aligned with current brand aesthetics and business needs.
Migration from Tableau: During migration, it’s often necessary to match the style and design of Tableau reports to ensure a consistent user experience.
Migration Challenges: Balancing Consistency and Flexibility
Building from Scratch: Starting fresh presents no challenges in maintaining consistency with previous designs but allows for full creative control.
Migration from Tableau: The migration process is more challenging than building from scratch, as it requires careful attention to replicating Tableau’s functionality and design to ensure the Power BI reports mirror the original in both appearance and performance.
Post-Migration Support: Ensuring a Smooth Transition to Power BI
Once the migration from Tableau to Power BI is complete, providing comprehensive post-migration support is vital to ensuring a smooth transition. This includes offering training sessions, preparing documentation that outlines the differences between Tableau and Power BI, and establishing dedicated channels for users to ask questions or report issues. These efforts will facilitate user adoption and ensure the transition to Power BI is both successful and sustainable.
Know more about Tableau to Power BI: Save Costs & Gain AI-Driven Insights
Key Considerations for Migrating from Tableau to Power BI
Calculated Columns and Measures: Understanding the Differences
Tableau: Tableau’s calculated fields enable users to perform a wide variety of in-platform calculations and dynamic analysis, creating new metrics and applying complex formulas.
Power BI: Power BI uses measures for similar functionality but requires translating Tableau’s logic into Power BI’s DAX language, which might involve some fine-tuning to maintain consistency.
Chart Creation: A Shift from Modularity to Flexibility
Tableau: Tableau uses a modular approach where each chart resides in a separate worksheet. This makes it easier to analyze individual visualizations but requires more effort to manage multiple charts.
Power BI: Power BI allows multiple charts to be placed on a single page for efficient comparison and analysis, offering greater flexibility and ease of comparison within a unified workspace.
Both Power BI and Tableau provide powerful charting capabilities. Power BI’s design allows for dynamic and interconnected visualizations, while Tableau’s modular approach emphasizes individual analysis of specific datasets.
Why Choose Acuvate?
At Acuvate, we help businesses seamlessly transition their BI tools to stay ahead in today’s data-driven world. As a trusted Microsoft partner, we ensure efficiency, security, and governance in analytics modernization.
Try our migration calculator: Seamlessly Transition from Tableau to Power BI with Acuvate
How Acuvate Supports Your Power BI Migration
1. Efficient Migration Strategy
Migrating from Tableau to Power BI can be complex, but Acuvate streamlines the process. Unlike traditional BI firms, we leverage automation and best practices to accelerate migration with minimal disruption.
2. Faster Adoption with Self-Service Analytics
Power BI empowers business users with self-service analytics. Acuvate ensures teams can independently create reports while maintaining data security and governance.
3. Seamless Microsoft Integration
As a Microsoft Solutions Partner, we integrate Power BI with Office 365, Azure, and Dynamics 365 to enhance insights and decision-making.
4. Scalable and Cost-Effective Solutions
We offer flexible managed services for security compliance, data governance, and ongoing support tailored to your business needs.
5. Cutting-Edge BI Technologies
Acuvate stays ahead of BI trends, collaborating closely with Microsoft to bring the latest innovations to our clients.
6. Reliable Support & Maintenance
Beyond migration, we ensure your Power BI environment remains optimized with continuous support and performance tuning.
7. Accelerated Data Transformation
Acuvate enhances Power BI migration with AcuWeave, our advanced Microsoft Fabric accelerator. AcuWeave streamlines data ingestion, transformation, and modeling, ensuring faster insights and seamless integration with your existing BI ecosystem.
Get Started with Acuvate Today
Whether you need a full-scale migration or phased transition, Acuvate is here to guide you. Contact us to leverage Power BI for smarter insights and decision automation.
Conclusion: Unlock the Power of Advanced BI
As businesses strive for smarter analytics and improved decision-making, Power BI emerges as a powerful alternative to Tableau. Its deep integration with Microsoft products, cost efficiency, and user-friendly experience make it an excellent choice for organizations looking to enhance their BI strategy.
With a structured migration approach and best practices in place, transitioning from Tableau to Power BI can be a game-changer for your business. Don’t hesitate to make the switch and unlock new insights to drive your company forward!
Ready to migrate? Reach out to our experts today and take the first step towards an optimized business intelligence experience with Power BI.
#powerbi#automation#tableau#migration#power bi solutions#Data visualization#data modeling#data governance#Migration tool#data transformation
0 notes
Text
#power bi course fees#Power BI#tableau#visualization#best data science courses to get a job#data analytics jobs
0 notes
Text


Tableaux surréalistes
#visual arts#peinture#artgalerie#arts and crafts#dessin#sketch#artists on tumblr#artwork#croquis#art#artiste#surréalisme#tableau#art style#art study
1 note
·
View note
Text
Learn Tableau & Master Data Analytics with Certification
Join a Tableau certification course and master data analytics with expert-led training. Learn powerful data visualization techniques to enhance your skills and grow your career in data science and business intelligence.
#data visualization training#data visualization certification#tableau certification course#tableau desktop course#master data analytics courses
0 notes
Text
Benchmarking data on historical data
Hi! In this blog post we will be discussing how we can create a new calculated field based on historical data. Here on the sheet, there are some local filters that means the data is narrowed down so the traditional approach of table calculations using Window_sum function will NOT work. We will need to use LOD (Level of Detail) expressions, they have an advantage that they are calculated before…
#ai#analytics#BI#businessintelligence#consulting#data#dataanalytics#datascience#dataservices#engineering#tableau#tableaudeveloper#visualization
0 notes
Text
Data Visualizations on Tableau Public
The necessity for conveying data visually in our modern, data-centric landscape cannot be overstated. Effective data visualization enhances understanding and fuels decision-making in diverse domains. Within the plethora of data visualization software, Tableau Public distinguishes itself as a premier choice. Having been introduced in 2009, Tableau Public has gained the participation of over 5…

View On WordPress
0 notes
Text
Why Data Analytics is the Skill of the Future (And How to Get Ahead)
In today's fast-paced digital landscape, the ability to analyse and interpret data is more important than ever. With the globe collecting data at an unprecedented rate, industries are turning to data analytics to drive decisions, enhance efficiency, and gain a competitive advantage. As a result, data analytics is rapidly becoming one of the most valued skills in almost every industry, and individuals who understand it are well-positioned for a prosperous career.
The Increasing Demand for Data Analytics
Data analytics is more than just a buzzword; it's a fast expanding field that is impacting industries around the world. According to the U.S. Bureau of Labour Statistics, demand for data science and analytics experts is predicted to increase by 35% between 2021 and 2031, greatly above the average for all occupations. This rapid expansion emphasizes the importance of data analytics as a vital business function, with organizations relying on data to make informed decisions and optimize operations.
Data-driven tactics are being adopted in a variety of industries, including healthcare, finance, marketing, and ecommerce. Companies seek experienced people who can use data to foresee trends, analyze customer behavior, streamline operations, and improve overall decision-making. As a result, data analytics specialists are in high demand, and mastering this ability can lead to a wide range of opportunities in this competitive area.
Why Data Analytics is Important for Future Careers
Developing data analytics abilities is one of the most effective strategies for students and professionals to future-proof their careers. As businesses increasingly rely on data-driven insights, people who can comprehend and analyze data are well-positioned for long-term success.
Data analytics is a broad field that applies to almost every sector. Understanding data is essential for anyone who wants to work in corporate planning, marketing, finance, or healthcare. The capacity to analyze and interpret massive data sets enables professionals to make better decisions, discover hidden possibilities, and deliver actionable insights. Businesses will increasingly prioritize data-driven strategies, making data analytics experts invaluable assets.
How to Advance in Data Analytics: Enroll in Offline Courses
To succeed in this competitive sector, hands-on experience is required. While there are several online courses accessible, offline learning provides the benefits of personalized instruction, engaging learning environments, and direct access to knowledgeable professors. CACMS Institute in Amritsar offers offline data analytics courses that educate students with the practical skills and knowledge required to succeed in this rapidly expanding sector.
CACMS Institute provides expert advice in a classroom setting where you may ask real-time questions, work on actual projects, and engage with peers on data-driven challenges. The curriculum is intended to emphasize the fundamentals of data analytics, covering important tools such as Python, SQL, Power BI, Tableau, and Excel. These tools are vital for anyone interested in pursuing a career in data analytics since they allow experts to manage, visualize, and analyze data efficiently.
Future-Proof Your Career with CACMS Institute
CACMS Institute provides an organized, offline learning environment that teaches more than just theory; it also teaches hands-on, practical skills. CACMS' courses focus on practical data analytics applications, ensuring that students not only learn the tools and techniques but also understand how to apply them in real-world corporate contexts.
If you want to advance in the field of data analytics, there's never been a better opportunity to participate in an offline course at CACMS Institute. The combination of professional instructors, a well crafted curriculum, and an engaging classroom atmosphere will prepare you for success in tomorrow's data-driven world.
Take the first step towards safeguarding your future now! Contact CACMS Institute at +91 8288040281 or visit cacms.in for more information and to enrol in our data analytics courses in Amritsar.
#cacms institute#techskills#techeducation#data analytics course in Amritsar#data analytics course#Data Analytics Training#Data Analytics Skills#data analytics certification#python course in Amritsar#Python Training in Amritsar#SQL Course in Amritsar#Tableau Course in Amritsar#data visualization#Learn With CACMS
0 notes
Text
Why Learn Tableau? Here are 5 powerful reasons to get started with this industry-leading tool

1. Industry-Leading Visualization: Transform raw data into stunning visuals!
2. High Demand in Data Analytics: Tableau skills are highly valued in today’s job market.
3. Actionable Insights in Minutes: Make data-driven decisions faster.
4. User-Friendly Interface: Easy to learn, even for beginners.
5. Boost Your Career: Stand out in data roles and advance your career! Want to take your skills to the next level?
Join our 1-day Tableau Bootcamp on 2nd November (Online)!
#tableau#Learn tableau#Tableau Bootcamp#data analytics#data visualization#software#big data#dataviz#technology#cavillion#cavillion learning#data visualisation#tableau dashboard#tableau software#salesforce#data#tableau community#Tableau Developer#business analytics#businessintelligence
0 notes
Text
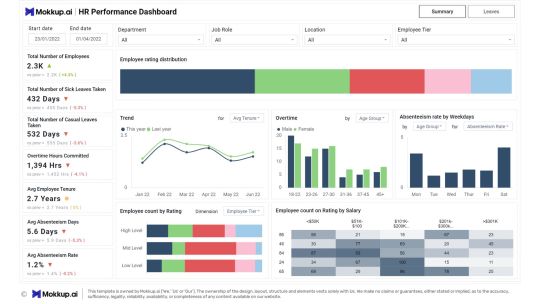
HR Performance dashboard done in under 30 mins on Mokkup.ai.
#dashboard simulator#dashboard#dashboards#data#visualization#datascience#data analytics#powerbi#tableau#hr#recruitment
1 note
·
View note
Text
Tableau Desktop
Tableau Desktop is a collection of data management tools available for desktops, servers, and mobile platforms. By simply dragging and dropping data into its sleek, user-friendly interface, you can analyze it through automatically generated metrics or delve deeper to manually explore and organize the data using the program’s full range of features. Tableau avoids overwhelming users with…
#Analytics Tool#Business Analytics#Business Intelligence#Data Analysis#Data Insights#Data Management#Data Visualization#Drag-and-Drop#Real-Time Analysis#Tableau
0 notes