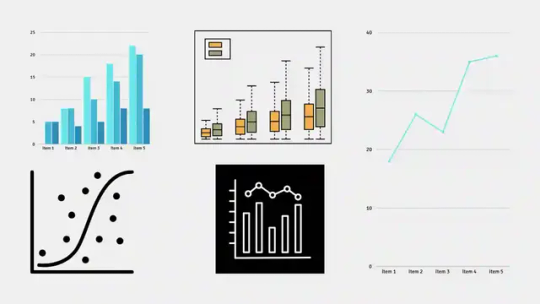
#data visualization python
Explore tagged Tumblr posts
Visit Tumblr Blog
Explore Tumblr blogs with no restrictions, modern design and the best experience.
Last Seen Tumblr Blogs


Fun Fact
25% of US internet users with an annual income of $80-100K use Tumblr.
Text
What is Pandas in Python?
Introduction What is Pandas? What does the name “Pandas” stand for? Why use Pandas? Getting Started with Pandas Installing Pandas Creating your first DataFrame Exploring and manipulating data in DataFrames Key Features of Pandas Data Structures Data Manipulation and Analysis Visualization Conclusion Summary of key benefits Why Pandas is essential for Python data science FAQs What is…
View On WordPress
0 notes
Text
Coursera - Data Analysis and Interpretation Specialization
I have chosen Mars Craters for my research dataset! Research question: How Do Crater Size and Depth Influence Ejecta Morphology in Mars Crater Data?
Topic 2: How Do Crater Size and Depth Influence Ejecta Morphology and the Number of Ejecta Layers in Martian Impact Craters?
Abstract of the study:
Ejecta morphology offers a window into the impact processes and surface properties of planetary bodies. This study leverages a high-resolution Mars crater dataset comprising over 44,000 entries among 380k entries with classified ejecta morphologies, focusing on how crater diameter and depth influence ejecta type. Crater size and rim-to-floor depth are examined whether they serve as reliable predictors of ejecta morphology complexity. Using statistical methods, we assess the relationship between crater dimensions and the occurrence of specific ejecta morphologies and number of layers.
Research Papers Referred:
Nadine G. Barlow., "Martian impact crater ejecta morphologies as indicators of the distribution of subsurface volatiles"
R. H. Hoover1 , S. J. Robbins , N. E. Putzig, J. D. Riggs, and B. M. Hynek. "Insight Into Formation Processes of Layered Ejecta Craters onMars From Thermophysical Observations"
2 notes
·
View notes
Text
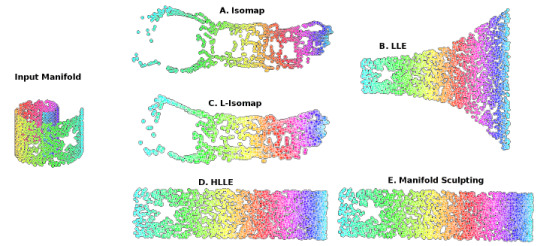
Locally Linear Embedding (LLE) approaches
#gradschool#light academia#data visualization#science#math#mathblr#studybrl#machine learning#ai#python#topology
46 notes
·
View notes
Text

CORRECTED: Causes of Death In Infants.
My apologies. The previous "Causes" plot had the data reversed. Here is the correct plot.
4 notes
·
View notes
Text
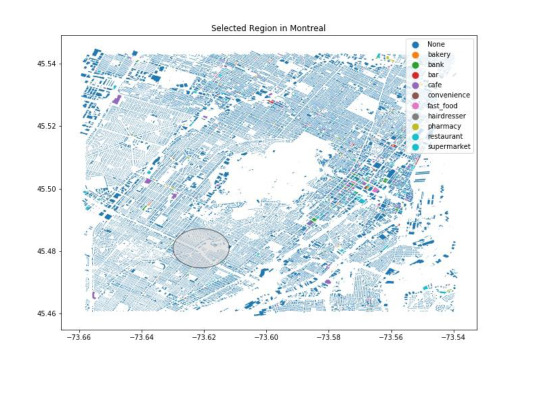
Example map of my python script that calculates the total area of each place category that falls within a user-specified region.
This script takes a radius (in meters) and geographic coordinates (in decimal degrees) that are specified by the user as inputs and produces a .csv file of each place category with its corresponding area and a map showing the area of interest.
2 notes
·
View notes
Text
Exploring Data Science Tools: My Adventures with Python, R, and More
Welcome to my data science journey! In this blog post, I'm excited to take you on a captivating adventure through the world of data science tools. We'll explore the significance of choosing the right tools and how they've shaped my path in this thrilling field.
Choosing the right tools in data science is akin to a chef selecting the finest ingredients for a culinary masterpiece. Each tool has its unique flavor and purpose, and understanding their nuances is key to becoming a proficient data scientist.
I. The Quest for the Right Tool
My journey began with confusion and curiosity. The world of data science tools was vast and intimidating. I questioned which programming language would be my trusted companion on this expedition. The importance of selecting the right tool soon became evident.
I embarked on a research quest, delving deep into the features and capabilities of various tools. Python and R emerged as the frontrunners, each with its strengths and applications. These two contenders became the focus of my data science adventures.
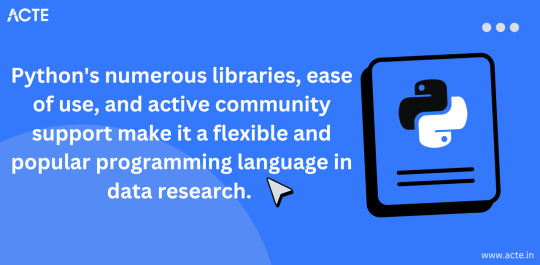
II. Python: The Swiss Army Knife of Data Science
Python, often hailed as the Swiss Army Knife of data science, stood out for its versatility and widespread popularity. Its extensive library ecosystem, including NumPy for numerical computing, pandas for data manipulation, and Matplotlib for data visualization, made it a compelling choice.
My first experiences with Python were both thrilling and challenging. I dove into coding, faced syntax errors, and wrestled with data structures. But with each obstacle, I discovered new capabilities and expanded my skill set.
III. R: The Statistical Powerhouse
In the world of statistics, R shines as a powerhouse. Its statistical packages like dplyr for data manipulation and ggplot2 for data visualization are renowned for their efficacy. As I ventured into R, I found myself immersed in a world of statistical analysis and data exploration.
My journey with R included memorable encounters with data sets, where I unearthed hidden insights and crafted beautiful visualizations. The statistical prowess of R truly left an indelible mark on my data science adventure.
IV. Beyond Python and R: Exploring Specialized Tools
While Python and R were my primary companions, I couldn't resist exploring specialized tools and programming languages that catered to specific niches in data science. These tools offered unique features and advantages that added depth to my skill set.
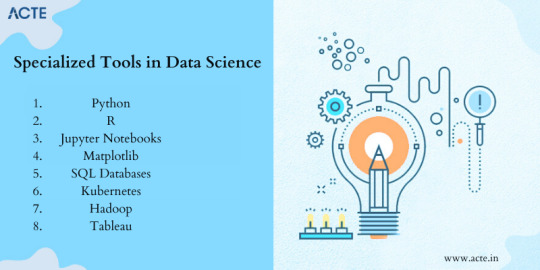
For instance, tools like SQL allowed me to delve into database management and querying, while Scala opened doors to big data analytics. Each tool found its place in my toolkit, serving as a valuable asset in different scenarios.
V. The Learning Curve: Challenges and Rewards
The path I took wasn't without its share of difficulties. Learning Python, R, and specialized tools presented a steep learning curve. Debugging code, grasping complex algorithms, and troubleshooting errors were all part of the process.
However, these challenges brought about incredible rewards. With persistence and dedication, I overcame obstacles, gained a profound understanding of data science, and felt a growing sense of achievement and empowerment.
VI. Leveraging Python and R Together
One of the most exciting revelations in my journey was discovering the synergy between Python and R. These two languages, once considered competitors, complemented each other beautifully.
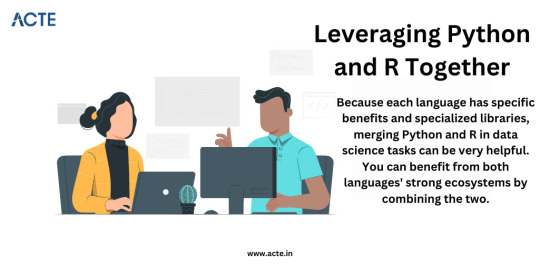
I began integrating Python and R seamlessly into my data science workflow. Python's data manipulation capabilities combined with R's statistical prowess proved to be a winning combination. Together, they enabled me to tackle diverse data science tasks effectively.
VII. Tips for Beginners
For fellow data science enthusiasts beginning their own journeys, I offer some valuable tips:
Embrace curiosity and stay open to learning.
Work on practical projects while engaging in frequent coding practice.
Explore data science courses and resources to enhance your skills.
Seek guidance from mentors and engage with the data science community.
Remember that the journey is continuous—there's always more to learn and discover.
My adventures with Python, R, and various data science tools have been transformative. I've learned that choosing the right tool for the job is crucial, but versatility and adaptability are equally important traits for a data scientist.
As I summarize my expedition, I emphasize the significance of selecting tools that align with your project requirements and objectives. Each tool has a unique role to play, and mastering them unlocks endless possibilities in the world of data science.
I encourage you to embark on your own tool exploration journey in data science. Embrace the challenges, relish the rewards, and remember that the adventure is ongoing. May your path in data science be as exhilarating and fulfilling as mine has been.
Happy data exploring!
22 notes
·
View notes
Note
How's it going learning python? I needed to learn the very, very basics last year and it was fun, but at the same time so difficult to understand and remember all the codes, especially functions and all the stuff for diagrams like matplotlib etc. Hope it's going well for you :)
Listen bestie I'm at a print("Hello, World!") and add # before comments stage :D learned how to define structures and print(type(x)). I'm a baby.
But overall, I think it will be fun to use! If I manage to do anything :D because I have a shit ton to do on top of all that (full time work, writing an introduction to an article, making a med student a material for his cell bio microscope slides, and making an hour long lecture abt my thesis for school kids :D it's all due next week :D)
But overall I think I will be okay, because complicated things don't scare me as much as they used to. And besides I won't have to remember everything by heart. If it's me and stackoverflow against python let it be, I've been there with R.
And I'm actually very scared of matplotlib bc it was an extra credit task we had to perform on a hpc cluster and I had no idea how to do it (the rest of the code was given to us ready except the extra credit tasks). It was the end of the lesson so I just. Left.
3 notes
·
View notes
Text
Get Free News API to scrape news articles

NewsData.io offered a free news API that developers could use to access news articles and headlines from various sources. This API provided endpoints for fetching news articles, headlines, and other related data. Get a Free News API Key in 3 steps:
Visit NewsData.io website
Create an account on it
Get Free API Keys from dashboard
#api#news api#python#marketing#software engineering#programming#data science#google news api#data visualization
2 notes
·
View notes
Text
Understanding IHD with Data Science
Ischemic Heart Disease (IHD), more commonly recognized as coronary artery disease, is a profound health concern that stems from a decreased blood supply to the heart. Such a decrease is typically due to fatty deposits or plaques narrowing the coronary arteries. These arteries, as vital conduits delivering oxygen-rich blood to the heart, play a paramount role in ensuring the heart's efficient functioning. An obstruction or reduced flow within these arteries can usher in adverse outcomes, with heart attacks being the most dire. Given the gravity of IHD, the global medical community emphasizes the essence of early detection and prompt intervention to manage its repercussions effectively.
A New Age in Healthcare: Embracing Data Science
As we stand on the cusp of the fourth industrial revolution, technology's intertwining with every domain is evident. The healthcare sector is no exception. The integration of data science in healthcare is not merely an augmentation; it's a paradigm shift. Data science, with its vast array of tools and methodologies, is fostering new avenues to understand, diagnose, and even predict various health conditions long before they manifest pronounced symptoms.
Machine Learning: The Vanguard of Modern Medical Research
Among the myriad of tools under the vast umbrella of data science, Machine Learning (ML) shines exceptionally bright. An essential offshoot of artificial intelligence, ML capitalizes on algorithms and statistical models, granting computers the capability to process vast amounts of data and discern patterns without being explicitly programmed.
In the healthcare realm, the applications of ML are manifold. From predicting potential disease outbreaks based on global health data trends to optimizing patient flow in bustling hospitals, ML is progressively becoming a linchpin in medical operations. One of its most lauded applications, however, is its prowess in early disease prediction, and IHD detection stands as a testament to this.
Drawn to the immense potential ML holds, I ventured into a research project aimed at harnessing the RandomForestClassifier model's capabilities. Within the medical research sphere, this model is celebrated for its robustness and adaptability, making it a prime choice for my endeavor.
Deep Dive into the Findings
The results from the ML model were heartening. With an accuracy rate of 90%, the model’s prowess in discerning the presence of IHD based on an array of parameters was evident. Such a high accuracy rate is pivotal, considering the stakes at hand – the very health of a human heart. 9 times out of 10 the model is correct at its predictions.
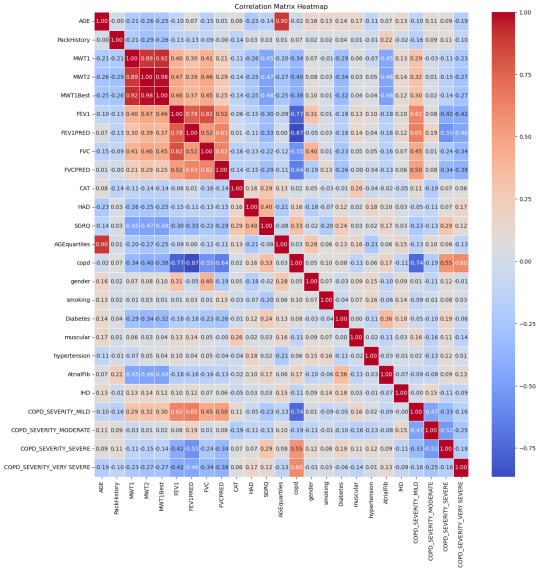
Breaking down the data, some correlations with IHD stood out prominently:
Moderate COPD (Chronic Obstructive Pulmonary Disease) – 15%: COPD's inclusion is noteworthy. While primarily a lung condition, its linkage with heart health has been a topic of numerous studies. A compromised respiratory system can inadvertently strain the heart, underscoring the interconnectedness of our bodily systems.
Diabetes – 18%: The correlation between diabetes and heart health isn't novel. Elevated blood sugar levels over extended periods can damage blood vessels, including the coronary arteries.
Age (segmented in quarterlies) – 15%: Age, as an immutable factor, plays a significant role. With age, several bodily systems gradually wear down, rendering individuals more susceptible to a plethora of conditions, IHD included.
Smoking habits – 14%: The deleterious effects of smoking on lung health are well-documented. However, its impact extends to the cardiovascular system, with nicotine and other chemicals adversely affecting heart functions.
MWT1 and MWT2 (indicators of physical endurance) – 13% and 14% respectively: Physical endurance and heart health share an intimate bond. These metrics, gauging one's physical stamina, can be precursors to potential heart-related anomalies.
Redefining Patient Care in the Machine Learning Era
Armed with these insights, healthcare can transcend its conventional boundaries. A deeper understanding of IHD's contributors empowers medical professionals to devise comprehensive care strategies that are both preventive and curative.
Moreover, the revelations from this study underscore the potential for proactive medical interventions. Instead of being reactive, waiting for symptoms to manifest, healthcare providers can now adopt a preventive stance. Patients exhibiting the highlighted risk factors can be placed under more meticulous observation, ensuring that potential IHD developments are nipped in the bud.
With the infusion of machine learning, healthcare is on the cusp of a personalized revolution. Gone are the days of one-size-fits-all medical approaches. Recognizing the uniqueness of each patient's health profile, machine learning models like the one employed in this study can pave the way for hyper-personalized care regimens.
As machine learning continues to entrench itself in healthcare, a future where disease predictions are accurate, interventions are timely, and patient care is unparalleled isn't merely a vision; it's an impending reality.
#heart disease#ihd#ischemic heart disease#programming#programmer#python#python programming#machine learning#data analysis#data science#data visualization#aicommunity#ai#artificial intelligence#medical research#medical technology
3 notes
·
View notes
Text
[2024 Spring] Data Science Essentials - Python Visualization Libraries: Matplotlib
Data Visualization is the link that connects science to its audience. Learn with us how to best present your data! In this session … source
0 notes
Text

Learn to leverage Python, R, SQL, machine learning, statistics, data visualization (Tableau/Power BI), and big data platforms—through real-world projects that build your portfolio. Data science combines statistics, computing, and domain expertise to derive meaningful insights from complex datasets. With organizations across finance, healthcare, e-commerce, and manufacturing embracing AI, AutoML, NLP, and scalable analytics, demand for hands‑on data scientists continues to grow . Enroll now to master cutting-edge tools, explore real datasets, and steer impactful, data-driven innovation in one of today’s most dynamic tech domains.
#data science#python for data science#machine learning#data visualization#big data#ai data science#predictive analytics#statistics for data science#r for data science#data science programs
0 notes
Text
UI/UX Design Mastery Course in Madurai – Elevate Your Design Skills
The UI/UX Design Mastery Course in Madurai is an ideal program for aspiring designers and tech enthusiasts eager to break into the world of user interface and user experience design. Tailored for beginners as well as professionals looking to enhance their skills, this course offers a perfect blend of theoretical knowledge and hands-on experience.
Participants will learn the fundamentals of design thinking, user research, wireframing, prototyping, and usability testing. The curriculum also covers industry-leading tools like Figma, Adobe XD, and Sketch, ensuring learners gain practical expertise. The course emphasizes real-world projects and case studies to help students build an impressive design portfolio.
Guided by experienced mentors and industry experts, students receive personalized feedback and career guidance throughout the program. Whether you aim to work with top tech companies, start your freelance design journey, or build your own product, this course equips you with the skills to deliver intuitive and engaging digital experiences.
Located in Madurai, this program offers in-person and hybrid learning options, making it accessible and flexible for learners from different backgrounds. With a focus on creativity, innovation, and user-centric design, the UI/UX Design Mastery Course is your gateway to a rewarding career in the dynamic field of digital design.
Enroll today to unlock the power of design and transform your ideas into user-friendly interfaces that make a lasting impact.
#Software Courses: Software Courses#Animation Courses#IT Training#Data science and Data Analytics#Full stack development#Software Testing#C#C++#Java#Dotnet#Python#Networking and Cloud#Web development. Animation Courses: Graphic Designing#UI UX Design#2D & 3D Animation#Game Designing#Visual Effects#Digital Marketing.
0 notes
Text
How to Analyze Data Effectively – A Complete Step-by-Step Guide
Learn how to analyze data in a structured, insightful way. From data cleaning to visualization, discover tools, techniques, and real-world examples. How to Analyze Data Effectively – A Complete Step-by-Step Guide Data analysis is the cornerstone of decision-making in the modern world. Whether in business, science, healthcare, education, or government, data informs strategies, identifies trends,…
#business intelligence#data analysis#data cleaning#data tools#data visualization#Excel#exploratory analysis#how to analyze data#predictive analysis#Python#Tableau
0 notes
Text
Your Data Career Starts Here: DICS Institute in Laxmi Nagar

In a world driven by data, those who can interpret it hold the power. From predicting market trends to driving smarter business decisions, data analysts are shaping the future. If you’re looking to ride the data wave and build a high-demand career, your journey begins with choosing the Best Data Analytics Institute in Laxmi Nagar.
Why Data Analytics? Why Now?
Companies across the globe are investing heavily in data analytics to stay competitive. This boom has opened up exciting opportunities for data professionals with the right skills. But success in this field depends on one critical decision — where you learn. And that’s where Laxmi Nagar, Delhi’s thriving educational hub, comes into play.
Discover Excellence at the Best Data Analytics Institute in Laxmi Nagar
When it comes to learning data analytics, you need more than just lectures — you need an experience. The Best Data Analytics Institute in Laxmi Nagar offers exactly that, combining practical training with industry insights to ensure you’re not just learning, but evolving.
Here’s what makes it a top choice for aspiring analysts:
Real-World Curriculum: Learn the tools and technologies actually used in the industry — Python, SQL, Power BI, Excel, Tableau, and more — with modules designed to match current job market needs.
Project-Based Learning: The institute doesn’t just teach concepts — it puts them into practice. You’ll work on live projects, business case studies, and analytics problems that mimic real-life scenarios.
Expert Mentors: Get trained by data professionals with years of hands-on experience. Their mentorship gives you an insider’s edge and prepares you to tackle interviews and workplace challenges with confidence.
Smart Class Formats: Whether you’re a student, jobseeker, or working professional, the flexible batch options — including weekend and online classes — ensure you don’t miss a beat.
Career Support That Works: From resume crafting and portfolio building to mock interviews and job referrals, the placement team works closely with students until they land their dream role.
Enroll in the Best Data Analytics Course in Laxmi Nagar
The Best Data Analytics Course in Laxmi Nagar goes beyond the basics. It’s a complete roadmap for mastering data — right from data collection and cleaning, to analysis, visualization, and even predictive modeling.
This course is ideal for beginners, professionals looking to upskill, or anyone ready for a career switch. You’ll gain hands-on expertise, problem-solving skills, and a strong foundation that puts you ahead of the curve.
Your Data Career Starts Here
The future belongs to those who understand data. With the Best Data Analytics Institute in Laxmi Nagar and the Best Data Analytics Course in Laxmi Nagar, you’re not just preparing for a job — you’re investing in a thriving, future-proof career.
Ready to become a data expert? Enroll today and take the first step toward transforming your future — one dataset at a time.
#Data Analytics#Data Science#Business Intelligence#Machine Learning#Data Visualization#Python for Data Analysis#SQL Training#Power BI
0 notes
Text


Top 10 Countries Providing Foreign Aid (ranked by % CNI)
0 notes
Text
The Skills I Acquired on My Path to Becoming a Data Scientist
Data science has emerged as one of the most sought-after fields in recent years, and my journey into this exciting discipline has been nothing short of transformative. As someone with a deep curiosity for extracting insights from data, I was naturally drawn to the world of data science. In this blog post, I will share the skills I acquired on my path to becoming a data scientist, highlighting the importance of a diverse skill set in this field.
The Foundation — Mathematics and Statistics
At the core of data science lies a strong foundation in mathematics and statistics. Concepts such as probability, linear algebra, and statistical inference form the building blocks of data analysis and modeling. Understanding these principles is crucial for making informed decisions and drawing meaningful conclusions from data. Throughout my learning journey, I immersed myself in these mathematical concepts, applying them to real-world problems and honing my analytical skills.
Programming Proficiency
Proficiency in programming languages like Python or R is indispensable for a data scientist. These languages provide the tools and frameworks necessary for data manipulation, analysis, and modeling. I embarked on a journey to learn these languages, starting with the basics and gradually advancing to more complex concepts. Writing efficient and elegant code became second nature to me, enabling me to tackle large datasets and build sophisticated models.
Data Handling and Preprocessing
Working with real-world data is often messy and requires careful handling and preprocessing. This involves techniques such as data cleaning, transformation, and feature engineering. I gained valuable experience in navigating the intricacies of data preprocessing, learning how to deal with missing values, outliers, and inconsistent data formats. These skills allowed me to extract valuable insights from raw data and lay the groundwork for subsequent analysis.
Data Visualization and Communication
Data visualization plays a pivotal role in conveying insights to stakeholders and decision-makers. I realized the power of effective visualizations in telling compelling stories and making complex information accessible. I explored various tools and libraries, such as Matplotlib and Tableau, to create visually appealing and informative visualizations. Sharing these visualizations with others enhanced my ability to communicate data-driven insights effectively.

Machine Learning and Predictive Modeling
Machine learning is a cornerstone of data science, enabling us to build predictive models and make data-driven predictions. I delved into the realm of supervised and unsupervised learning, exploring algorithms such as linear regression, decision trees, and clustering techniques. Through hands-on projects, I gained practical experience in building models, fine-tuning their parameters, and evaluating their performance.
Database Management and SQL
Data science often involves working with large datasets stored in databases. Understanding database management and SQL (Structured Query Language) is essential for extracting valuable information from these repositories. I embarked on a journey to learn SQL, mastering the art of querying databases, joining tables, and aggregating data. These skills allowed me to harness the power of databases and efficiently retrieve the data required for analysis.

Domain Knowledge and Specialization
While technical skills are crucial, domain knowledge adds a unique dimension to data science projects. By specializing in specific industries or domains, data scientists can better understand the context and nuances of the problems they are solving. I explored various domains and acquired specialized knowledge, whether it be healthcare, finance, or marketing. This expertise complemented my technical skills, enabling me to provide insights that were not only data-driven but also tailored to the specific industry.
Soft Skills — Communication and Problem-Solving
In addition to technical skills, soft skills play a vital role in the success of a data scientist. Effective communication allows us to articulate complex ideas and findings to non-technical stakeholders, bridging the gap between data science and business. Problem-solving skills help us navigate challenges and find innovative solutions in a rapidly evolving field. Throughout my journey, I honed these skills, collaborating with teams, presenting findings, and adapting my approach to different audiences.
Continuous Learning and Adaptation
Data science is a field that is constantly evolving, with new tools, technologies, and trends emerging regularly. To stay at the forefront of this ever-changing landscape, continuous learning is essential. I dedicated myself to staying updated by following industry blogs, attending conferences, and participating in courses. This commitment to lifelong learning allowed me to adapt to new challenges, acquire new skills, and remain competitive in the field.
In conclusion, the journey to becoming a data scientist is an exciting and dynamic one, requiring a diverse set of skills. From mathematics and programming to data handling and communication, each skill plays a crucial role in unlocking the potential of data. Aspiring data scientists should embrace this multidimensional nature of the field and embark on their own learning journey. If you want to learn more about Data science, I highly recommend that you contact ACTE Technologies because they offer Data Science courses and job placement opportunities. Experienced teachers can help you learn better. You can find these services both online and offline. Take things step by step and consider enrolling in a course if you’re interested. By acquiring these skills and continuously adapting to new developments, they can make a meaningful impact in the world of data science.
#data science#data visualization#education#information#technology#machine learning#database#sql#predictive analytics#r programming#python#big data#statistics
15 notes
·
View notes