#datascience analysis
Explore tagged Tumblr posts
Visit Tumblr Blog
Explore Tumblr blogs with no restrictions, modern design and the best experience.
Last Seen Tumblr Blogs


Fun Fact
Tumblr was attacked by a cross-site scripting worm deployed by the Internet troll group GNAA on Dec 3, 2012.
Text

Hey everyone! enjoying my (two) week break of uni, so I've been lazy and playing games. Today, working on Python, I'm just doing repetition of learning the basics; Variables, Data types, Logic statements, etc. Hope everyone has a good week!
#codeblr#coding#python#university#uni life#studying#datascience#data analytics#data analysis#studyblr#student life#study motivation#study blog#student
78 notes
·
View notes
Text
Cardinal-O-Mat Data Science
Soooo I wanted to learn something data sciency. And I stumbled over David Kriesel's Wahl-O-Mat analyses and wanted to do the same but different. I, like you maybe, have stumbled over the cardinal-o-mat. Logical conclusion: Let's do data science without mama (I'm so sorry!) but with the cardinal-o-mat! (Of course, I also have done this with the Wahl-O-Mat.)
The Cluster Heatmap
Here we have a cluster heatmap. (Isn't she pretty? Actually not so much, there's a lot of grey there...)

On the right side, you can see the names of the cardinals, and on the bottom, you can see the names of the theses. (I was too lazy to make them look pretty.) Red means disagree, blue means agree (for colorblindness reasons). Grey means either that the cardinal was explicitly neutral to the question or that there was simply no data on his position regarding the thesis in the cardinal-o-mat.
The theses are as follows (in order of appearance in the cardinal-o-mat):
I'll spare you and not list all the cardinals' names.
female_deacons: Women should be admitted to the diaconate.
same_sex: Same-sex couples should continue to be allowed to receive blessings outside of liturgical celebrations.
celibacy: Priestly celibacy should become voluntary.
vetus_ordo: The celebration of the Old Latin Mass should remain restricted for the sake of church unity.
vatican_china: The secret agreement between the Vatican and the People's Republic of China on the appointment of bishops should be upheld.
synodal_church: The Catholic Church should be a synodal church in which more emphasis is placed on participation, inclusion and joint decision-making.
climate_change: The Catholic Church should get involved in climate protection because it is committed to God's creation and the protection of the most vulnerable.
humanae_vitae: The Catholic Church should reconsider its position on contraception.
communion_unmarried: Divorced and remarried persons should be admitted to communion in individual cases.
german_synode: The German Synodal Way, aiming at reforming the doctrine of faith and morals, should be regarded positively overall.
covid: Church closures and vaccination recommendations during the Covid-19 pandemic were right.
islam: Interfaith dialogue with Islam is important.
What do we see here?
Roughly speaking, the closer two cardinals or two theses are shown in the map, the more similar they are, and the further apart in the map, the more dissimilar. Because of this closeness of similar cardinals/theses, we get these blocks of blue and red (kinda. I mean, it could be much worse.).
I want to emphasize that I did not sort this by hand. Rather it was sorted by an algorithm with respect to a certain metric (here the Jaccard metric), which measures the "distance" between the cardinals and theses. The method used is (divisive) hierarchical clustering. At each step, a cluster is divided into two subsets such that their distance is maximized. You can see these steps in the lines on the top and left side. This is called a dendrogram.
What do we learn from this?
Damn good question! The amount of things to learn is somewhat limited, if we look at the amount of neutrals and non-opinions, also considering I did not seperate those two.
Since this is a non-serious setting, I think we can reasonably infer that a cardinal that has spoken in favor of a couple of the theses is also generally more open to those he has not voiced an opinion on, and similarly for the conservative ones. If you look at it like this, then it becomes quite clear that the blue, so the generally more open minded cardinals are in the majority. I would have loved to have a cardinal-o-mat for the previous conclave, because I have the hypothesis that there, the conservative cardinals might have had the majority and I would love to test this.
Something I find funny is that one of the theses that is most liked is the synodal_church one, which is about participation and joint decision making. One of the least liked ones is the german_synode one (only one agreement, thx Marx my homie), which tries to do exactly the participation and joint decision making.
I don't know what else we learn from this, I just think that a cluster heatmap is a neat way of visualising the positions of the cardinals wrt to the theses and since it is somewhat sorted, we learn something about their relation with each other.
If you can explain to me why there is this red block in the left bottom corner, please do! I thought it might have something to do with the metric I used but the map always looks similar or worse.
Also, maybe someone can explain to me which metric to use when.
#cardinal-o-mat#cardinalomat#kardinalomat#kardinal-o-mat#conclave#konklave#does this qualify as fanart? probably not. but as i was inspired by conclave (2024) maybe it qualifies as#fan work#data science#datascience#data analysis#conclave 2024#conclave (2024)#conclave 2025#conclave (2025)#python#programming
10 notes
·
View notes
Text

#tua#the umbrella academy#klaus hargreeves#luthor hargreeves#diego hargreeves#allison hargreeves#five hargreeves#ben hargreeves#viktor hargreeves#victor hargreeves#pogo hargreeves#grace hargreeves#reginald hargreeves#statistic#statistics#datascience#data analytics#data analysis#data
21 notes
·
View notes
Text
biologists and other data people
keep the whimsy in your life and change the font in your Rstudio
your soul may be getting drained because R but look!
ITS THE MINECRAFT FONT
i die a bot less when i look at my R because of the minecraft font
8 notes
·
View notes
Text
Understanding Outliers in Machine Learning and Data Science

In machine learning and data science, an outlier is like a misfit in a dataset. It's a data point that stands out significantly from the rest of the data. Sometimes, these outliers are errors, while other times, they reveal something truly interesting about the data. Either way, handling outliers is a crucial step in the data preprocessing stage. If left unchecked, they can skew your analysis and even mess up your machine learning models.
In this article, we will dive into:
1. What outliers are and why they matter.
2. How to detect and remove outliers using the Interquartile Range (IQR) method.
3. Using the Z-score method for outlier detection and removal.
4. How the Percentile Method and Winsorization techniques can help handle outliers.
This guide will explain each method in simple terms with Python code examples so that even beginners can follow along.
1. What Are Outliers?
An outlier is a data point that lies far outside the range of most other values in your dataset. For example, in a list of incomes, most people might earn between $30,000 and $70,000, but someone earning $5,000,000 would be an outlier.
Why Are Outliers Important?
Outliers can be problematic or insightful:
Problematic Outliers: Errors in data entry, sensor faults, or sampling issues.
Insightful Outliers: They might indicate fraud, unusual trends, or new patterns.
Types of Outliers
1. Univariate Outliers: These are extreme values in a single variable.
Example: A temperature of 300°F in a dataset about room temperatures.
2. Multivariate Outliers: These involve unusual combinations of values in multiple variables.
Example: A person with an unusually high income but a very low age.
3. Contextual Outliers: These depend on the context.
Example: A high temperature in winter might be an outlier, but not in summer.
2. Outlier Detection and Removal Using the IQR Method
The Interquartile Range (IQR) method is one of the simplest ways to detect outliers. It works by identifying the middle 50% of your data and marking anything that falls far outside this range as an outlier.
Steps:
1. Calculate the 25th percentile (Q1) and 75th percentile (Q3) of your data.
2. Compute the IQR:
{IQR} = Q3 - Q1
Q1 - 1.5 \times \text{IQR}
Q3 + 1.5 \times \text{IQR} ] 4. Anything below the lower bound or above the upper bound is an outlier.
Python Example:
import pandas as pd
# Sample dataset
data = {'Values': [12, 14, 18, 22, 25, 28, 32, 95, 100]}
df = pd.DataFrame(data)
# Calculate Q1, Q3, and IQR
Q1 = df['Values'].quantile(0.25)
Q3 = df['Values'].quantile(0.75)
IQR = Q3 - Q1
# Define the bounds
lower_bound = Q1 - 1.5 * IQR
upper_bound = Q3 + 1.5 * IQR
# Identify and remove outliers
outliers = df[(df['Values'] < lower_bound) | (df['Values'] > upper_bound)]
print("Outliers:\n", outliers)
filtered_data = df[(df['Values'] >= lower_bound) & (df['Values'] <= upper_bound)]
print("Filtered Data:\n", filtered_data)
Key Points:
The IQR method is great for univariate datasets.
It works well when the data isn’t skewed or heavily distributed.
3. Outlier Detection and Removal Using the Z-Score Method
The Z-score method measures how far a data point is from the mean, in terms of standard deviations. If a Z-score is greater than a certain threshold (commonly 3 or -3), it is considered an outlier.
Formula:
Z = \frac{(X - \mu)}{\sigma}
is the data point,
is the mean of the dataset,
is the standard deviation.
Python Example:
import numpy as np
# Sample dataset
data = {'Values': [12, 14, 18, 22, 25, 28, 32, 95, 100]}
df = pd.DataFrame(data)
# Calculate mean and standard deviation
mean = df['Values'].mean()
std_dev = df['Values'].std()
# Compute Z-scores
df['Z-Score'] = (df['Values'] - mean) / std_dev
# Identify and remove outliers
threshold = 3
outliers = df[(df['Z-Score'] > threshold) | (df['Z-Score'] < -threshold)]
print("Outliers:\n", outliers)
filtered_data = df[(df['Z-Score'] <= threshold) & (df['Z-Score'] >= -threshold)]
print("Filtered Data:\n", filtered_data)
Key Points:
The Z-score method assumes the data follows a normal distribution.
It may not work well with skewed datasets.
4. Outlier Detection Using the Percentile Method and Winsorization
Percentile Method:
In the percentile method, we define a lower percentile (e.g., 1st percentile) and an upper percentile (e.g., 99th percentile). Any value outside this range is treated as an outlier.
Winsorization:
Winsorization is a technique where outliers are not removed but replaced with the nearest acceptable value.
Python Example:
from scipy.stats.mstats import winsorize
import numpy as np
Sample data
data = [12, 14, 18, 22, 25, 28, 32, 95, 100]
Calculate percentiles
lower_percentile = np.percentile(data, 1)
upper_percentile = np.percentile(data, 99)
Identify outliers
outliers = [x for x in data if x < lower_percentile or x > upper_percentile]
print("Outliers:", outliers)
# Apply Winsorization
winsorized_data = winsorize(data, limits=[0.01, 0.01])
print("Winsorized Data:", list(winsorized_data))
Key Points:
Percentile and Winsorization methods are useful for skewed data.
Winsorization is preferred when data integrity must be preserved.
Final Thoughts
Outliers can be tricky, but understanding how to detect and handle them is a key skill in machine learning and data science. Whether you use the IQR method, Z-score, or Wins
orization, always tailor your approach to the specific dataset you’re working with.
By mastering these techniques, you’ll be able to clean your data effectively and improve the accuracy of your models.
#science#skills#programming#bigdata#books#machinelearning#artificial intelligence#python#machine learning#data centers#outliers#big data#data analysis#data analytics#data scientist#database#datascience#data
4 notes
·
View notes
Text
How Dr. Imad Syed Transformed PiLog Group into a Digital Transformation Leader?
The digital age demands leaders who don’t just adapt but drive transformation. One such visionary is Dr. Imad Syed, who recently shared his incredible journey and PiLog Group’s path to success in an exclusive interview on Times Now.
In this inspiring conversation, Dr. Syed reflects on the milestones, challenges, and innovative strategies that have positioned PiLog Group as a global leader in data management and digital transformation.
The Journey of a Visionary:
From humble beginnings to spearheading PiLog’s global expansion, Dr. Syed’s story is a testament to resilience and innovation. His leadership has not only redefined PiLog but has also influenced industries worldwide, especially in domains like data governance, SaaS solutions, and AI-driven analytics.
PiLog’s Success: A Benchmark in Digital Transformation:
Under Dr. Syed’s guidance, PiLog has become synonymous with pioneering Lean Data Governance SaaS solutions. Their focus on data integrity and process automation has helped businesses achieve operational excellence. PiLog’s services are trusted by industries such as oil and gas, manufacturing, energy, utilities & nuclear and many more.
Key Insights from the Interview:
In the interview, Dr. Syed touches upon:
The importance of data governance in digital transformation.
How PiLog’s solutions empower organizations to streamline operations.
His philosophy of continuous learning and innovation.
A Must-Watch for Industry Leaders:
If you’re a business leader or tech enthusiast, this interview is packed with actionable insights that can transform your understanding of digital innovation.
👉 Watch the full interview here:
youtube
The Global Impact of PiLog Group:
PiLog’s success story resonates globally, serving clients across Africa, the USA, EU, Gulf countries, and beyond. Their ability to adapt and innovate makes them a case study in leveraging digital transformation for competitive advantage.
Join the Conversation:
What’s your take on the future of data governance and digital transformation? Share your thoughts and experiences in the comments below.
#datamanagement#data governance#data analysis#data analytics#data scientist#big data#dataengineering#dataprivacy#data centers#datadriven#data#businesssolutions#techinnovation#businessgrowth#businessautomation#digital transformation#piloggroup#drimadsyed#timesnowinterview#datascience#artificialintelligence#bigdata#datadrivendecisions#Youtube
3 notes
·
View notes
Text
SQL Server deadlocks are a common phenomenon, particularly in multi-user environments where concurrency is essential. Let's Explore:
https://madesimplemssql.com/deadlocks-in-sql-server/
Please follow on FB: https://www.facebook.com/profile.php?id=100091338502392

#technews#microsoft#sqlite#sqlserver#database#sql#tumblr milestone#vpn#powerbi#data#madesimplemssql#datascience#data scientist#datascraping#data analytics#dataanalytics#data analysis#dataannotation#dataanalystcourseinbangalore#data analyst training#microsoft azure
5 notes
·
View notes
Text
Free R Programming Course – Learn Data Skills and Earn a Certificate! 🚀
Free R Programming Course – Learn Data Skills and Earn a Certificate!
Are you looking to dive into data science or add a powerful programming language to your skill set? This Free R Programming Course is exactly what you need! 🖥️📊
Here’s what’s included:
7 hours of self-paced video lessons
A Completion Certificate for your resume and LinkedIn
90 days of access to all course content
Whether you’re a beginner or just wanting to boost your data skills, this course covers it all—from foundational concepts to data handling, visualization, and more.
👉 Ready to get started?
Free R Programming Course with Certificate | Start Now

#rprogramming#datascience#learntocode#free course#data analysis#programming#futureready#certification course#dataanalytics#codingcommunity
3 notes
·
View notes
Text

Unlock your potential in programming with the exceptional Python Course in Delhi, offered by Brillica Services. This Python Programming Course in Delhi is designed for both beginners and experienced programmers, ensuring top-notch Python Coaching in Delhi. Whether you aim to launch a career in software development, enhance your skills, or explore specialized areas like data science and web development, our course is the perfect starting point.
Our Python Course in Delhi emphasizes practical, hands-on learning. At Brillica Services, we believe in learning by doing. Our Python Classes in Delhi revolve around real-world projects and case studies, allowing you to apply theoretical knowledge to practical scenarios. Guided by industry experts, our Python Training Institute in Delhi ensures you gain valuable insights and skills that are highly regarded in the job market.
2 notes
·
View notes
Text
Harnessing the Power of Data and AI for Digital Transformation

In the rapidly evolving landscape of technology, the synergy of data and artificial intelligence (AI) is revolutionizing businesses across various industries. Digital transformation with Data AI is not just a buzzword; it's a strategic imperative for organizations aiming to stay competitive and innovative.
The Journey of Digital Transformation
Digital transformation begins with a robust data strategy. Companies like Prolifics emphasize the importance of managing, analyzing, and uncovering value from enterprise data. A well-defined data strategy ensures that data is not just collected but also effectively utilized to drive business outcomes. For instance, a banking client of Prolifics realized continuous value by leveraging advanced analytics to enhance their decision-making processes.
Unleashing the Potential of Data Analytics and AI
Data analytics and AI play a pivotal role in transforming raw data into actionable insights. Prolifics' expertise in data validation, modeling, and visualization enables businesses to predict future trends, optimize operations, and uncover transformative patterns. Consider the case of an insurance provider that strengthened its data analytics capabilities, leading to improved claims processing and customer satisfaction.
AI for Data Analytics
Artificial intelligence for business is a game-changer, especially when integrated with data analytics. AI algorithms can process vast amounts of data at unprecedented speeds, providing deeper insights and more accurate predictions. This capability is crucial for businesses looking to innovate and stay ahead of the curve. For example, a gaming company reduced its reporting time from days to minutes by adopting AI-driven data analytics solutions.
Ensuring Seamless Database Migration
Database migration is a critical component of digital transformation. Migrating to modern data platforms allows businesses to take advantage of advanced analytics and AI capabilities. Prolifics offers comprehensive data and AI services that ensure smooth transitions, minimizing disruptions and maximizing data integrity. This process involves meticulous planning and execution, ensuring that the migrated data is secure, consistent, and readily accessible.
The Comprehensive Approach: Data and AI Services
Prolifics' data and AI services encompass a wide range of solutions, including data governance, data privacy, master data management (MDM), and data hubs. These services are designed to ensure that data is accurate, secure, and readily available to drive business insights and innovation. Effective data governance, for instance, not only improves data quality but also enhances decision-making and operational efficiency.
Stories of Success
The true impact of data and AI is best illustrated through success stories. A notable example is a gaming company that leveraged Prolifics' data and AI services to drastically reduce its reporting time. By implementing advanced analytics and AI solutions, the company was able to streamline its operations and make faster, data-driven decisions.
In conclusion, digital transformation with Data AI is a powerful enabler for businesses seeking to thrive in the digital age. By harnessing the potential of data analytics and AI, organizations can unlock new opportunities, enhance their operations, and stay ahead of the competition. Prolifics' expertise in data and AI services offers a roadmap for businesses to navigate this transformative journey successfully.
For more information on how data and AI can transform your business, visit Prolifics.
#digitaltransformation#digitalengineering#data & analytics#data analytics#data analysis#datascience#data
2 notes
·
View notes
Text

The boss who collects all kind of personal data from his customers without their knowledge while claiming to "protect" privacy wants you to leave your private Apple devices at home.
#privacy#invasion of privacy#datascience#data analytics#data analysis#data#apple#boycott apple#boycott elon musk#anti elon musk#fuck elon musk#fuck elongated muskrat#ausgov#politas#auspol#tasgov#taspol#australia#fuck neoliberals#neoliberal capitalism#anthony albanese#albanese government#class war#personal data#law#morals#ethics#boss#eat the rich#eat the fucking rich
3 notes
·
View notes
Text
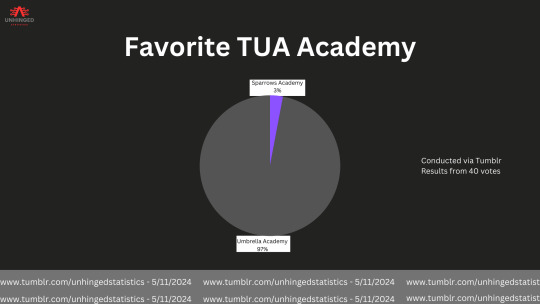
#the umbrella academy#umbrella acedmy#sparrows academy#tua#statistics#statistic#data analytics#datascience#data#data analysis
13 notes
·
View notes
Text
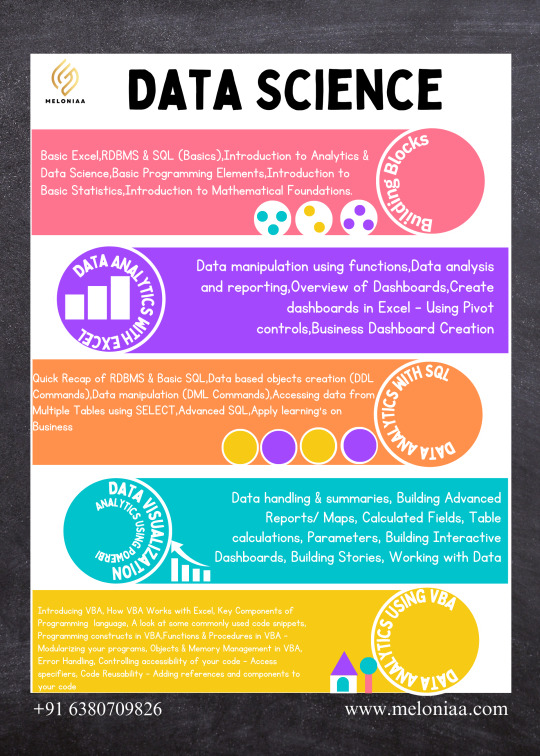
🚀 Ready to become a Data Science pro? Join our comprehensive Data Science Course and unlock the power of data! 📊💡
🔍 Learn: Excel PowerBi Python & R Machine Learning Data Visualization Real-world Projects
👨🏫 Taught by industry experts 💼 Career support & networking
3 notes
·
View notes
Text
Data science is a multidisciplinary field that uses scientific methods, processes, algorithms, and systems to extract insights and knowledge from structured and unstructured data. It combines elements of statistics, mathematics, computer science, and domain-specific expertise to uncover patterns, trends, and valuable information.
Data science is widely used across industries such as finance, healthcare, marketing, and technology, driving innovation, improving decision-making, and solving complex problems. As technology advances, the importance of data science continues to grow, shaping the way organizations leverage data for strategic and operational purposes.
#datascience#artificial intelligence#data analysis#data analytics#machine learning#datadrivendecisions#smartchoices
5 notes
·
View notes
Text
What is a PGP in Data Science? A Complete Guide for Beginners

Businesses in the data-driven world of today mostly depend on insights from vast amounts of data. From predicting customer behavior to optimizing supply chains, data science plays a vital role in decision-making processes across industries. As the demand for skilled data scientists continues to grow, many aspiring professionals are turning to specialized programs like the PGP in Data Science to build a strong foundation and excel in this field.
If you’re curious about what a Post Graduate Program in Data Science entails and how it can benefit your career, this comprehensive guide is for you.
What is Data Science?
Data science is a multidisciplinary field that uses statistical methods, machine learning, data analysis, and computer science to extract insights from structured and unstructured data. It is used to solve real-world problems by uncovering patterns and making predictions.
The role of a data scientist is to collect, clean, analyze, and interpret large datasets to support strategic decision-making. With the growth of big data, cloud computing, and AI technologies, data science has become a highly lucrative and in-demand career path.
What is a PGP in Data Science?
A PGP in Data Science (Post Graduate Program in Data Science) is a comprehensive program designed to equip learners with both theoretical knowledge and practical skills in data science, analytics, machine learning, and related technologies. Unlike traditional degree programs, PGPs are typically more industry-focused, tailored for working professionals or graduates who want to quickly upskill or transition into the field of data science.
These programs are often offered by reputed universities, tech institutions, and online education platforms, with durations ranging from 6 months to 2 years.
Why Choose a Post Graduate Program in Data Science?
Here are some key reasons why a Post Graduate Program in Data Science is worth considering:
High Demand for Data Scientists
Data is the new oil, and businesses need professionals who can make sense of it. According to various industry reports, there is a massive talent gap in the data science field, and a PGP can help bridge this gap.
Industry-Relevant Curriculum
Unlike traditional degree programs, a PGP focuses on the tools, techniques, and real-world applications currently used in the industry.
Fast-Track Career Transition
PGP programs are structured to deliver maximum value in a shorter time frame, making them ideal for professionals looking to switch to data science.
Global Career Opportunities
Data scientists are in demand not just in India but globally. Completing a PGP in Data Science makes you a competitive candidate worldwide.
Key Components of a Post Graduate Program in Data Science
Most PGP in Data Science programs cover the following key areas:
Statistics and Probability
Python and R Programming
Data Wrangling and Visualization
Machine Learning Algorithms
Deep Learning & Neural Networks
Natural Language Processing (NLP)
Big Data Technologies (Hadoop, Spark)
SQL and NoSQL Databases
Business Analytics
Capstone Projects
Some programs include soft skills training, resume building, and interview preparation sessions to boost job readiness.
Who Should Enroll in a PGP in Data Science?
A Post Graduate Program in Data Science is suitable for:
Fresh graduates looking to enter the field of data science
IT professionals aiming to upgrade their skills
Engineers, mathematicians, and statisticians transitioning to data roles
Business analysts who want to learn data-driven decision-making
Professionals from non-technical backgrounds looking to switch careers
Whether you are a beginner or have prior knowledge, a PGP can provide the right blend of theory and hands-on learning.
Skills You Will Learn
By the end of a PGP in Data Science, you will gain expertise in:
Programming languages: Python, R
Data preprocessing and cleaning
Exploratory data analysis
Model building and evaluation
Machine learning algorithms like Linear Regression, Decision Trees, Random Forests, SVM, etc.
Deep learning frameworks like TensorFlow and Keras
SQL for data querying
Data visualization tools like Tableau or Power BI
Real-world business problem-solving
These skills make you job-ready and help you handle real-time projects with confidence.
Curriculum Overview
Here’s a general breakdown of a Post Graduate Program in Data Science curriculum:
Module 1: Introduction to Data Science
Fundamentals of data science
Tools and technologies overview
Module 2: Programming Essentials
Python programming
R programming basics
Jupyter Notebooks and IDEs
Module 3: Statistics & Probability
Descriptive and inferential statistics
Hypothesis testing
Probability distributions
Module 4: Data Manipulation and Visualization
Pandas, NumPy
Matplotlib, Seaborn
Data storytelling
Module 5: Machine Learning
Supervised and unsupervised learning
Model training and tuning
Scikit-learn
Module 6: Deep Learning and AI
Neural networks
Convolutional Neural Networks (CNN)
Recurrent Neural Networks (RNN)
Module 7: Big Data Technologies
Introduction to Hadoop ecosystem
Apache Spark
Real-time data processing
Module 8: Projects & Capstone
Industry case studies
Group projects
Capstone project on end-to-end ML pipeline
Duration and Mode of Delivery
Most PGP in Data Science programs are designed to be completed in 6 to 12 months, depending on the institution and the pace of learning (part-time or full-time). Delivery modes include:
Online (Self-paced or Instructor-led)
Hybrid (Online + Offline workshops)
Classroom-based (Less common today)
Online formats are highly popular due to flexibility, recorded sessions, and access to mentors and peer groups.
Admission Requirements
Admission criteria for a Post Graduate Program in Data Science generally include:
A bachelor’s degree (any discipline)
Basic understanding of mathematics and statistics
Programming knowledge (optional, but beneficial)
An exam or interview may be required by some institutions.
Why a Post Graduate Program in Data Science from Career Amend?
Career Amend offers a comprehensive Post Graduate Program (PGP) in Data Science designed to be completed in just one year, making it an ideal choice for professionals and graduates who wish to enter the field of data science without spending multiple years in formal education. This program has been thoughtfully curated to combine foundational theory with hands-on practical learning, ensuring that students not only understand the core principles. Still, it can also apply them to real-world data challenges.
The one-year structure of Career Amend’s PGP in Data Science is intensive yet flexible, catering to both full-time learners and working professionals. The curriculum spans various topics, including statistics, Python programming, data visualization, machine learning, deep learning, and big data tools. Learners are also introduced to key technologies and platforms like SQL, Tableau, TensorFlow, and cloud services like AWS or Azure. This practical approach helps students gain industry-relevant skills that are immediately applicable.
What sets Career Amend apart is its strong focus on industry integration. The course includes live projects, case studies, and mentorship from experienced data scientists. Learners gain exposure to real-time business problems and data sets through these components, making them job-ready upon completion. The capstone project at the end of the program allows students to showcase their comprehensive knowledge by solving a complex, practical problem, an asset they can add to their portfolios.
Additionally, Career Amend offers dedicated career support services, including resume building, mock interviews, and job placement assistance. Whether a student is looking to switch careers or upskill within their current role, this one-year PGP in Data Science opens doors to numerous high-growth roles such as data scientist, machine learning engineer, data analyst, and more.
Final Thoughts
A PGP in Data Science is an excellent option for anyone looking to enter the field of data science without committing to a full-time degree. It combines the depth of a traditional postgraduate degree with the flexibility and industry alignment of modern learning methods. Whether a recent graduate or a mid-level professional, enrolling in a Post Graduate Program in Data Science can provide the competitive edge you need in today's tech-driven job market.
So, suppose you're asking yourself, "Is a PGP in Data Science worth it?". In that case, the answer is a YES, especially if you are serious about building a career in one of the most dynamic and high-paying domains of the future.
#PGP in Data Science#Post Graduate Program in Data Science#data science#machine learning#data analysis#data analytics#datascience
1 note
·
View note
Text
1-Week Web Design Internship
Web Design Limited is offering a 1-week internship for interested students in web design.
📅 Duration: 1 Week 🎯 Who Can Apply: Students interested in web design
📧 Email: [email protected] 📞 Call for more details: 8675719099 / 7373899599
#python course in chathiram bus stand#best python course in trichy#python course in trichy#education#python with datascience#software testing#technology#data analysis#trichy#student
0 notes