#geo-spatial
Explore tagged Tumblr posts
Visit Tumblr Blog
Explore Tumblr blogs with no restrictions, modern design and the best experience.
Last Seen Tumblr Blogs


Fun Fact
Hackers stole 65M passwords from Tumblr in 2013.
Text
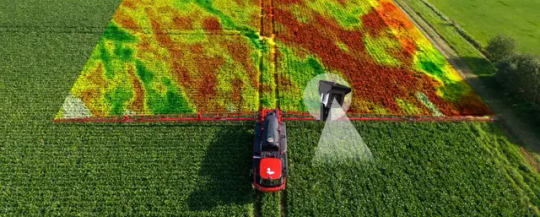
AFR Satellite from APRIL
This stunning AFR satellite image showcases the diverse landscape of Al Kibrit, Egypt. Natural color composite image is overlaid with NDVI (Normalized Difference Vegetation Index) and NDWI (Normalized Difference Water Index) masks. The image reveals a captivating story of vegetation health, water bodies, and potential flooding.
The vibrant green hues of the NDVI highlight the lush vegetation, particularly the circular or semi-circular patterns indicative of central pivot irrigation systems. Meanwhile, the deep blue shades of the NDWI reveal the expanse of the Great Bitter Lake and other water bodies, potentially indicating areas affected by flooding.
By combining NDVI and NDWI, we gain a deeper understanding of the region's agricultural practices, water resources, and vulnerability to flooding. This analysis can be used to assess vegetation health, monitor water quality, and support sustainable land management.
Stay tuned for more breathtaking informative images from across the globe every week!
For more information contact us : https://www.april.azista.space/
#afr satellite#satellite image analytics#ABA First Runner#Earth Observation Satellite#satellite test system#geo spatial#water resources#space exploration#space teschnology#space industry#aerospace industries
0 notes
Note
first i want to say that i appreciate you. second i want to say that i loved your star trek analysis posts, and that i love all your analyses. third i wanted to ask what was it you took in school? i remember something about cultural theory or sociology?
thank you so much! my background is in human geography and sociology. human geography is a very expansive field and you can basically do whatever you want as long as it’s tied to like spatial analysis/spatial theory. it works well for me because sociology and human geo blend together well, as a lot of their statistical analysis involves using large scale national & international datasets (census data, tax records, election data, federal polls, UN datasets, etc)
16 notes
·
View notes
Text
ENTRY NO.2 To my greatest delight, I've been flown out to my favourite destination for my next assignment; Crimea. Working with GISCO* gives one such benefits as paid travel. I've heard the European Commission has recently been looking to consolidate their archived material of Eastern Europe, alongside the standard, procedural updating of geo-spatial information, hence, my current assignment. Given my recent dedication, I've been designated the data-processing of national administrative boundaries (archived and present). While the workload is daunting, I'm incredibly excited. Of the many places I've visited — inside the EU for work, and outside, for research and leisure — The Crimean Peninsula is most preferable, alongside, likely, Spain and Turkie.
2 notes
·
View notes
Text
GIS In Our Daily Lives
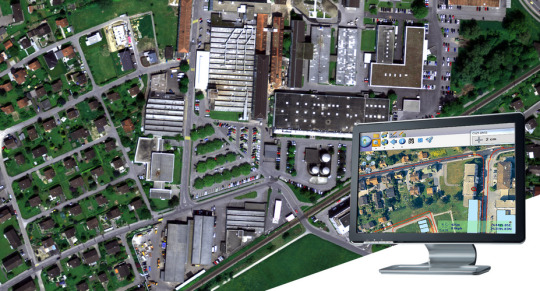
The involvement of Geographic Information Systems (GIS) in our daily lives is pervasive, influencing and enhancing various aspects across different sectors. The integration of GIS into everyday activities has become integral for decision-making, planning, and optimizing resources. GIS helps city planners and transportation experts to provide them with information like maps, satellite pictures, population statistics, and infrastructure data. GIS helps them make better decisions when designing cities and transportation systems that are sustainable and good for the environment.
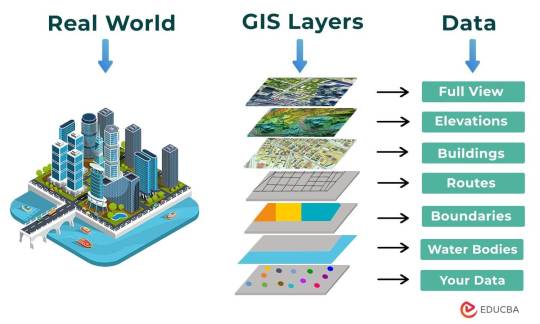
The following points elucidate the notable involvement of GIS in our daily lives:
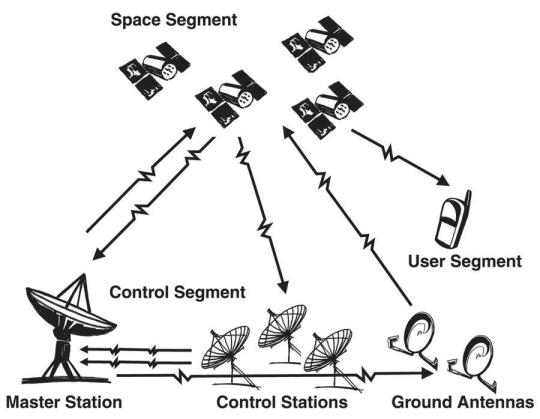
Navigation and Location Services: GIS provides monitoring functions through the visual display of spatial data and precise geographical positioning of monitored vehicles, whereas GPS provides accurate, clear, and precise information on the position and navigation of a monitored or tracked vehicle in real-time and at the exact location.GIS is at the core of navigation applications and location-based services on smartphones. It enables accurate mapping, real-time navigation, and geolocation services, assisting individuals in finding locations, planning routes, and navigating unfamiliar areas.
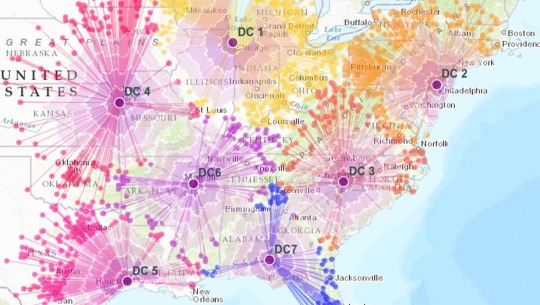
E-Commerce and Delivery Services: GIS software is a powerful tool for supply chain network planning. It helps determine the optimal location for distribution centers, warehouses, or other supply facilities. GIS is utilized in logistics and delivery services for optimizing routes, tracking shipments, and ensuring timely deliveries. E-commerce platforms leverage GIS to enhance the efficiency of their supply chain and last-mile delivery processes.
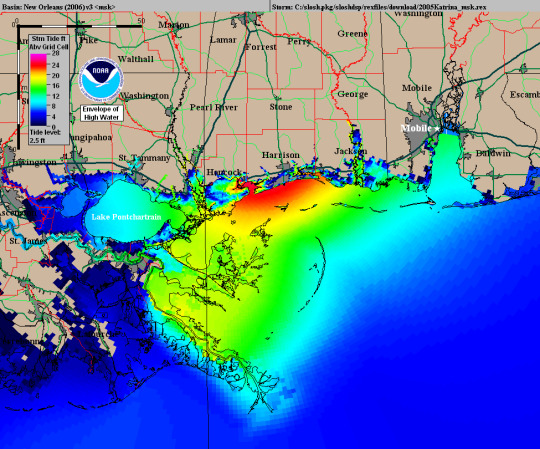
Weather Forecasting and Disaster Management: Many states are using GIS dashboard to monitor the rainfall across the state, on a real-time basis, from the data shared by rain sensors installed at various locationsGIS plays a crucial role in weather forecasting and disaster management. It assists meteorologists in analyzing spatial data, predicting weather patterns, and facilitating timely responses to natural disasters by mapping affected areas and coordinating emergency services.
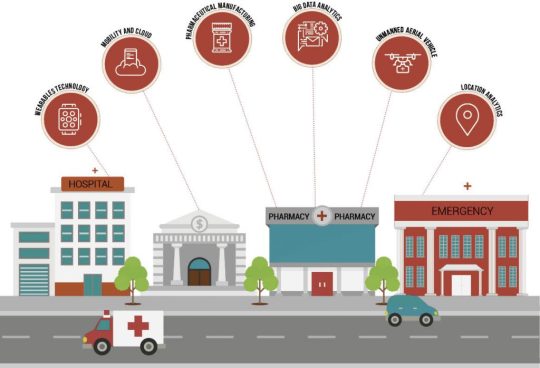
Healthcare Planning and Disease Monitoring: Geographic Information Systems enable the visualization and monitoring of infectious diseases. Additionally GIS records and displays the necessary information that health care needs of the community as well as the available resources and materials. GIS supports public health initiatives by mapping the spread of diseases, analyzing healthcare resource distribution, and assisting in the planning of vaccination campaigns. It aids in identifying high-risk areas and optimizing healthcare service delivery.
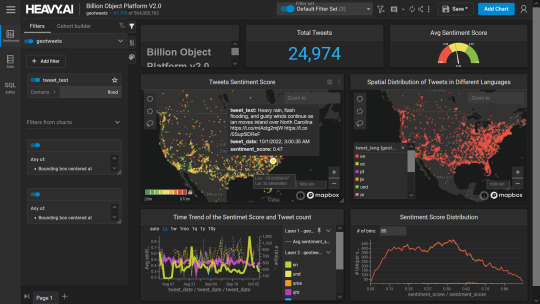
Social Media and Geo-tagging: GIS also helps in geotagging and other location related information in posts, it’s tools can map and visualize the spatial distribution of social media activity. This analysis can reveal trends, hotspots, and patterns in user engagement across different geographic areas. Many social media platforms incorporate GIS for geo-tagging, allowing users to share their location and experiences. This feature enhances social connectivity and facilitates the sharing of location-specific information.
Smart City Initiatives: The Geographic Information System (GIS) offers advanced and user-friendly capabilities for Smart City projects and allows to capture, store and manipulate, analyze and visualize spatially referenced data. It is used for spatial analysis and modeling. It is the cornerstone of smart city planning, enabling the integration of data for efficient urban management. It supports initiatives related to traffic management, waste disposal, energy consumption, and overall infrastructure development.

Education and Research: GIS is increasingly utilized in education and research for visualizing and analyzing spatial data. It enables students and researchers to explore geographic relationships, conduct field studies, and enhance their understanding of various subjects.
Agricultural Management and Precision Farming: Farmers leverage GIS to optimize agricultural practices by analyzing soil conditions, crop health, and weather patterns. Precision farming techniques, facilitated by GIS, contribute to increased crop yields and sustainable farming practices.
Real Estate and Property Management: In the real estate sector, GIS aids in property mapping, land valuation, and site selection. It provides real estate professionals with valuable insights into spatial relationships, market trends, and optimal development opportunities.
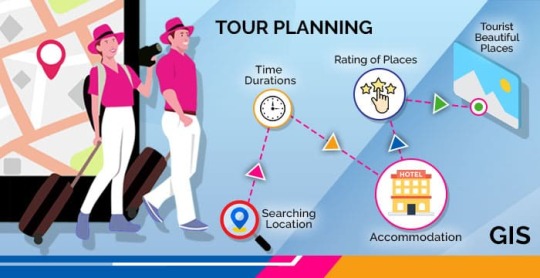
Tourism and Recreation: GIS enhances the tourism industry by providing interactive maps, route planning, and location-based information. It assists tourists in exploring destinations, finding attractions, and navigating efficiently.
The broad and varied involvement of GIS in our daily lives underscores its significance as a technology that not only facilitates geographic data analysis but also contributes to the efficiency, safety, and interconnectedness of modern society. As GIS applications continue to evolve, their impact on daily activities is expected to further expand and refine.
#gis#architectdesign#architecture#city#education#geographic information system(gis)#geographical indication
14 notes
·
View notes
Text
Kshema is India’s Digital Insurance Company For Agriculture & Food Sectors
Kshema is India’s digital Insurance company that caters predominantly to cultivators of the Agriculture & Food Sectors. Our mission is to enable resilience among cultivators across the country, from income shocks due to extreme climate events and other vagaries, with insurance.

I AGRI — our proprietary location-aware platform that assesses and prices risk adequately allows us to address pre-harvest risks at a farm level. Developed in partnership with leading global experts in Spatial data sciences, actuaries, financial engineers and remote sensing experts among others, the platform allows us the benefit of drawing evidence-based results to expand the scope of our services beyond traditional risk analyses.

• A D2C rural insurance company with emphasis on creating products for cultivators.
• Kshema would create insurance solutions, through geo-tagging for many location-specific pre-harvest risks faced by cultivators.
• We aim to incentivize sustainable cultivation practices contributing to a ‘Net Zero Emissions Planet’ and Sustainable development Goals in the future.
• A well-capitalized company led by promoters with a progressive vision and a growth mindset.
• Kshema is an equal opportunities provider. Whether it’s our employees, vendors or partners, we only consider their merit and the value they create.We are changing the world, one farmer at a time — if you are passionate about creating impact on a global scale — join our journey.
2 notes
·
View notes
Note
okay, so im going up for bat for rhode island. yes it is very small, but also very very charming with tons of beaches and good food! if youre ever in the northwest us i really recommend visiting bc its lovely :)
:) I would like to see it sometime!! Visiting the NorthEast is a huge vacation goal someday! And I've heard good things about Rhode Island's food
that post was about what state we cannot fathom, and as someone from Nevada, Rhode Island is very very different from my conceptions of state identity and the ecosystems I grew up in.
I do wonder how living in a very small state or very large state influences geo-spatial concepts of identity, community, etc. but in a like "i study humanity" way
2 notes
·
View notes
Text

Unlock location intelligence with custom GIS Software Solutions tailored to your business needs. From spatial data analysis to real-time mapping and visualization — we build smart, scalable GIS applications. 📌 Improve Decision-Making | 📍 Accurate Geo-Mapping | 🚀 Industry-Ready Solutions 🔗 Powered by Kreate Technologies For More Info: https://kreatetechnologies.com/expertise/gis-software-development-services/
#GISDevelopment #GeoSolutions #KreateTechnologies #MappingSoftware #SmartGIS #SoftwareDevelopment
0 notes
Text
Understanding Scale and Perspective in 3D Vector Maps for Architects

Perspective in 3D Vector Maps for Architects
In today’s architectural world, technology is rapidly transforming how professionals visualize, plan, and present their designs. Among these cutting-edge tools, 3D Vector Maps have emerged as a vital resource for architects. These maps offer detailed, interactive, and scalable representations of environments—urban, rural, or topographical. Understanding how to effectively apply scale and perspective in these maps is crucial for producing realistic, functional, and visually compelling Architecture Illustration.
This blog explores the core concepts of scale and perspective in 3D Map Illustration, their importance in architectural workflows, and best practices for creating accurate and impactful 3D visuals.
What Are 3D Vector Maps?
Unlike raster images, which are composed of pixels, vector maps use geometric primitives like points, lines, and polygons to represent spatial data. This makes them infinitely scalable without losing resolution—ideal for architectural design, urban planning, and infrastructure development.
In architecture, these maps often serve as the base layer for planning structures within real-world contexts. Whether designing a city skyline or a single residential building, 3D vector maps allow architects to visualize how their designs interact with existing environments.
The Role of Scale
In 3D Map Illustration, using the correct scale is essential for accuracy and context. A structure that looks impressive in isolation might prove disproportionate or unfeasible when placed within a realistically scaled environment.
Why Scale Matters
Proportional Design
Accurate scaling ensures that buildings, roads, vegetation, and other elements maintain correct proportions relative to one another.
Spatial Planning
City planners and architects use scale to estimate distances, plot zoning boundaries, and assess infrastructure needs.
Client Communication
Presenting a scaled 3D map helps clients better understand spatial relationships and project feasibility, especially in large-scale developments.
Practical Applications
Most architectural software (like AutoCAD, SketchUp, or Revit) allows for importing and working with scaled vector data. By aligning 3D models to a base map with a known scale, architects can simulate real-world conditions with impressive precision.
Perspective: Creating Depth and Realism
While scale ensures dimensional accuracy, perspective adds depth and realism to Architecture Illustration. Perspective in 3D mapping involves simulating how objects appear smaller as they recede into the distance, mimicking human vision.
Types of Perspective in 3D Map Illustration
One-Point Perspective
Commonly used in interior design or symmetrical architectural views.
Three-Point Perspective
Utilized for dramatic aerial views or looking up/down on structures.
Enhancing Visual Impact
Incorporating the correct perspective helps viewers intuitively grasp spatial hierarchies.
Merging Scale and Perspective in Architecture Illustration
The most effective Architecture Illustration blend scale and perspective seamlessly. Here’s how to merge both elements effectively:
Align Models with Base Maps
Start with a geo-referenced 3D vector map to establish scale. Ensure your architectural models are built or imported at the same scale.
Set Up Viewpoints Strategically
Choose viewpoints based on what you need to emphasize—street-level engagement, skyline profile, or environmental integration.
Adjust Camera Settings
Use your rendering software’s camera settings to control focal length and depth of field.
Tools for Creating Scaled 3D Vector Maps
Modern software tools have made it easier than ever to create and work with 3D map illustrations. Here are some popular platforms:
Google Earth Studio:
Great for high-level contextual visualizations.
QGIS with Qgis2threejs Plugin:
Open-source solution for rendering 3D terrain and structures.
These tools enable architects to integrate topographic data, zoning overlays, and real-time weather conditions into their models, making them far more robust and informative.
Common Challenges and How to Overcome Them
Data Inconsistency
Vector data may come from multiple sources and scales. Normalize datasets before integrating them into a single project.
Rendering Complexity
Use Level of Detail (LoD) modeling and scene optimization techniques.
Visual Clutter
Too much detail can overwhelm the viewer. Focus on what's important and use transparency or color-coding to manage visual hierarchy.
Perspective Distortion
Always cross-reference with plan views and sectional drawings.
Future Trends: AI and Real-Time Visualization
With the advent of artificial intelligence, real-time rendering engines, and augmented reality (AR), the future of Architecture Illustration is increasingly immersive. AI-driven tools can automatically adjust perspective based on viewer input or optimize scale based on project scope.
Imagine walking through a new housing development before a single brick is laid—thanks to AR layers embedded in a 3D vector map. These innovations are not just flashy; they enable faster iteration, better decision-making, and stronger client engagement.
Conclusion
Understanding scale and perspective in 3D vector maps is not just a technical requirement—it’s a creative opportunity. When applied effectively, these principles allow architects to communicate their vision clearly, design more effectively within real-world constraints, and create visually compelling 3D Map Illustration.
As the architectural field continues to evolve with digital tools, mastering these foundational concepts will empower professionals to stay ahead of the curve, deliver superior results, and push the boundaries of what's possible in design and visualization.
Whether you’re planning a small residential project or an entire smart city, the power of 3D Vector Maps lies in how well you understand and manipulate scale and perspective. Embrace these tools not just as utilities, but as extensions of your creative mind
0 notes
Text
MetaOrigins – Leading Data Analytics Company in Toronto for Real Estate & Supply Chain
In today’s fast-paced digital world, the real estate and supply chain industries demand more than just traditional insights — they need intelligent, data-driven decisions. At MetaOrigins, we specialize in delivering cutting-edge data analytics solutions in Toronto tailored specifically for real estate and supply chain businesses.
🔍 Who We Are
MetaOrigins is a premier data analytics company in Toronto for real estate and supply chain industries. We harness the power of AI and machine learning to uncover trends, optimize operations, and boost profitability.
🏢 Real Estate Data Solutions
Looking for a reliable data company in Toronto for real estate? MetaOrigins transforms raw property data into actionable insights. Whether you're a property developer, investor, or commercial broker, we help you:
Analyze market trends and pricing patterns
Forecast property values using AI models
Optimize portfolio performance
Gain a competitive edge with geo-spatial data analytics
MetaOrigins stands out as a leading AI company in Toronto for real estate, enabling clients to make smart investment decisions powered by advanced technology.
🚚 Supply Chain Intelligence
For businesses in logistics, manufacturing, and retail, MetaOrigins is your go-to data company in Toronto for supply chain management. Our services include:
Real-time demand forecasting
Inventory optimization
Route and logistics efficiency
Supplier risk analysis
With our AI capabilities, we are also recognized as a top AI company in Toronto for supply chain transformation — helping organizations reduce costs and improve agility.
💡 Why Choose MetaOrigins?
✅ Industry-specific data science expertise
✅ AI-driven analytics platforms
✅ Customized dashboards and reporting tools
✅ Toronto-based support with global insights
Whether you're in real estate or logistics, MetaOrigins is the data analytics company in Toronto for real estate and supply chain excellence.
📞 Ready to Turn Data into Decisions?
Partner with MetaOrigins and unlock the future of smart, AI-powered analytics. Visit metaorigins.com or contact us to schedule a free consultation.
#data analytics company in toronto for real estate#data company in toronto for real estate#data company in toronto for supply chain#aI company in toronto for supply chain#aI company in toronto for real estate
0 notes
Text
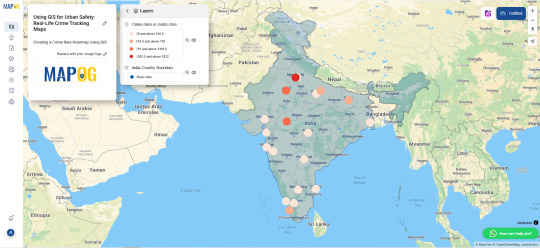
GIS for Urban Safety with Interactive Crime Mapping

Interactive, GIS-powered crime maps deliver essential spatial insights for bolstering urban safety. By displaying crime data in real life, these platforms enable law enforcement and city planners to pinpoint high-risk areas, anticipate emerging trends, and allocate resources more effectively—melding public records with advanced geospatial analysis.
Why Use GIS for Crime Prevention?
GIS streamlines crime analysis by overlaying incident reports with environmental, demographic, and infrastructure layers. Moreover, these scalable solutions support predictive policing, informed patrol deployment, and robust community outreach through location-based crime intelligence.
Uses of GIS in Urban Safety
Hotspot Detection – Reveal clusters of criminal activity, guiding officers to the areas that need attention most.
Predictive Policing – Identify patterns in past incidents to forecast where future offenses may occur.
Public Safety Planning – Inform neighborhood design by integrating crime data into urban development decisions.
Key Applications
Community Awareness: Offer citizens up-to-date crime information via interactive dashboards.
Patrol Optimization: Reconfigure patrol routes according to crime density and urgency metrics.
Traffic Incident Mapping: Enhance road safety by mapping collisions and traffic-related offenses.
Procedure for Crime Mapping with GIS
First, compile crime statistics and geo coordinates from authoritative sources by adding a boundary layer. Next, add CSV/Excel file containing city names and their latitude–longitude pairs. Then, create a “Crime Rate” attribute in the layer’s schema and input the corresponding values for each location. Afterward, switch to the style settings and enable the “Bubble Map” visualization. Adjust classification breaks for clarity and assign a bubble radius of 20 for optimal display. Using tools like MAPOG, merge administrative boundaries and fine-tune symbology for clear overlays. Finally, review the map, publish it to your GIS portal, and share the interactive link with stakeholders.
Use Case: School Zone Safety and Youth Protection
GIS crime mapping is increasingly used to safeguard areas around schools by analyzing incidents involving theft, bullying, or drug-related activity near educational institutions. By combining spatial crime data with student commute routes, pedestrian crossings, and traffic flow, city officials can implement targeted interventions such as increased surveillance, better lighting, and adjusted traffic patterns. This application not only helps create safer school zones but also strengthens policies aimed at protecting young populations in vulnerable urban pockets.
Open-Source GIS Tools in Crime Analysis
Open-source platforms such as MAPOG enable municipalities to develop transparent, shareable crime maps. These tools enhance civic participation, facilitate data sharing, and improve real-life public safety coordination.
Conclusion
By harnessing interactive GIS mapping, cities can revolutionize crime prevention and response. With spatial data and dynamic visualizations, decision-makers gain the insight needed to deploy resources swiftly, engage communities effectively, and ultimately create safer, more resilient urban environments.
#UrbanSafety#CrimeMapping#GISforSafety#SmartPolicing#SafeCities#GeospatialTech#PredictivePolicing#CommunitySafety#SmartMapping#DataDrivenSecurity
1 note
·
View note
Text
Huawei vs Starlink : Une Guerre Technologique dans l’Espace pour le Futur de la Connectivité Globale
Imaginez un monde où même les coins les plus reculés de la planète bénéficient d’une connexion internet rapide, fluide et permanente. Ce rêve est sur le point de devenir réalité…
Une Révolution Technologique Sans Précédent
Ce projet marque un tournant décisif. Contrairement aux infrastructures traditionnelles — antennes relais et câbles à fibre optique — le réseau spatial de Huawei promet une couverture planétaire, même dans les zones les plus inaccessibles. La promesse : une connectivité instantanée avec une latence ultra faible, idéale pour les technologies émergentes comme les véhicules autonomes, les communications holographiques ou l’internet des objets (IoT).
La constellation de Huawei reposera sur une double orbite : environ 8000 satellites en orbite basse (LEO), entre 500 et 2000 km d’altitude, et 2000 en orbite géostationnaire (GEO) à 35 800 km. Cette approche hybride permettra d’allier rapidité, couverture étendue et résilience réseau, une prouesse rendue possible grâce à une ingénierie spatiale de pointe.
L’Affrontement : Huawei vs Starlink
Mais derrière cette avancée technologique se profile une confrontation directe avec un autre titan du secteur : Starlink, le réseau satellitaire de SpaceX dirigé par Elon Musk. Fort de ses 4000 satellites déjà en orbite, Starlink a pris une avance considérable en matière de couverture et de pénétration du marché, notamment dans les zones rurales du globe.
Cependant, Huawei entend frapper fort. Son réseau, pensé dès l’origine pour le 6G, promet des vitesses de transmission atteignant plusieurs térabits par seconde, bien au-delà des capacités actuelles de Starlink. La firme chinoise mise aussi sur des technologies de rupture : formation de faisceaux dynamiques, bandes de fréquence Terahertz, IA adaptative pour la gestion en temps réel, et cryptographie post-quantique.
Un Pari Stratégique Global
Ce projet ne se limite pas à une simple guerre commerciale. Il s’inscrit dans une stratégie plus vaste : celle de la souveraineté numérique. Dans un monde où les infrastructures de communication sont devenues des atouts géopolitiques majeurs, Huawei se positionne comme l’alternative aux solutions occidentales, offrant aux pays émergents et aux États en quête d’autonomie technologique une voie différente.
Grâce à sa présence mondiale et à ses alliances stratégiques, notamment dans les BRICS et en Afrique, Huawei pourrait obtenir des subventions, intégrer les plans nationaux de connectivité et offrir des modèles tarifaires ultra-compétitifs, un argument de poids face aux contraintes budgétaires de nombreux gouvernements.
Un Impact Sociétal et Économique Potentiel
L’infrastructure 6G de Huawei ne se contente pas de promettre des vitesses plus rapides : elle pourrait transformer des pans entiers de la société.
Éducation : Les enfants vivant dans des villages isolés pourraient suivre des cours en ligne en haute définition, avec accès à des enseignants et à des ressources de premier plan.
Santé : La télémédecine, y compris les opérations chirurgicales à distance, deviendrait accessible partout, même dans les régions sans infrastructure hospitalière avancée.
Agriculture : Les capteurs IoT connectés via satellite permettront une gestion des cultures optimisée en temps réel.
Transport : Véhicules autonomes, drones, logistique intelligente — autant de domaines qui bénéficieront d’une connectivité constante et ultra-réactive.
Villes intelligentes : Réseaux énergétiques, sécurité publique, gestion du trafic — la 6G spatiale pourrait devenir le système nerveux central des smart cities.
Des Défis Colossaux à Surmonter
Toutefois, cette révolution ne vient pas sans risques. Une infrastructure aussi étendue devra faire face à des enjeux critiques :
Environnement spatial : La multiplication des satellites accroît les risques de collision et de pollution orbitale, posant la question de la gestion durable de l’espace.
Cybersécurité : Protéger un réseau global contre les cyberattaques nécessitera une architecture résiliente, des protocoles de chiffrement avancés et une surveillance constante.
Vie privée et éthique : La généralisation de la connectivité soulève des questions sur la surveillance, la souveraineté des données et la dilution des identités culturelles.
Le Futur se Joue Maintenant
L’entrée de Huawei sur le marché de l’internet satellitaire avec une infrastructure pensée pour le 6G ne laisse personne indifférent. Face à un Starlink bien établi, mais limité par son infrastructure de première génération, Huawei se pose en disruptor capable de rebattre les cartes du numérique mondial.
Dans cette bataille entre innovation, puissance économique et ambitions géopolitiques, une chose est certaine : le futur de l’internet ne se jouera pas uniquement au sol, mais aussi dans les étoiles.
Et vous, qu’est-ce qui vous enthousiasme le plus dans cette nouvelle ère du 6G spatial ? L’accès mondial ininterrompu ? L’émergence des villes intelligentes ?
0 notes
Text


Document Control Number: USPTO 13/573,002 Art Unit: 2468
TITLE: The WORLD GAME (s) GREAT REDESIGN Document Control Number: USPTO 13/573,002 Art Unit: 2468
Patent Application Type: Adaptive procedural template
TITLE: The Heart Beacon Cycle Time - Space Meter
SUBTITLE: Adaptive Procedural Template framework, control grid / matrix telemetry, metrics, meters for the World Game's Great Redesign
USE CASE: Taffiff Trade Wars = Trade Reference Currency TRC = GDP pacing items statistical mean index Milton Friedman's K% rule #GDP pacing item index based economy #tariffs time - space calculation tool (s) IDMaps - SonarHops Distance Estimation Service / Trade of GDP Gross Domestic Product Economic Pacing Items
#tokens #blockchain #crypto #bitcoin #GDP #tokenization #commodity #RWA Real world Assets
THESIS: Foundation Technology trinity:
EPOCH (s) = Time intervals, cycles ex: Blockchain, AI dbase = TIME Chain
SPACE (ex: IRS memo #1421 "Bitcoin transaction akin to land acquisition"
SYNTAX: data elements mapped to symbols for A.I. / man - machine interface
THESIS: All artifacts internet, programmable net of money are formed using:
Epoch time cycle intervals ex: created by silicon microchip oscillations
Syntax parsed, processed during epoch time cycle intervals
All things internet, internet of money, blockchains (time chains) are formed with unicast, multicast, anycast protocols. workflow logic, procedures, process filters
BACKGROUND: an invention may be an improvement to an existing invention. USPTO 13/573,002's basis for invention is US Army CECOM Communication - Electronics Command's "Greatest Invention" a system of systems structured data digital dashboard geo-temporal - spatial synchronization, standardization program matching brevity codes to symbols, symbol sets critical for A.I. Artificial Intelligence man - machine interface used for OOTW Operations Other Than War: a German Army suggestion circa 2003. Supreme Court SCOTUS Alice in Wonderland Precedent: Packets, frames, layers, blocks, shards, graphs, hash graphs “bots”, “motes”, … or Satoshi's traversing the net, stored in a blockchain cube are abstractions, abstract ideas, terms. The afore mentioned terms are non-existent, fictitious, imaginary metaphorical fabrications are non - compliant with US Supreme Court SCOTUS Alice Corp Vs CLS Bank 2014 ruling “claims may not direct towards abstract ideas”. Physical is the opposite of abstract.
USE CASE: The main use case of the (technically non-existent) blockchain derived from the video game industry adapted to the cryptocurrency industry is about adding micropayments / microtransactions with the intent to add a pay by event / action / (token) transaction additional income stream / control grid layer of control. Source: https://intelligenteconomist.com/microtransactions/
Use Case: avoid duplication of DoD / NATO decades of work in concert with ISO, ITU, IEEE, DoD / NATO maps data element OPSCODE brevity codes, tokens to (Mil standard 2525C, D) symbols supporting A.I. man - machine interface for consensus, concurrence among an engineering system of federated, distributed systems PRECEDENT: BRICS / Eurasian Economic Union Commodity Basket backed currency / “new global reserve currency based on Real World Assets, commodities” “The matter of creating the international reserve currency based on the basket of currencies of our countries is under review” Source: Fintech Magazine
Nobel Prize winning Economist Milton Friedman “only a crisis brings real change”
USE CASE: Tariff space - time metrics, meters, calculation tool (s), algorithms
Milton Friedman (July 31, 1912 – November 16, 2006) economist and statistician who received the 1976 Nobel Memorial Prize in Economic Sciences for his research on analysis, monetary history and theory and the complexity of stabilization policy. Friedman promoted a macroeconomic viewpoint known as monetarism and argued that a steady, small expansion of the money supply was the preferred policy, compared to rapid, unexpected changes. See: Book: Capitalism and Freedom QUOTE: “Only a crisis - actual or perceived - produces real change. When that crisis occurs, the actions that are taken depend on the ideas that are lying around. That, I believe, is our basic function: to develop alternatives to existing policies, to keep them alive and available until the politically impossible becomes the politically inevitable.” Milton Friedman Nobel Prize winning Economist who described a GDP Gross Domestic Product commodity RWA Real World Asset based K% rule to monetize a currency, implement GDP based rules automated inflation control to manage the global economy.
USE CASE: Real World Assets commodity index backed stablecoin currency: commodity tokens / RWA Real World Assets index backed currency / algorithmic stable coin, tariff space - time calculation tool, DeFI / TradeFi algorithmically regulated programmable economy, control grid, permission access, price discovery derived from many stablecoin time (block) chains, that employ equilibrium algorithms (s) where stablecoin features, attributes: use of geo-spatial temporal event, activity intensity fencing to establish payment boundaries, geo-spatial areas of effect, geo-spatial temporal areas of support where a coin may have a set time limit based on time - stamp servers heartbeat, geo-spatial area of authorized use, select (federated) group of crowd funders, harvest, move crop commodities, goods backing the value of the coin from / to a given area's commons market, federation
The Terra TRC Trade Reference Currency is a global complementary currency designed to provide an inflation-resistant international standard of value; to stabilize the business cycle on a global level; and to realign stockholder’s interests with long-term sustainability. From a legal viewpoint, the Terra is standardized “countertrade” (international barter), which is routinely used for over one trillion dollars worth of transactions per year. Legislation on countertrade exists in about two hundred countries, including all the major trading nations. https://www.lietaer.com/2010/01/terra/ #currency #trade #commodities
French Money of Peace: Le Fédériste“ "L'Europa monnaie de la paix" January 1st 1933 QUOTE: "There is only one revolution tolerable to all men, all societies, all political systems: Revolution by design and invention". Richard Buckminster Fuller author of The World (Peace) (simulation) Game book, futurist, environmentalist: http://bfi.org
QUOTE: "Build a new model that makes the old model obsolete" Richard Buckminster Fuller Author of the book Our Spaceship Earth
QUOTE: "The world desperately needs a universal time chain (blockchain) with a distributed time-stamping server with globally recognized immutability to preserve digital truth." "A provable and immutable global time chain is urgently needed, not to replace human conscience but to protect and preserve it." The global economy has begun to degenerate from a relatively free form of capitalism into a digital feudal system,"
QUOTE: "Avoiding danger is no safer in the long run than outright exposure. The fearful are caught as often as the bold." The Yale Book of Quotations Helen Adams Keller (June 27, 1880 – June 1, 1968) deaf and blind author, activist and lecturer.
USPTO 13/573,002 CLAIMS
The object, purposes of the invention is based on the assertion: All internet, programmable internet of money artifacts, building blocks are formed using:
Epoch time cycle intervals created by silicon microchip oscillations, sound wave oscillations intrinsic of, foundation tech for quantum computing at room temperature
Syntax parsed, processed, transmitted during epoch time cycle intervals
All things internet, internet of money, blockchains (time chains) are formed by unicast, multicast, anycast protocols. Programmable money’s improvements are in cryptography for example, blockchains are formed like all things internet, internet of money through use of unicast, multicast, anycast of workflow filters... additionally, The method of claims rely on use of an adaptive procedural template’s tools, processes, procedures enabling micropayments / micro-transactions pay by event / action / (token) transaction income based on this invention’s object of claims
Method of claim 1 is to comply with Supreme Court SCOTUS US SC 573 US 134 2347 Alice Corp Vs CLS Bank ruling with use of a physical, non-abstract little league baseball tournament meme to describe, list steps, procedures, processes intrinsic to internet, internet of foundation technology framework adaptive procedural template to support for example: DeFi programmable money digital tokenized assets by providing system time epoch cycles, geospatial location survey points, workflow roles, rules, scoring system, rewards, penalties, rulings, schedules, event, alerts, sync deltas control grid, access, permission, price discovery, equilibrium algorithms (s) for DeFi, TradeFi based trade federations to establish for example, a one world government, economic, financial system of system’s universal unit of value, statistical mean value for many cryptocurrencies, commodities, currencies, stocks derived from price discovery algorithms which are then heartbeat message beacon broadcasted across time - space
Method of claim 2 relies on through use of an adaptive procedural template framework tools, procedures, processes to describe internet, internet of money, programmable money foundation technology, metrics, meters, SLA Service Level Agreements to form a syntax lexicon namespace derived from NATO / DoD brevity OPSCODE FFIRN, FFUDNS tokens structured data exchange mapped to symbols describing A.I. man – machine interface symbols, big data elements, sets, fields, to form a consistent, universal syntax structured data exchange library – lexicon using UTZ / UTC time stamped data with organization <Org_ID>. data class type, </URN Uniform Resource Name type to form a syntax, code, date element Rosetta Stone referred to in military discussions as The "Grail": i.e., synchronized, common, shared situational awareness data dashboard view (s) of time stamped, brevity code / tokens, digital assets that are filtered, prioritized from heartbeat message bus filtered, parsed, processed from a federated system of systems via use of heartbeat message event bus sync delta epoch data updates Universal Time Zone UTZ synchronized, stochastically harmonized updates using an improvement described by the University of Bologna / Hungary’s ,Chinese University’s firefly inspired heartbeat synchronization algorithm that matches, synchronizes stochastic harmonizes via firefly inspired heartbeat synchronization pulses intrinsic analogous to Network Centric Warfare’s Battlefield Digitization’s closest OPTEMPO Operational Tempos epoch time intervals, cycles i.e., 05, 10, 15, 30 micro, milli seconds, minutes, hours days, years posted to digital dashboards.
Method of claim 3 relies on the use of an adaptive procedural template tools, processes, procedures to provide an alternative to formal mergers and acquisitions for example, tether, untether to autonomous DAO Distributed Autonomous Organization i.e., trade federations using agile, adhoc NetOps supporting federations for example; Ripple's consensus protocol based on federation / federated on demand liquidity drawn from a distributed (global) (trade) federation i.e., 1907 Knickerbocker Banker's Crisis JP Morgan protocol on demand AI directed response - financial system revaluation where Battlefield Digitization Network effects: splits, joins, adds, drops are used as needed as a temporary alternative to formal merger and organization, corporate acquisitions
Method of claim 4 relies on the use of an adaptive procedural template processes, procedures to broadcast, unicast, anycast data synchronization deltas “sync deltas” via micro to macro-cycle system of systems data updates at agreed upon times observing set durations of events, time, temporal epoch leases, price discover algorithms i.e., tariff space - time metrics, meters, data harvests for example stocks, commodity real world digital assets, currency arbitrage trade exchange adjustments using heartbeat epoch time beacon’s intrinsic temporally consistent, synchronized, time bounded i.,e heartbeat start, stop, TTL Time to Live epochs providing discrete time interval start, stop, TTL Time To Live epoch windows embedded in </108> system heartbeats, messages in a control matrix among for example HFT stock market systems participating to establish algorithmic regulation via use of algorithmic price discovery, Nash Equilibrium algorithms to derive a uniform, universal statistical mean value index, discrete, time bounded trade windows, stock trade circuit breaker via heartbeat beacon message, event bus broadcasted , uni, multicast among many stock, commodity, ETF Exchange Traded Fund systems
Method of claim 5 relies on the use of the adaptive procedural template’s firefly inspired heartbeat synchronization message event bus algorithm – protocol, software application neutral monitors geo-spatial, temporally distributed events reported across a DAO Distributed Autonomous Organization among federated groups synchronized across time-space to achieve common, synchronized goals in conjunction with use of adaptive procedural template list items that are intrinsic to algorithms / protocols such as Princeton’s John Nash Equilibrium algorithms and count minimum sketch or streaming K algorithms algorithmically regulating through use of epoch time intervals for HFT stock, commodity, digital token, tokenized RWA Real World Assets, cryptocurrency trade, arbitrage micro transaction epoch temporal time windows in federated systems supporting economic, fiscal control grid matrix among a federated system of systems Method of claim 6 relies on the use of an adaptive procedural template framework to establish, support, maintain economist Milton Friedman’s K% rule where a Central Bank Digital Currency CBDC. stablecoin or conventional FIAT, commodity index backed currency is derived from sampling lead GDP Gross Domestic Product economic indicators among a global event message bus sync delta data, event changes updating for example, a RWA Real World Asset based commodity index backed collective, consistent value unit based currency via use of filtered, stochastically harmonized, temporally synchronized telemetry polled from a universal event bus applying firefly-heartbeat algorithm events, state changes leveraging heartbeat message - event functions to update a statistical mean value index as a standard, consistent unit of value using algorithmic price discovery heartbeat beacon broadcasted among many systems
Method of claim 7 relies on the use of an adaptive procedural template’s tools, processes, procedures, algorithms to derive from price discovery algorithm from Real World Assets a commodity index backed algorithmic stablecoin comprised of: commodity tokens / RWA Real World Assets index where algorithmic price discovery is derived from many stablecoin time (block) chains, that employ equilibrium algorithms (s) where a stablecoin may include attributes, processes, procedures: i.e., use of geo-spatial temporal event, activity intensity fencing to establish payment boundaries, geo-spatial areas of effect, geo-spatial temporal areas of support where a coin may have a set time limit based on time - stamp servers heartbeat, geo-spatial area of authorized use, select (federated) group of crowd funders, harvest, move crop commodities, goods backing the value of the coin from / to a given area's commons market, federation for example, a trade federation supported by Economist Bernard Lietaer’s TRC Trade Reference Currency: TERRA RWA Real World Assets, commodities, commodity basket , index based featuring demurrage fees, charges to support supplier to consumer logistics transfer, travel of for example GDP Gross Domestic Product pacing items as a global complementary currency designed to provide an inflation-resistant international standard of value; to stabilize the business cycle on a global level; and to realign stockholder’s interests with long-term sustainability, management of trade tariffs
Method of claim 8 relies on referencing an adaptive procedural template to establish, maintain trade tariffs SLA Service Level Agreements i.e., ecologically sustainable economic econometric epoch time cycles supporting universal standard measures, meters, metrics sync delta cyclic update temporal change, linear sequential, geo-spatial temporal intensity radius hop count metrics and meters where closer is shorter, closer is cheaper, given less CO2 carbon dioxide credits are used given less trade demurrage fees levied as a method of climate control agreed upon by a trade federation (s)
Method of claim 9 relies on the use of an adaptive procedural template’s tools, processes, procedures to establish, maintain a global system of systems telemetry data synchronization, stochastic harmonization, based on sound - light waveform based quantum computing to establish for example, temporal speed limits, discrete time intervals to derive, provide systemic metrics, meters, synchronization, stochastic harmonization among many system of systems Distributed Autonomous Systems DAS
Method of claim 10 relies on the use of adaptive procedural template tools, processes, procedures, algorithms and specifically sound waves (see water drop in pond meme, graphic) to measure trough, crest wave cycles that when statistically sampled represent a digital approximation of physical waves as the basis for establishing common, shared, universal method and means to measure, meter, communicate telemetry across a plurality of quantum computing system of systems using a system (s) for example: comprised of curved electrodes to concentrate sound waves similar to a magnifying lens to focus a point of light at room temperature rather than use of liquid hydrogen to cool a space for quantum particles event sampling with electron microscopes
Method of claim 11 relies on the use of an adaptive procedural template framework’s tools, processes, procedures, algorithms to apply the electric dipole effect electric meters, metrics where closer is cheaper given less infrastructure needed given energy attenuates over distances • data over energy link where energy pulses as a method and means to transmit data / electricity via wired, and wireless air – ground pathways as demonstrated by inventor, scientist Nicola Telsa circa 1900 near Colorado Springs CO
Metaphorical blockchain’s = timechain actual foundation tech, net of $ building blocks
0 notes
Text
GIS has evidently evolved both in practical expressions and its capabilities. Formative years of GIS provided the platform for the basic organization of the company’s processing structures and database which are still in use in the modern GIS. Initially, GIS focused mainly on technology and less on its application as is the case with majority of technological innovations. Currently, GIS is considered as the most effective way of handling voluminous geographical data and is also reliable in spatial analysis capabilities. In the early 1970’s, computer mapping technology gave birth to a new technology of drafting maps. Areas, points and lines defining a geographical area could now be represented on a well organized Cartesian plane with X, Y coordinates. This automated cartography assisted map drawers in plotting of maps due to its capability of making connections at a variety of scales, colors and projections. Majority of concepts and procedures applied in modern GIS technology rely heavily on the pioneering efforts in automated map drafting. A major advantage that came along with computer mapping was the ability to alter the position of a map and rapidly redraft the area. It is now easy to determine updates of resource maps for instance in the incidence of a forest fire, the starting point can be instantly determined. Mapped data format has radically changed from the previous analog inked lines on paper to storage of data on disks (Ghose 2001). During the early years of 1980’s changes in mapped data computer environment and format was utilized to develop a new technology. This was the spatial database management system (SDBM) which linked management capabilities from traditional database and those of computer mapping capabilities. In this system, geographical features are assigned identification numbers such that user can instantly obtain all the information about the feature once they point the number on the map. There were two alternatives to encoding maps; vector and raster data models which raised disagreements on the most appropriate one. However, in the mid-1980’s, GIS came to the consensus that appropriateness of data structure depends on the processing desired and nature of data. This era of computer mapping heightened the demand for mapped data as there was increasing need to for data availability, standards and accuracy and data structure issues as well. In addition, automated scanners were developed as hardware vendors used manual digitizing tablets to modify digitizing equipment (Ghose 2001). GIS new technology also facilitated emergence of a new industry for database design and map encoding and expansion of the marketplace for the sale of products of digital maps. This period was a milestone for GIS database development as its operations expanded from individual projects to corporate resources. As technological development of GIS advanced prescriptive analysis of mapped data was adapted from the former descriptive “geo-query” database method. Formative years of GIS were focused on automating mapping practices that were traditionally used. The systems were programmed with analogous procedures and mathematical functions which made it easier for users. Automation of the repetitive and tedious operations was a competitive ground for GIS as many people preferred to use the system due to its cost effectiveness. Knowledge of geo-query operations became overwhelmingly widened by mid-1980 and this initiated the theory of partial analysis. The sticking feature of partial analysis theory is numerical representation of data opposed to the traditional analog fashion like the use of inked lines on maps (David 2001). Traditional analog analysis methods were limited in quantitative processing as it utilized manual analytical techniques. On the other hand, digital representation makes it possible for both quantitative and qualitative processing. The application has evolved over the years and takes two forms; spatial analysis and spatial statistics. In the recent years, spatial statistics had moved from descriptive to predictive and finally to optimization models. Read the full article
0 notes
Text
SOBRE CHICAGO....
Este código em Python realiza uma análise de clusterização geo-temporal de eventos de violência armada, simulados para a cidade de Chicago. O objetivo principal é identificar padrões espaciais e temporais nesses eventos, agrupando-os em clusters com base em sua proximidade geográfica, temporal e outras características relevantes.
Funcionalidades e Melhorias:
Simulação de Dados:
O código inicia com a geração de um conjunto de dados simulados, representando eventos de violência armada. Esses dados incluem coordenadas geográficas (latitude e longitude), hora do evento, calibre da arma utilizada, proximidade de escolas e bares, taxa de desemprego e data do ocorrido.
Uma melhoria significativa foi a adição de variáveis temporais (dia da semana e mês) e uma simulação de densidade populacional, tornando a análise mais rica.
Engenharia de Features:
As variáveis categóricas (calibre, proximidade de escolas e bares) são transformadas em variáveis numéricas usando a técnica de "one-hot encoding".
Todas as variáveis numéricas são padronizadas usando o StandardScaler para garantir que tenham a mesma escala, o que é crucial para o algoritmo de clusterização.
Clusterização DBSCAN:
O algoritmo DBSCAN (Density-Based Spatial Clustering of Applications with Noise) é utilizado para agrupar os eventos. Este algoritmo é eficaz na identificação de clusters de formas arbitrárias e na detecção de outliers.
Uma melhoria importante é a otimização do parametro "eps" do DBSCAN, atraves do metodo do joelho.
Validação de Clusterização:
O código inclui métricas de avaliação (índice de silhueta e índice de Calinski-Harabasz) para quantificar a qualidade dos clusters gerados. Essas métricas fornecem informações sobre a coesão e separação dos clusters.
Visualização:
Os resultados da clusterização são visualizados usando a biblioteca Seaborn, mostrando a distribuição dos clusters no mapa de Chicago.
Para melhorar a visualização foi adicionado o plotly express, para uma melhor visualização da densidade dos incidentes.
Os dados são exportados em formato GeoJSON para facilitar a visualização em ferramentas de mapeamento geoespacial como Kepler.gl.
Considerações Importantes:
O código utiliza dados simulados, que podem não refletir a complexidade dos dados reais de violência urbana. A aplicação deste código a dados reais do Chicago Data Portal ou de outras fontes relevantes é essencial para obter resultados significativos.
A análise de violência urbana é um tema sensível, e é crucial considerar aspectos éticos e de justiça algorítmica ao trabalhar com esses dados. A atenção ao viés de dados e a proteção da privacidade são fundamentais.
É importante lembrar que esses dados já carregam consigo muitos vieses da sociedade, portanto muita cautela é mandatório ao analisar os resultados gerados pelos modelos.
Em resumo, este código fornece uma base sólida para a análise geo-temporal de eventos de violência armada. Ao incorporar dados reais e considerar as implicações éticas, ele pode ser uma ferramenta valiosa para entender e abordar esse problema complexo.
import pandas as pd import numpy as np from sklearn.preprocessing import StandardScaler, OneHotEncoder from sklearn.cluster import DBSCAN from sklearn.compose import ColumnTransformer from sklearn.pipeline import Pipeline from datetime import datetime from geopy.distance import geodesic import matplotlib.pyplot as plt import seaborn as sns import geopandas as gpd from sklearn.metrics import silhouette_score, calinski_harabasz_score from sklearn.neighbors import NearestNeighbors import plotly.express as px
Simulação de Dados Melhorada
np.random.seed(42) n = 1200 data = pd.DataFrame({ 'latitude': np.random.uniform(41.75, 41.85, n), 'longitude': np.random.uniform(-87.75, -87.60, n), 'hora': np.random.randint(0, 24, n), 'calibre': np.random.choice(['9mm', '.40', '.45', '.380'], n), 'proximidade_escola': np.random.choice(['Sim', 'Nao'], n, p=[0.2, 0.8]), 'proximidade_bar': np.random.choice(['Sim', 'Nao'], n, p=[0.5, 0.5]), 'desemprego': np.random.uniform(5, 25, n), 'data': pd.to_datetime(np.random.choice(pd.date_range('2023-01-01', '2023-12-31'), n)) })
Engenharia de Variáveis Melhorada
data['dia_semana'] = data['data'].dt.dayofweek data['mes'] = data['data'].dt.month data['densidade_populacional'] = np.random.poisson(lam=1500, size=n)
encoder = ColumnTransformer([ ('onehot', OneHotEncoder(), ['calibre', 'proximidade_escola', 'proximidade_bar']) ], remainder='passthrough')
Normalização e Pipeline
scaler = StandardScaler() pipeline = Pipeline([ ('encode', encoder), ('scale', scaler) ])
X = pipeline.fit_transform(data[['calibre', 'proximidade_escola', 'proximidade_bar', 'hora', 'desemprego', 'dia_semana', 'mes', 'densidade_populacional']])
Otimização de Parâmetros (Knee Method)
neigh = NearestNeighbors(n_neighbors=15) nbrs = neigh.fit(X) distances, _ = nbrs.kneighbors(X) distances = np.sort(distances[:, 14]) plt.plot(distances) plt.xlabel('Points') plt.ylabel('Distance') plt.title('Knee Method for Epsilon Selection') plt.show()
Clusterização DBSCAN com epsilon otimizado
eps = 1.5 # Ajuste com base no método do Knee db = DBSCAN(eps=eps, min_samples=15).fit(X) data['cluster'] = db.labels_
Validação de Clusterização
if len(np.unique(data.cluster)) > 1: print(f"Silhouette: {silhouette_score(X, data.cluster)}") print(f"Calinski-Harabasz: {calinski_harabasz_score(X, data.cluster)}") else: print("Métricas não aplicáveis - muito poucos clusters")
Visualização com Seaborn
plt.figure(figsize=(10, 8)) sns.scatterplot(data=data, x='longitude', y='latitude', hue='cluster', palette='tab10') plt.title('Clusterização de Tiroteios em Chicago - Simulação Melhorada') plt.xlabel('Longitude') plt.ylabel('Latitude') plt.legend(title='Cluster') plt.grid(True) plt.tight_layout() plt.show()
Visualização com Plotly Express
fig = px.density_mapbox(data, lat='latitude', lon='longitude', radius=5, zoom=9, mapbox_style='carto-darkmatter', title='Densidade de Tiroteios Simulados - Chicago') fig.show()
Exportação GeoJSON
gdf = gpd.GeoDataFrame(data, geometry=gpd.points_from_xy(data.longitude, data.latitude)) gdf.to_file('clusters_chicago_simulado_melhorado.geojson', driver='GeoJSON')
0 notes
Text
Le Chiffre de GEO: la conservation des espèces reçoit 73 millions d'euros annuels, loin derrière la recherche spatiale
En compilant plusieurs milliers de projets axés sur la conservation des espèces à travers le monde, des scientifiques ont évalué la somm
0 notes
Text
How to Build Data Visualizations with Matplotlib, Seaborn, and Plotly

How to Build Data Visualizations with Matplotlib, Seaborn, and Plotly Data visualization is a crucial step in the data analysis process.
It enables us to uncover patterns, understand trends, and communicate insights effectively.
Python offers powerful libraries like Matplotlib, Seaborn, and Plotly that simplify the process of creating visualizations.
In this blog, we’ll explore how to use these libraries to create impactful charts and graphs.
1. Matplotlib:
The Foundation of Visualization in Python Matplotlib is one of the oldest and most widely used libraries for creating static, animated, and interactive visualizations in Python.
While it requires more effort to customize compared to other libraries, its flexibility makes it an indispensable tool.
Key Features: Highly customizable for static plots Extensive support for a variety of chart types Integration with other libraries like Pandas Example: Creating a Simple Line Plot import matplotlib.
import matplotlib.pyplot as plt
# Sample data years = [2010, 2012, 2014, 2016, 2018, 2020] values = [25, 34, 30, 35, 40, 50]
# Creating the plot plt.figure(figsize=(8, 5)) plt.plot(years, values, marker=’o’, linestyle=’-’, color=’b’, label=’Values Over Time’)
# Adding labels and title plt.xlabel(‘Year’) plt.ylabel(‘Value’) plt.title(‘Line Plot Example’) plt.legend() plt.grid(True)
# Show plot plt.show()
2. Seaborn:
Simplifying Statistical Visualization Seaborn is built on top of Matplotlib and provides an easier and more aesthetically pleasing way to create complex visualizations.
It’s ideal for statistical data visualization and integrates seamlessly with Pandas.
Key Features:
Beautiful default styles and color palettes Built-in support for data frames Specialized plots like heatmaps and pair plots
Example:
Creating a Heatmap
import seaborn as sns import numpy as np import pandas as pd
# Sample data np.random.seed(0) data = np.random.rand(10, 12) columns = [f’Month {i+1}’ for i in range(12)] index = [f’Year {i+1}’ for i in range(10)] heatmap_data = pd.DataFrame(data, columns=columns, index=index)
# Creating the heatmap plt.figure(figsize=(12, 8)) sns.heatmap(heatmap_data, annot=True, fmt=”.2f”, cmap=”coolwarm”)
plt.title(‘Heatmap Example’) plt.show()
3. Plotly:
Interactive and Dynamic Visualizations Plotly is a library for creating interactive visualizations that can be shared online or embedded in web applications.
It’s especially popular for dashboards and interactive reports. Key Features: Interactive plots by default Support for 3D and geo-spatial visualizations Integration with web technologies like Dash
Example:
Creating an Interactive Scatter Plot
import plotly.express as px
# Sample data data = { ‘Year’: [2010, 2012, 2014, 2016, 2018, 2020], ‘Value’: [25, 34, 30, 35, 40, 50] }
# Creating a scatter plot df = pd.DataFrame(data) fig = px.scatter(df, x=’Year’, y=’Value’, title=’Interactive Scatter Plot Example’, size=’Value’, color=’Value’)
fig.show()
Conclusion
Matplotlib, Seaborn, and Plotly each have their strengths, and the choice of library depends on the specific requirements of your project.
Matplotlib is best for detailed and static visualizations, Seaborn is ideal for statistical and aesthetically pleasing plots, and Plotly is unmatched in creating interactive visualizations.
0 notes