#sql alias as
Explore tagged Tumblr posts
Visit Tumblr Blog
Explore Tumblr blogs with no restrictions, modern design and the best experience.
Last Seen Tumblr Blogs


Fun Fact
Post activity is at the highest at 4:00 pm EDT; notes peak at 10:00 pm EDT.
Text

Jun Hyewon alias 𝒉𝒂𝒔𝒌𝒆𝒍𝒍, 22, 11/10/2001, libra, francotiradora y espía.
Nacida en una de las 12 ciudades alrededor de la gran ciudad flotante, hija de una mujer que se dedicaba a reparar pequeños robots por encargo y de un hombre de negocios proveniente de la zona más luminosa. Mantuvieron la relación netamente sexual en secreto hasta que el embarazo no deseado de la señora provocó que su ‘padre’ las abandonase como si fuesen basura, negándose a tomar custodia de un bebé a quién consideraba inferior por no compartir el mismo status económico. Nunca supo que, en realidad, la madre de Hyewon, Ahjin, se había enamorado de él y su partida rompió el frágil corazón en mil pedazos, mismo que aún no sana.
Decidió, de igual forma, hacerse cargo de la criatura a pesar de tener la vida en su contra, siendo el enemigo más difícil solventar los gastos que requería para que su hija creciera fuerte y sana. Incapaz de cubrirlo con las reparaciones es que decide trabajar como compañera nocturna, alejada de casa, mientras la pequeña dormía plácidamente en su cómoda cuna. Hyewon creció durante años ajena a lo que su madre hacía con tal de tener un plato de comida sobre la mesa.
Ahjin le enseñó todo lo que sabía sobre robótica en un intento que su mayor tesoro la superase y jamás se viese con la necesidad de vender su cuerpo y alma para sobrevivir en un mundo cruel y triste. Es buena manipulando pequeñas partes mecánicas y algunos lenguajes de programación, aunque su mayor fuerte lo descubriría años más tarde.
Eventualmente y con el paso del tiempo, conoce la verdad sobre todo el sacrificio que su madre ha hecho por ella, llorando desconsoladamente durante horas, culpándose por nacer y traer consigo tanto dolor a pesar que Ahjin no deja de repetirle que la ama y lo orgullosa que está de tenerla como su hija.
Un día y mientras va dejar un encargo, es reclutada por un grupo para entrenarla, tanto por sus habilidades con robots como la belleza única que tenía. Al principio se niega, todo el asunto de guerra contra la ciudad luminosa y su corrompido gobierno no podía importarle menos, mas es convencida cuando le ofrecen una alta suma de dinero con la que podía aliviar la carga de su madre por seis meses mínimo.
Es así como todas las tardes después de trabajar en las pequeñas máquinas se reúne en un edificio abandonado, acompañada de otros jóvenes de diferentes edades, siendo ella la más joven. Aprende sobre combate cuerpo a cuerpo y con armas, descubriendo con lo último su perfecta vista de halcón, acercando cada objetivo sin tambalear y dejando sorprendidos a todos los presentes, incluyendo a sí misma.
Es puesta en el equipo de combate y espionaje, teniendo su primera misión a las semanas de iniciar el entrenamiento. No era difícil, debía acabar con un pez gordo y sus guardaespaldas de ciudad luminosa que estarían por el sector, sin lastimar de más el cuerpo pues era requerido por el cliente. Como era de esperarse cumplió a la perfección y es agregada oficialmente al grupo.
La decisión de teñir su cabello de rojo la tomó cuando se mudó de otra ciudad para no involucrar a Ahjin en el trabajo. A Hyewon le gusta la idea de ser inconfundible por el brillante color carmesí en sus hebras.
Gran parte del dinero que recauda en cada tarea es enviado a su madre, buscando de alguna forma recompensarla por todo lo que ha hecho por ella.
Una de sus misiones secundarias es tener abastecimiento de municiones de todo tipo que puede traficar entre bandas, también recorre las demás ciudades intercambiando todo tipo de información.
#yo no sé hacer fichas. tiro datos que tengo anotados o que se me ocurren en el momento y que sea lo que diosito quiera(????)#perdón jsfsdfs#tampoco sé taggear estas vainas así que yolo(?)#( verse ❀ deus ex machina )#( one more light: bios )#cuando tenga una idea de alias se lo pondré(?)#ay cómo me gusta este verse <3#no sé si se lea coherente pero llevo toda la tarde estudiando pl sql e hice esto en mi intento de no caer en la locura. perdón x2(?)
1 note
·
View note
Text
𝗨𝗻𝗹𝗲𝗮𝘀𝗵 𝘁𝗵𝗲 𝗣𝗼𝘄𝗲𝗿 𝗼𝗳 𝗗𝗮𝘁𝗮 𝘄𝗶𝘁𝗵 𝗣𝗼𝘄𝗲𝗿 𝗕𝗜 𝗢𝗻𝗹𝗶𝗻𝗲 𝗧𝗿𝗮𝗶𝗻𝗶𝗻𝗴 𝗮𝘁 𝗡𝗮𝗿𝗲𝘀𝗵-𝗜𝗧!

Enroll now : https://nareshit.com/courses/power-bi-online-training
Course Overview
Naresh IT offers top-notch Power BI training, both online and in the classroom, aimed at equipping participants with an in-depth grasp of Microsoft Power BI, a premier business intelligence and data visualization platform. Our course delves into crucial facets of data analysis, visualization, and reporting utilizing Power BI. Through hands-on sessions, students will master the creation of dynamic dashboards, data source connectivity, and the extraction of actionable insights. Join Naresh IT for unrivaled expertise in Power BI.
Learn software skills with real experts, either in live classes with videos or without videos, whichever suits you best.
Description
The Power BI course begins with an introduction to business intelligence and the role of Power BI in transforming raw data into meaningful insights. Participants will learn about the Power BI ecosystem, including Power BI Desktop, Power BI Service, and Power BI Mobile. The course covers topics such as data loading, data transformation, creating visualizations, and sharing reports. Practical examples, hands-on projects, and real-world scenarios will be used to reinforce theoretical concepts.
Course Objectives
The primary objectives of the Power BI course are as follows:
Introduction to Business Intelligence and Power BI: Provide an overview of business intelligence concepts and the features of Power BI.
Power BI Ecosystem: Understand the components of the Power BI ecosystem, including Power BI Desktop, Service, and Mobile.
Data Loading and Transformation: Learn the process of loading data into Power BI and transforming it for analysis and visualization.
Data Modeling: Gain skills in creating data models within Power BI to establish relationships and hierarchies.
Creating Visualizations: Explore the various visualization options in Power BI and create interactive and informative reports and dashboards.
Advanced Analytics: Understand how to leverage advanced analytics features in Power BI, including DAX (Data Analysis Expressions) for calculations.
Power BI Service: Learn about the cloud-based service for sharing, collaborating, and publishing Power BI reports.
Data Connectivity: Explore the options for connecting Power BI to various data sources, including databases, cloud services, and Excel.
Sharing and Collaboration: Understand how to share Power BI reports with others, collaborate on datasets, and use workspaces.
Security and Compliance: Explore security measures and compliance considerations when working with sensitive data in Power BI.
Prerequisites
Basic understanding of data analysis concepts.
Familiarity with Microsoft Excel and its functions.
Knowledge of relational databases and SQL.
Understanding of data visualization principles.
Awareness of business intelligence (BI) concepts and tools.
Experience with basic data modeling and transformation techniques.
Course Curriculum
SQL (Structured Query Language)

What is SQL?
What is Database?
Difference between SQL and Database
Types of SQL Commands
Relationships in SQL
Comments in SQL
Alias in SQL
Database Commands
Datatypes in SQL
Table Commands
Constraints in SQL
Operators in SQL
Clauses in SQL
Functions in SQL
JOINS
Set operators
Sub Queries
Views
Synonyms
Case Statements
Window Functions
Introduction to Power BI
Power BI Introduction
Power BI Desktop (Power Query, Power Pivot, Power View, Data Modelling)
Power BI Service
Flow of Work in Power BI
Power BI Architecture
Power BI Desktop Installation
Installation through Microsoft Store
Download and Installation of Power BI Desktop
Power Query Editor / Power Query
Overview of Power Query Editor
Introduction of Power Query
UI of Power Query Editor
How to Open Power Query Editor
File Tab
Inbuilt Column Transformations
Inbuilt Row Transformations
Query Options
Home Tab Options
Transform Tab Options
Add Column Tab
Combine Queries (Merge and Append Queries)
View Tab Options
Tools Tab Options
Help Tab Options
Filters in Power Query
Data Modelling / Model View
What is InMemory Columnar database and advantages
What is Traditional database
Difference between InMemory Columnar database and Traditional database
xVelocity In-memory Analytics Engine (Vertipaq Engine)
Data Connectivity modes in Power BI
What is Data Modelling?
What are a Relationships?
Types of Relationships/Cardinalities
One-to-One, One-to-many, Many-to-One, Many-to-Many
Why do we need a Relationship?
How to create a relationship in Power BI
Edit existing relationship
Delete relationship
AutoDetect Relationship
Make Relationship Active or Inactive
Cross filter direction (Single, Both)
Assume Referential Integrity
Apply Security Filter in Both Directions
Dimension Column, Fact Column.
Dimension table, Fact Table
What is Schema?
Types of Schemas and Advantages
Power View / Report View

Introduction to Power View
What and why Visualizations?
UI of Report View/Power View
Difference between Numeric data, Categorical data, Series of data
Difference between Quantitative data and Qualitative data
Categorical data Visuals
Numeric and Series of Data
Tabular Data
Geographical Data
KPI Data
Filtering data
Filters in Power View
Drill Reports
Visual Interactions
Grouping
Sorting
Bookmarks in Power BI
Selection Pane in Power BI
Buttons in Power BI
Tooltips
Power BI Service
Power BI Architecture
How to Sign into Power BI Service account
Power Bi Licences (Pro & Premium Licences)
Team Collaboration in Power BI using Workspace
Sharing Power BI Content using Basic Sharing, Content Packs and Apps
Refreshing the Data Source
Deployment Pipelines
Row Level Security (RLS)
#PowerBI#PowerBIDesktop#DataVisualization#DataAnalytics#BusinessIntelligence#PowerBIAI#DataStorytelling
0 notes
Text
Homework 5 Managing Data(bases) using SQL solved
Objective: Create SELECT statements involving multiple tables by using joins Problem 1: Create a query displaying the employee_id, start_date, end_date and department_name using the old SQL join syntax (Where clause). Alias the departments table with d and the job_history table with jh. Order it by employee_id and start_date. Problem 2: Rewrite the previous query using the new SQL join syntax…

View On WordPress
0 notes
Text
Homework 5 Managing Data(bases) using SQL
Objective: Create SELECT statements involving multiple tables by using joins Problem 1: Create a query displaying the employee_id, start_date, end_date and department_name using the old SQL join syntax (Where clause). Alias the departments table with d and the job_history table with jh. Order it by employee_id and start_date. Problem 2: Rewrite the previous query using the new SQL join syntax…

View On WordPress
0 notes
Text
[Python] PySpark to M, SQL or Pandas
Hace tiempo escribí un artículo sobre como escribir en pandas algunos códigos de referencia de SQL o M (power query). Si bien en su momento fue de gran utilidad, lo cierto es que hoy existe otro lenguaje que representa un fuerte pie en el análisis de datos.
Spark se convirtió en el jugar principal para lectura de datos en Lakes. Aunque sea cierto que existe SparkSQL, no quise dejar de traer estas analogías de código entre PySpark, M, SQL y Pandas para quienes estén familiarizados con un lenguaje, puedan ver como realizar una acción con el otro.
Lo primero es ponernos de acuerdo en la lectura del post.
Power Query corre en capas. Cada linea llama a la anterior (que devuelve una tabla) generando esta perspectiva o visión en capas. Por ello cuando leamos en el código #“Paso anterior” hablamos de una tabla.
En Python, asumiremos a "df" como un pandas dataframe (pandas.DataFrame) ya cargado y a "spark_frame" a un frame de pyspark cargado (spark.read)
Conozcamos los ejemplos que serán listados en el siguiente orden: SQL, PySpark, Pandas, Power Query.
En SQL:
SELECT TOP 5 * FROM table
En PySpark
spark_frame.limit(5)
En Pandas:
df.head()
En Power Query:
Table.FirstN(#"Paso Anterior",5)
Contar filas
SELECT COUNT(*) FROM table1
spark_frame.count()
df.shape()
Table.RowCount(#"Paso Anterior")
Seleccionar filas
SELECT column1, column2 FROM table1
spark_frame.select("column1", "column2")
df[["column1", "column2"]]
#"Paso Anterior"[[Columna1],[Columna2]] O podría ser: Table.SelectColumns(#"Paso Anterior", {"Columna1", "Columna2"} )
Filtrar filas
SELECT column1, column2 FROM table1 WHERE column1 = 2
spark_frame.filter("column1 = 2") # OR spark_frame.filter(spark_frame['column1'] == 2)
df[['column1', 'column2']].loc[df['column1'] == 2]
Table.SelectRows(#"Paso Anterior", each [column1] == 2 )
Varios filtros de filas
SELECT * FROM table1 WHERE column1 > 1 AND column2 < 25
spark_frame.filter((spark_frame['column1'] > 1) & (spark_frame['column2'] < 25)) O con operadores OR y NOT spark_frame.filter((spark_frame['column1'] > 1) | ~(spark_frame['column2'] < 25))
df.loc[(df['column1'] > 1) & (df['column2'] < 25)] O con operadores OR y NOT df.loc[(df['column1'] > 1) | ~(df['column2'] < 25)]
Table.SelectRows(#"Paso Anterior", each [column1] > 1 and column2 < 25 ) O con operadores OR y NOT Table.SelectRows(#"Paso Anterior", each [column1] > 1 or not ([column1] < 25 ) )
Filtros con operadores complejos
SELECT * FROM table1 WHERE column1 BETWEEN 1 and 5 AND column2 IN (20,30,40,50) AND column3 LIKE '%arcelona%'
from pyspark.sql.functions import col spark_frame.filter( (col('column1').between(1, 5)) & (col('column2').isin(20, 30, 40, 50)) & (col('column3').like('%arcelona%')) ) # O spark_frame.where( (col('column1').between(1, 5)) & (col('column2').isin(20, 30, 40, 50)) & (col('column3').contains('arcelona')) )
df.loc[(df['colum1'].between(1,5)) & (df['column2'].isin([20,30,40,50])) & (df['column3'].str.contains('arcelona'))]
Table.SelectRows(#"Paso Anterior", each ([column1] > 1 and [column1] < 5) and List.Contains({20,30,40,50}, [column2]) and Text.Contains([column3], "arcelona") )
Join tables
SELECT t1.column1, t2.column1 FROM table1 t1 LEFT JOIN table2 t2 ON t1.column_id = t2.column_id
Sería correcto cambiar el alias de columnas de mismo nombre así:
spark_frame1.join(spark_frame2, spark_frame1["column_id"] == spark_frame2["column_id"], "left").select(spark_frame1["column1"].alias("column1_df1"), spark_frame2["column1"].alias("column1_df2"))
Hay dos funciones que pueden ayudarnos en este proceso merge y join.
df_joined = df1.merge(df2, left_on='lkey', right_on='rkey', how='left') df_joined = df1.join(df2, on='column_id', how='left')Luego seleccionamos dos columnas df_joined.loc[['column1_df1', 'column1_df2']]
En Power Query vamos a ir eligiendo una columna de antemano y luego añadiendo la segunda.
#"Origen" = #"Paso Anterior"[[column1_t1]] #"Paso Join" = Table.NestedJoin(#"Origen", {"column_t1_id"}, table2, {"column_t2_id"}, "Prefijo", JoinKind.LeftOuter) #"Expansion" = Table.ExpandTableColumn(#"Paso Join", "Prefijo", {"column1_t2"}, {"Prefijo_column1_t2"})
Group By
SELECT column1, count(*) FROM table1 GROUP BY column1
from pyspark.sql.functions import count spark_frame.groupBy("column1").agg(count("*").alias("count"))
df.groupby('column1')['column1'].count()
Table.Group(#"Paso Anterior", {"column1"}, {{"Alias de count", each Table.RowCount(_), type number}})
Filtrando un agrupado
SELECT store, sum(sales) FROM table1 GROUP BY store HAVING sum(sales) > 1000
from pyspark.sql.functions import sum as spark_sum spark_frame.groupBy("store").agg(spark_sum("sales").alias("total_sales")).filter("total_sales > 1000")
df_grouped = df.groupby('store')['sales'].sum() df_grouped.loc[df_grouped > 1000]
#”Grouping” = Table.Group(#"Paso Anterior", {"store"}, {{"Alias de sum", each List.Sum([sales]), type number}}) #"Final" = Table.SelectRows( #"Grouping" , each [Alias de sum] > 1000 )
Ordenar descendente por columna
SELECT * FROM table1 ORDER BY column1 DESC
spark_frame.orderBy("column1", ascending=False)
df.sort_values(by=['column1'], ascending=False)
Table.Sort(#"Paso Anterior",{{"column1", Order.Descending}})
Unir una tabla con otra de la misma característica
SELECT * FROM table1 UNION SELECT * FROM table2
spark_frame1.union(spark_frame2)
En Pandas tenemos dos opciones conocidas, la función append y concat.
df.append(df2) pd.concat([df1, df2])
Table.Combine({table1, table2})
Transformaciones
Las siguientes transformaciones son directamente entre PySpark, Pandas y Power Query puesto que no son tan comunes en un lenguaje de consulta como SQL. Puede que su resultado no sea idéntico pero si similar para el caso a resolver.
Analizar el contenido de una tabla
spark_frame.summary()
df.describe()
Table.Profile(#"Paso Anterior")
Chequear valores únicos de las columnas
spark_frame.groupBy("column1").count().show()
df.value_counts("columna1")
Table.Profile(#"Paso Anterior")[[Column],[DistinctCount]]
Generar Tabla de prueba con datos cargados a mano
spark_frame = spark.createDataFrame([(1, "Boris Yeltsin"), (2, "Mikhail Gorbachev")], inferSchema=True)
df = pd.DataFrame([[1,2],["Boris Yeltsin", "Mikhail Gorbachev"]], columns=["CustomerID", "Name"])
Table.FromRecords({[CustomerID = 1, Name = "Bob", Phone = "123-4567"]})
Quitar una columna
spark_frame.drop("column1")
df.drop(columns=['column1']) df.drop(['column1'], axis=1)
Table.RemoveColumns(#"Paso Anterior",{"column1"})
Aplicar transformaciones sobre una columna
spark_frame.withColumn("column1", col("column1") + 1)
df.apply(lambda x : x['column1'] + 1 , axis = 1)
Table.TransformColumns(#"Paso Anterior", {{"column1", each _ + 1, type number}})
Hemos terminado el largo camino de consultas y transformaciones que nos ayudarían a tener un mejor tiempo a puro código con PySpark, SQL, Pandas y Power Query para que conociendo uno sepamos usar el otro.
#spark#pyspark#python#pandas#sql#power query#powerquery#notebooks#ladataweb#data engineering#data wrangling#data cleansing
0 notes
Link
0 notes
Text
SQL에서 "조인(Join)"은 두 개 이상의 테이블에서 열을 결합하여 데이터를 조회하는 과정을 말합니다. 조인을 사용하면 관련된 데이터가 여러 테이블에 분산되어 있을 때 이를 통합하여 조회할 수 있습니다. 다양한 종류의 조인이 있으며, 각각 특정한 유형의 결과를 반환합니다.
주요 조인 유형:
SQL에서 "조인(Join)"은 두 개 이상의 테이블에서 열을 결합하여 데이터를 조회하는 과정을 말합니다. 조인을 사용하면 관련된 데이터가 여러 테이블에 분산되어 있을 때 이를 통합하여 조회할 수 있습니다. 다양한 종류의 조인이 있으며, 각각 특정한 유형의 결과를 반환합니다.
주요 조인 유형:
내부 조인 (INNER JOIN):
두 테이블 간에 일치하는 행만 반환합니다. 즉, 양쪽 테이블 모두에서 일치하는 데이터가 있는 경우에만 해당 행들이 결과에 포함됩니다.
구문:sqlCopy codeSELECT columns FROM table1 INNER JOIN table2 ON table1.column_name = table2.column_name;
외부 조인 (OUTER JOIN):
외부 조인은 LEFT OUTER JOIN, RIGHT OUTER JOIN, FULL OUTER JOIN으로 나뉩니다.
LEFT (OUTER) JOIN: 왼쪽 테이블의 모든 행과 오른쪽 테이블에서 일치하는 행을 반환합니다. 오른쪽 테이블에 일치하는 행이 없는 경우 NULL 값으로 반환합니다.
RIGHT (OUTER) JOIN: 오른쪽 테이블의 모든 행과 왼쪽 테이블에서 일치하는 행을 반환합니다. 왼쪽 테이블에 일치하는 행이 없는 경우 NULL 값으로 반환합니다.
FULL (OUTER) JOIN: 왼쪽과 오른쪽 테이블 모두에서 일치하는 행을 반환합니다. 어느 한쪽에만 있는 행도 포함되며, 일치하는 행이 없는 쪽은 NULL 값으로 반환합니다.
크로스 조인 (CROSS JOIN):
두 테이블 간의 모든 가능한 조합을 반환합니다. 이는 두 테이블의 각 행이 다른 테이블의 모든 행과 결합됩니다.
구문:sqlCopy codeSELECT columns FROM table1 CROSS JOIN table2;
자체 조인 (SELF JOIN):
테이블이 자기 자신과 조인되는 경우입니다. 이는 별칭(Alias)을 사용하여 동일한 테이블을 두 번 참조함으로써 수행됩니다.
표준 조인 (ANSI SQL-92 조인 구문):
표준 조인은 SQL-92 표준에서 도입된 조인 구문으로, 조인을 명확하게 표현할 수 있게 해줍니다. 표준 조인 구문은 조인의 종류를 명시적으로 기술하여 가독성과 관리의 용이성을 높입니다.
예를 들어, INNER JOIN은 다음과 같이 표현됩니다:sqlCopy codeSELECT columns FROM table1 INNER JOIN table2 ON table1.column_name = table2.column_name;
표준 조인 구문은 특히 조인의 유형을 명확하게 하여 복잡한 쿼리에서 의도를 분명히 드러내는 데 유용합니다.
조인을 사용하면 데이터베이스 내 여러 테이블 간의 관계를 기반으로 복잡한 쿼리를 ���성하고, 필요한 데이터를 효율적으로 추출할 수 있습니다.
표준 조인 (ANSI SQL-92 조인 구문):
표준 조인은 SQL-92 표준에서 도입된 조인 구문으로, 조인을 명확하게 표현할 수 있게 해줍니다. 표준 조인 구문은 조인의 종류를 명시적으로 기술하여 가독성과 관리의 용이성을 높입니다.
예를 들어, INNER JOIN은 다음과 같이 표현됩니다:sqlCopy codeSELECT columns FROM table1 INNER JOIN table2 ON table1.column_name = table2.column_name;
표준 조인 구문은 특히 조인의 유형을 명확하게 하여 복잡한 쿼리에서 의도를 분명히 드러내는 데 유용합니다.
조인을 사용하면 데이터베이스 내 여러 테이블 간의 관계를 기반으로 복잡한 쿼리를 생성하고, 필요한 데이터를 효율적으로 추출할 수 있습니다.
0 notes
Text
Create SELECT statements involving multiple tables by using joins
Problem 1: Create a query displaying the employee_id, start_date, end_date and department_name using the old SQL join syntax (Where clause). Alias the departments table with d and the job_history table with jh. Order it by employee_id and start_date. Problem 2: Rewrite the previous query using the new SQL join syntax (From clause). Problem 3: Rewrite the previous query using the following syntax…

View On WordPress
0 notes
Text
OPTIMIZER USES SQL PROFILE WITH BAD PLAN EVEN THOUGH GOOD PLAN IS AVAILABLE
*************************************** BASE STATISTICAL INFORMATION *********************** Table Stats:: Table: DSPM Alias: DSPM #Rows: 291053 SSZ: 0 LGR: 0 #Blks: 5778 AvgRowLen: 114.00 NEB: 0 ChainCnt: 0.00 ScanRate: 0.00 SPC: 0 RFL: 0 RNF: 0 CBK: 0 CHR: 0 KQDFLG: 1 #IMCUs: 0 IMCRowCnt: 0 IMCJournalRowCnt: 0 #IMCBlocks: 0 IMCQuotient: 0.000000 Index Stats:: Index: DTYPE Col#: 3 LVLS: 2 #LB:…
View On WordPress
0 notes
Text
Introduction to SQL
Introduction to SQL
One of the key concepts involved in data management is the programming language SQL (Structured Query Language). This language is widely known and used for database management by many individuals and companies around the world. SQL is used to perform creation, retrieval, updating, and deletion (CRUD) tasks on databases, making it very easy to store and query data. SQL was developed in the 1970’s by Raymond Boyce and Donald Chamberlin. It was initially created for use within IBM’s database management system but has since been developed further and become available to the public. Oracle has released an open-source system called MySQL where individuals in the public can write their own SQL to perform queries, which is a great place to start!
Types of Commands
There are three types of commands in SQL:
Data Definition Language (DDL)- DDL defines a database through create, drop, and alter table commands, as well as establishing keys (primary, foreign, etc.)
Data Control Language (DCL)- DCL controls who has access to the data.
Data Manipulation Language (DML)- DML commands are used to query a database.
Steps to Create a Table
The first step to creating a table is making a plan of what variables will be in the table as well as the type of variable. Once a plan is in place, the CREATE TABLE command is used and the variables are listed with their type and length. Then, one must identify which attributes will allow null values and which columns should be unique. At the end, all primary and foreign keys need to be identified. INSERT INTO commands are then used to fill the empty table with rows of data. If a table need to be edited, the ALTER TABLE command can be used. If it needs to be deleted, then DROP TABLE can be used to do so. Sometimes it is helpful to drop a table at the beginning of a session in case there has already been a table created with the table name one is trying to use.
SQL Query Hierarchy
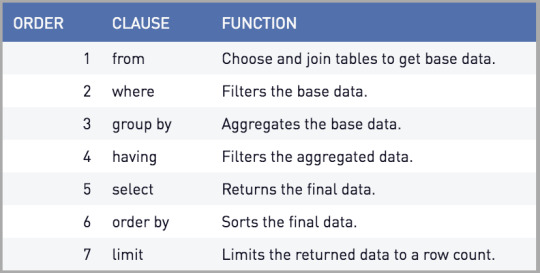
Querying data is essentially asking it a question or asking it for a specified output. Nearly all DML queries begin with the same commands. First, one must identify which columns they would like to the output to contain. This is established by listing the column names after SELECT with commas in between. Aggregate function may be used in this part as well, such as SUM or COUNT. However, if an aggregate function is used, a GROUP BY must also be used (expanded upon later). Next, one must identify the table from which these columns are coming from. To do this, the table name is written after the clause FROM, and an alias may be used if multiple tables are being joined, or just to stay organized. This is also the location where one would identify any tables that are being joined, as well as the column on which they are being joined. SELECT and FROM are the two commands necessary to query data. If there are any filters one would like to use on the data that do not require an aggregation, the WHERE clause comes next. This is where the filter can be applied to the data. If aggregate functions were used in the SELECT command, a GROUP BY command would be used after WHERE. One or more columns can be used in a GROUP BY to group the data by a field (or multiple). Next, a HAVING clause is used to filter data if the filter is based on an aggregate, such as AVG. If one wants the query returned in a sorted manner, the ORDER BY command can be used to sort it in ascending or descending order. If one wants the order to be descending, DESC must be written after ORDER BY. Finally, LIMIT can be used to the limit the number of rows of data returned. These are the steps one would take when writing a query, however, the clauses are processed in a different order by the computer. The order in which they are processed by the computer is as follows: FROM, WHERE, GROUP BY, HAVING, SELECT, ORDER BY, LIMIT. It is also important to note that all these commands are used to query data, so the tables must already be created to perform these operations.
Is it Worth Learning SQL?
The short answer is- absolutely! SQL is a very commonly used programming language across the world; it is universal. Also, it is subjectively easy to learn, especially compared to coding. It is incredibly powerful when dealing with databases. The steps provided above are only for simple queries, though they are very useful. Much more advanced queries are possible with SQL, such as nested queries. If you want to get started with SQL, Data Camp offers excellent beginner courses as well as other online platforms. Because Oracle’s MySQL is open-source and easy to use, it is a great place to practice.
1 note
·
View note
Text
youtube
Dynamic Alias Names in SQL:
How can you return the dynamic alias name for the table columns?
#sqltrick#sqlquery#dynamicsql#sqltips#sqlinterviewquestionsandanswers#interviewquestionsandanswers#sqlinterview#techpointfundamentals#techpointfunda#techpoint#Youtube
1 note
·
View note
Text
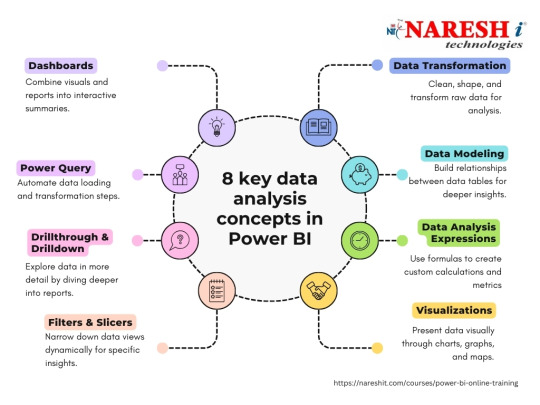
Integrating Power BI with Azure Synapse Analytics for real-time data insights-NareshIT

Enroll now : https://nareshit.com/courses/power-bi-online-training
Course Overview
Naresh IT offers top-notch Power BI training, both online and in the classroom, aimed at equipping participants with an in-depth grasp of Microsoft Power BI, a premier business intelligence and data visualization platform. Our course delves into crucial facets of data analysis, visualization, and reporting utilizing Power BI. Through hands-on sessions, students will master the creation of dynamic dashboards, data source connectivity, and the extraction of actionable insights. Join Naresh IT for unrivaled expertise in Power BI.
Learn software skills with real experts, either in live classes with videos or without videos, whichever suits you best.
Description
The Power BI course begins with an introduction to business intelligence and the role of Power BI in transforming raw data into meaningful insights. Participants will learn about the Power BI ecosystem, including Power BI Desktop, Power BI Service, and Power BI Mobile. The course covers topics such as data loading, data transformation, creating visualizations, and sharing reports. Practical examples, hands-on projects, and real-world scenarios will be used to reinforce theoretical concepts.
Course Objectives
The primary objectives of the Power BI course are as follows:
Introduction to Business Intelligence and Power BI: Provide an overview of business intelligence concepts and the features of Power BI.
Power BI Ecosystem: Understand the components of the Power BI ecosystem, including Power BI Desktop, Service, and Mobile.
Data Loading and Transformation: Learn the process of loading data into Power BI and transforming it for analysis and visualization.
Data Modeling: Gain skills in creating data models within Power BI to establish relationships and hierarchies.
Creating Visualizations: Explore the various visualization options in Power BI and create interactive and informative reports and dashboards.
Advanced Analytics: Understand how to leverage advanced analytics features in Power BI, including DAX (Data Analysis Expressions) for calculations.
Power BI Service: Learn about the cloud-based service for sharing, collaborating, and publishing Power BI reports.
Data Connectivity: Explore the options for connecting Power BI to various data sources, including databases, cloud services, and Excel.
Sharing and Collaboration: Understand how to share Power BI reports with others, collaborate on datasets, and use workspaces.
Security and Compliance: Explore security measures and compliance considerations when working with sensitive data in Power BI.
Prerequisites
Basic understanding of data analysis concepts.
Familiarity with Microsoft Excel and its functions.
Knowledge of relational databases and SQL.
Understanding of data visualization principles.
Awareness of business intelligence (BI) concepts and tools.
Experience with basic data modeling and transformation techniques.
Course Curriculum
SQL (Structured Query Language)
What is SQL?
What is Database?
Difference between SQL and Database
Types of SQL Commands
Relationships in SQL
Comments in SQL
Alias in SQL
Database Commands
Datatypes in SQL
Table Commands
Constraints in SQL
Operators in SQL
Clauses in SQL
Functions in SQL
JOINS
Set operators
Sub Queries
Views
Synonyms
Case Statements
Window Functions
Introduction to Power BI
Power BI Introduction
Power BI Desktop (Power Query, Power Pivot, Power View, Data Modelling)
Power BI Service
Flow of Work in Power BI
Power BI Architecture
Power BI Desktop Installation
Installation through Microsoft Store
Download and Installation of Power BI Desktop
Power Query Editor / Power Query
Overview of Power Query Editor
Introduction of Power Query
UI of Power Query Editor
How to Open Power Query Editor
File Tab
Inbuilt Column Transformations
Inbuilt Row Transformations
Query Options
Home Tab Options
Transform Tab Options
Add Column Tab
Combine Queries (Merge and Append Queries)
View Tab Options
Tools Tab Options
Help Tab Options
Filters in Power Query
Data Modelling / Model View
What is InMemory Columnar database and advantages
What is Traditional database
Difference between InMemory Columnar database and Traditional database
xVelocity In-memory Analytics Engine (Vertipaq Engine)
Data Connectivity modes in Power BI
What is Data Modelling?
What are a Relationships?
Types of Relationships/Cardinalities
One-to-One, One-to-many, Many-to-One, Many-to-Many
Why do we need a Relationship?
How to create a relationship in Power BI
Edit existing relationship
Delete relationship
AutoDetect Relationship
Make Relationship Active or Inactive
Cross filter direction (Single, Both)
Assume Referential Integrity
Apply Security Filter in Both Directions
Dimension Column, Fact Column.
Dimension table, Fact Table
What is Schema?
Types of Schemas and Advantages
Power View / Report View

Introduction to Power View
What and why Visualizations?
UI of Report View/Power View
Difference between Numeric data, Categorical data, Series of data
Difference between Quantitative data and Qualitative data
Categorical data Visuals
Numeric and Series of Data
Tabular Data
Geographical Data
KPI Data
Filtering data
Filters in Power View
Drill Reports
Visual Interactions
Grouping
Sorting
Bookmarks in Power BI
Selection Pane in Power BI
Buttons in Power BI
Tooltips
Power BI Service
Power BI Architecture
How to Sign into Power BI Service account
Power Bi Licences (Pro & Premium Licences)
Team Collaboration in Power BI using Workspace
Sharing Power BI Content using Basic Sharing, Content Packs and Apps
Refreshing the Data Source
Deployment Pipelines
Row Level Security (RLS)
#PowerBI#PowerBIDesktop#DataVisualization#DataAnalytics#BusinessIntelligence#PowerBIAI#DataStorytelling
0 notes
Text
Homework 3 Managing Data(bases) using SQL solved
Objective: Create SELECT queries using basic data types and associated functions Problem 1: Create a query displaying the employee_id, the last name based on table employees. Create a calculated column with an alias of Weekly Salary (case and space required). Assume that the salary column contains monthly salary and that a year has 52 weeks. Round the weekly salary result to 2 decimals. Display…

View On WordPress
0 notes
Text
Homework 3 Managing Data(bases) using SQL
Objective: Create SELECT queries using basic data types and associated functions Problem 1: Create a query displaying the employee_id, the last name based on table employees. Create a calculated column with an alias of Weekly Salary (case and space required). Assume that the salary column contains monthly salary and that a year has 52 weeks. Round the weekly salary result to 2 decimals. Display…

View On WordPress
0 notes
Text
SQL Aliases
The alias are temporary names given to a table or column for a specific SQL query.It is used when a column or table name is used without its original names, but the modified name is only temporary. Syntax Coulmn Alias Syntax: SELECT column1, column2 .... FROM tablename AS aliasname WHERE condition; Table Alias Syntax: SELECT columnname AS aliasname FROM tablename WHERE condition; Example For…
View On WordPress
#alias#alias column#alias in oracle#alias in sql#alias in sql in hindi#alias in sql server#alias name#alias nedir#alias sql#alias sql ita#alias table#aliases#column alias#creando alias#mysql alias#oracle alias#oracle alias name#spalten alias#sql alias#sql alias as#sql alias ita#sql alias join#sql alias syntax#sql aliases#sql and alias#sql column alias#sql server alias#sql server aliases#sql table alias#table alias
0 notes