#types of data visualization techniques
Explore tagged Tumblr posts


Text
https://ezinsights.ai/effective-data-visualization-examples-and-techniques/
#effective data visualization examples#guide to data visualization#how to data visualization#types of data visualization techniques#why use data visualization tools#data visualization tips and tricks
0 notes
Text
Itoshi Sae Profile from Egoist Bible Vol.2 (2024)
"Only the idiots who can keep up will get to see what comes next."

Team: Japan U-20 National Team
Position: Offensive Midfielder (OMF)
Weapons: World class kicking accuracy, world class technique, world class tactical vision, and world class physical ability.
Birthdate: October 10th.
Age: 18 (Third year high school)
Zodiac sign: Libra.
Birthplace: Kanagawa Prefecture (Kamakura City)
Family structure: Father, mother, himself, younger brother.
Height: 180 cm.
Foot size: 26.5 cm.
Blood type: A.
Previous team before he returned to Japan: Re Ale Youth FC.
Dominant foot: Left.
Favorite Soccer Player: Álvaro Recoba. "The left-footed player who creates a rainbow on the pitch."*
Age started playing soccer: 1 year old. "Before I knew it, I was already playing soccer."
Nickname: Treasure of Japan.
Strengths: Being able to see things objectively. "I'm often told that I'm a dry person but who cares."
Weaknesses: I don't know anything except about soccer. "Don't live like this, you guys."
Favorite food: Salted kombucha. "Because I can return back to zero."**
Disliked food: French fries. "It's so delicious that I could die, but it's also so unhealthy that I could die."
Best rice accompaniment: Salted kelp. "They don't have it in Spain so I got it sent from my parents' home."
Hobby: Analyzing data of soccer players and teams. "It's nice to see things visualized as numbers."
Favorite season: The end of summer. "I feel like the whole world has become lonely."
Favorite show: Chibi Maruko-chan. "It reminds me of my parents' home."
Favorite music: Suisei by Tofubeats feat. Seira Kariya. "I listen it to cool down."
Favorite movie: Taxi Driver. "This De Niro guy is the coolest."
Favorite manga: Gegege no Kitaro.
Character color: Azuki Red.
Favorite animal: Seagull. "I like migratory birds that don't stay in one place."
Favorite brands: All the brands that sponsor me. "They have good eyes for betting on me."
Best subjects: No idea because I didn't really pay attention in class and only focused on soccer. "I've never seen my report card."
Fetish: Butt. "You can tell an athlete's ability by the shape of their butt."
What makes you happy: A play beyond my imagination.
What makes you sad: Being forced to carry the weight of Japanese soccer on my shoulders. "Yes, I'm talking about you guys."
The first time someone confessed to you: I don't even remember which one was the first time, dumbass.
Last year's valentine day chocolates: Around 2.000. "My manager told me."
Sleep time: 8 hours. (7 hours+1 hour nap)
Where do you wash first in the bath?: Bangs' hairline.
Mushroom or Bamboo shoots?: Depending on the mood.
What made you cry recently?: Why would I tell you, idiot.
At what age did you stop receiving presents from Santa?: 10 years old.***
What did you ask for a Christmas present from Santa?: My undiscovered talent.
What would you do on your last day on earth?: Give the world's best striker the world's best pass.
What would you do if you received 100 million yen?: I'm not interested. It's just a small change.
What do you do on your days off?: Gazing at the sea.
What would you be doing if you hadn’t discovered soccer?: Living a normal, happy life. Maybe my personality wouldn't have turned out like this.
Who is your favorite historical figure?: Copernicus. He was the man who overturned the world’s common knowledge.
If you could only bring one thing to a deserted island, what would it be?: No need. I’d live the way I wanted without any rules.
Where would you go if you had a time machine, to the past or the future?: Not interested in either. I have no pointless expectations or regrets for my future or my past. Just live in the moment. You guys are so tepid.
---------------------------------------------------------------------------
World-class Offensive Midfielder With Boundless Parameters
Aiming to become the best midfielder in the world, Sae is a super player with the complete package of mind, technique, and physique. Isagi’s best play which he pulled off with “reflex” was stopped with just a light tackle. He killed The Direct Shot flawlessly, showing the big difference between the two.****
He’s Only Interested In Blue Lock! The One He Chose Was Shidou?
Sae was only interested in Blue Lock and paid no attention to his younger brother Rin or the U-20 Japan National Team. The world he sees and the place he aims for are clearly different from those of the U-20 National Team. Sae chose Shidou from Blue Lock as his teammate. With a series of super plays, they managed to corner Blue Lock.
The reason for Sae's sudden change... What on earth happened in Spain!?
Sae went to Spain and promised his younger brother Rin that he’d become “The Best Striker In The World”. However, when he returned home four years later, his attitude had changed completely . He declared that he would become “The Best Midfielder In The World” instead and pushed Rin away, calling him "tepid".*****
---------------------------------------------------------------------------
Sae's Ranking on "Best 3 of Everything: Players seriously voted each!"
1. Ranked #1 The Best at Crossing (Centering)
Hiori’s commentary: "Well, all of Itoshi Sae’s kicks are perfectly designed. I admire him."
2. Ranked #2 The Most Likely To Succeed As Coach
3. Ranked #1 Who Doesn't Cry Easily
Aryu’s commentary: "If Itoshi Sae were to cry, it would be when he became the world’s best. That would be the moment of ultimate styl."******
4. Ranked #1 The Least Family-oriented person
Isagi’s commentary: "If you look at those two, you would assume so. But if they really hate each other… It means that they also think about each other."
5. Ranked #2 The Most Likely To Thrive In The Sengoku Period
6. Ranked #2 The Most Leader-like (or has the qualities of a leader)
7. Ranked #3 Longest Eyelashes
---------------------------------------------------------------------------
Notes:
*Álvaro Recoba (El Chino) is a midfielder from Uruguay known for his "rainbow-like" curved kicks.
**Return back to zero=being refreshed.
***In early 2021 twitter Q&A, he said he stopped getting Christmas presents when Rin stopped believing in Santa. His answer is revised in Egoist Bible to just "10 years old."
****The original sentence is “...a super player who possesses everything– mind, technique and physique (心技体)”. 心技体 or Shingitai refers to the three qualities an athlete must have: 心 is heart/mind, 技 is technique/skill, 体 is body/physique/strength. It is said that an athlete needs 3 of them to succeed. If they only have the right mind and skills but not the body to support them… well you’ll know what will happen! So from our understanding Shingitai is an ‘inseparable set’. We translated it as a “complete package” to let you know that those 3 qualities are inseparable!
*****Here the word used is 突き放す (tsukihanasu). Tsukihanasu is 'to push away', to push someone (or something) away and make them leave. It can also refer to an attitude of treating someone without love, sympathy, or emotions. Please check my notes on Rin’s profile page, because there is a connection!
******What Aryu originally said isファ イナリーオシャ final osha. "The moment where Itoshi Sae finally cried would be the moment of ultimate/final styl.” is most likely what he meant! We personally think ‘ultimate styl’ had more feel than ‘final styl’ (?), that’s why we went with ultimate osha!
Check Sae's profile from the first volume of Egoist Bible here!
153 notes
·
View notes
Text
The Science of Discovering the Past: Geophysical Archaeology

By Glab310 - Own work, CC BY 4.0, https://commons.wikimedia.org/w/index.php?curid=113524155
While much of archaeology involves unearthing artifacts, knowing where to find those sites requires research at the surface, as does mapping the site. Geophysical surveys help archaeologists know where to focus their efforts and help them avoid fruitless digs where no artifacts or remaining structures lie below the surface as well as avoiding the destruction of sites that are culturally sensitive, such as cemeteries.

By see above - http://www.archaeophysics.com/3030/index.htmlTransferred from en.wikipedia by SreeBot, Public Domain, https://commons.wikimedia.org/w/index.php?curid=17210746
There are many methods used to map below the surface, some of which can be done with little training while others meld multiple methods for a more complete map of what's under the surface. Those techniques that are more specialized were adapted from those used to explore for minerals. Mineral surveys seek to know what is deep beneath the surface and archaeological sites are relatively near the surface. These surveys also are focused on larger structures that would take a long time to unearth.

Source: https://sha.org/the-montpelier-minelab-experiment/2012/03/
Various methods of performing geophysical surveys and reveal different information. Metal detectors can be used to find caches of metal, but they don't give detailed information of what is below the surface. They can be used to discover new places to focus studies on. They work by inducing eddy currents, or a looping current between the detector and the metal in the ground, which causes a change in how the current flows in the machine, resulting in a signal being reported to the user, either through sound or visual output. Many locations have regulations or laws that dictate how metal detectors can be used and the ownership of those items found.

Public Domain, https://commons.wikimedia.org/w/index.php?curid=109641426
A more precise form of the this falls into two types: Electrical resistance meters and electromagnetic conductivity. Electrical resistance meters work by inserting probes into the soil through which electrical currents are passed and the resistance of the ground around them is detected, revealing the structures beneath as things like stone have different resistance than the soil around them. Electromagnetic conductivity is similar to metal detection in that a magnetic field is created by an electric field of a known frequency while detectors pick up the change. These detectors and currents are stronger than those of metal detectors with a related increase in size of the detector.

By Archaeo-Physics LLC - http://www.archaeophysics.com, Public Domain, https://commons.wikimedia.org/w/index.php?curid=36404337
Ground-penetrating radar uses electromagnetic pulses to detect what is under the surface in a way similar to how radar works in other applications. The pulses are reflected off items under the surface and recorded by the detector. It's possible to discover how things are layered beneath the surface because of the differences in reflections.

By Cargyrak - Own work, CC BY-SA 4.0, https://commons.wikimedia.org/w/index.php?curid=48685015
Lidar is an optical technique that uses light, usually lasers, to map the land. It has the ability to penetrate foliage, such as forest canopies, and allows features beneath the surface to be distinguished. This also allows features that are too large to be distinguished from the ground to be mapped. Lidar has the additional benefit of being easily integrated into Geographical Information Systems, integrated computer hardware and software systems that are used to analyze and visualize geographic data.
24 notes
·
View notes
Text
continuing the theme of 'what can we make LLMs do' (I promise this is all leading to a really in-depth elaboration on some stuff about human thinking derived from that acid trip I keep mentioning, but I need to write some shader code first for a proper visual representation)
here is an interesting series of articles by @cherrvak on attempts to train an LLM to speak in-character as their friend Zef, by using a technique called RAG to pull up relevant samples from the training corpus in order to provide them in the prompt: part one, part two, part three. the technique worked poorly (in terms of style) with newer LLMs that are trained to interact chatbot style, but worked better with a non-finetuned language model.
I think it's interesting because it tries to solve the problem of gettting LLMs out of the helpful 'chatGPT voice' while still maintaining the coherence and context-sensitivity that makes them so surprisingly effective roleplay partners. if I ever end up trying to make an LLM-powered NPC in a game, seems like it will be very useful research.
so far the techniques for shaping LLM output I know about are, in roughly increasing order of computational intensity:
describing what you want in the prompt; depending on the model this might be phrased as instructions, or examples that you want to be extended
control vectors, where you provide pairs of contrasting prompts and then derive from them a set of values to apply as a kind of forcing while the LLM is generating tokens, to push its output in a particular direction
fine-tuning, where you adjust all the weights of the model in the same way as during its original training (gradient descent etc.)
reinforcement learning, such as the RLHF technique used to turn a generic language model into a chatbot like ChatGPT which follows instructions into a chatbot with certain desired behaviours
RAG largely operates on the first of these: the query is fed into a special type of lookup which finds data related to that subject, and is then appended to the prompt. it's remarkably like human memory in a way: situationally, stuff will 'come to mind' since it seems similar to something else, and we can then factor it into things that we will say.
the biggest problem seems to be not to get the LLMs to say something true if it's retrieved from the database/provided to them in the prompt, but to stop them saying something false/irrelevant when they don't have an answer to hand ('hallucination' or 'bullshitting'). as a human, we have the experience of "trying to remember" information - "it's on the tip of my tongue". I wonder if a model could be somehow taught to recognise when it doesn't have the relevant information and poll the database again with a slightly different vector? that said I still am only at the very beginning of learning to drive these things, so I should probably focus on getting the hang of the basics first, like trying out the other three techniques on the list instead of just testing out different prompts.
8 notes
·
View notes
Note
What was the first thing you decided on, the character's name, appearance, personality or their role in the story?
And reverse, which one of the four things did you struggle with the most?
For Meiyi, please!
As I've already mentioned, Meiyi started off as the Spirit Monk for my Let's Play of BioWare's Jade Empire. So... there's some layers to the answer to this question.
Her development for Jade Empire was something I more or less made up as I went along.
The game offers four character types, each with its own preset visual design for the player character. One of those is male-only, so I had three looks and play styles to pick from, and I went with the above both because it seemed best suited to my gameplay habits and because I liked the look best. So appearance was first.
The name was second: "Heartbreaker Meiyi" was the result of rolling the randomized name suggestions until one popped up that amused me.
"If there's anything that Master Li has taught me, it's that defeat is something that happens to other people."
The first parts of Jade Empire show the player character as being fairly obviously held up as the favorite student of their teacher and parental figure Master Li, and raised on hints of some grand destiny awaiting them. Based on that, one of the first things I determined about Meiyi's personality was that she'd be extremely self-confident, if not to say arrogant, while also having the busybody tendencies and care for the well-being of others that go hand in hand with being an RPG protagonist.
The rest of her personality grew into place as I played through the game, and Meiyi as a character also experienced a good bit of personal growth from her in-universe experiences. Most pertinent to the version I play in FFXIV, the way Jade Empire's story and its mechanics for character ability growth dovetail led me to conclude that she was an extremely quick study, able to pick up and master techniques after seeing them demonstrated once.
I've since used Meiyi as a semi ready-made player character for a few other games where the protagonist is left for the player to define - mostly romance game routes that seemed like they'd be entertaining to imagine her brand of absolute self-assurance and her mastery of martial arts in. She also became my Bounty Hunter for Star Wars: the Old Republic, though that version quickly became her own thing and has little bearing on FFXIV Meiyi.

Meiyi in FFXIV came about when the game added the Dynamis data center, and a group of my friends made alts there. I'd played through all the available MSQ with Raine and wanted to be able to team up with those folks; re-using the familiar character, one with a very different personality as compared to Raine, promised to be a fun way to revisit FFXIV's story from a fresh perspective.
I knew from the start that she'd be the Warrior of Light - Meiyi is not a character who will settle for less than the lead role. I seem to recall I settled on making her a xaela pretty much immediately; the Dotharl, with their beliefs about reincarnation and persistence of the soul, recommended themselves as something adjacent to Jade Empire's concept of the Spirit Monk as an order of martial artists connected to the Water Dragon, goddess of rebirth and custodian of the cycle of reincarnation in that game.
Thus, Meiyi became a Dotharl warrior who's been hearing all her life about what a mighty and skilled warrior she is, and was raised with a typical Dotharli assurance of her own immortality. I've been building on that, adapting the character to FFXIV lore and adding in little bits and pieces of her Jade Empire backstory where I can fit them (I talked about Smiling Mountain and Dawn Star in another post, though neither plays much of a role in Meiyi's road through MSQ so far).
The element I've struggled with most for FFXIV Meiyi is probably her appearance, specifically her skin tone. With her being a Dotharl and a steppe xaela, and given that Raine is white as milk, I wanted Meiyi to have a more melanated skin tone, but I've yet to dial in that particular part of her look despite adjusting it several times. Currently I feel like she's still too light-skinned, but I also like the contrast of the dark xaela scales, which tend to disappear a bit on darker skin. I'll figure it out eventually. (Or I'll bleach her scales when she gets to the back end of Shadowbringers.)
Thank you for the ask!
4 notes
·
View notes
Text
The Science Behind Effective Disease Management in Trees
Trees are usually not just principal formula of our ecosystems; they are also living entities that require care and leadership, noticeably with regards to ailment prevention and healing. Understanding the science in the back of tremendous disorder leadership in trees is the most important for arborists, tree service specialists, and owners alike. This article delves into the complicated data of tree health and wellbeing administration, presenting insights, recommendations, and proven procedures to make sure that your timber stay bright and resilient.

Understanding Tree Diseases: An Overview What Are Tree Diseases?
Tree sicknesses might be labeled broadly into two varieties: infectious illnesses as a result of pathogens (fungi, micro organism, viruses) and non-infectious ailments attributable to environmental components (nutrient deficiencies, mechanical injuries).
The Role of Pathogens
Infectious sicknesses are steadily spread due to spores or contact with infected supplies. For illustration:
Fungal Infections: These can lead to troubles like root rot or leaf blight. Bacterial Infections: Often rationale wilting or cankers on branches.
Understanding those pathogens is needed for imposing the accurate techniques in handling tree healthiness.
Non-Infectious Factors
On any other hand, non-infectious motives can consist of:
Poor soil high quality. Water stress (either too much or too little). Physical break as a consequence of storms or human routine.
Recognizing the signs and symptoms of both sorts of illnesses is a very important first step in beneficial disease control.

The Science Behind Effective Disease Management in Trees
Effective disease management hinges on a scientific realizing of the way bushes have interaction with their ecosystem. This involves recognizing disorder signs and symptoms early and knowing how one can reply accurately.
youtube
Symptoms of Tree Diseases
Identifying warning signs as early as a possibility is vital to superb management. Common signals embrace:
Wilting leaves Discoloration (yellowing or browning) Abnormal boom patterns
By monitoring these warning signs repeatedly, you might take proactive measures prior to a minor subject escalates into a first-rate limitation.
Diagnosis Techniques
Utilizing progressive diagnostic methods can considerably escalate your capacity to deal with http://hdztreeservicesinc.com/ tree illnesses without problems. Some systems include:
Visual Inspection: Regular checks for indications of misery. Soil Testing: To settle on nutrient tiers and discover deficiencies. Laboratory Analysis: Sending samples for professional exam when integral. Preventive Measures for Tree Health
Preventive measures type the backbone of any valuable disorder control method. Here’s how you could possibly put in force them:
youtube
Proper Planting Techniques
Planting bushes successfully sets them up for good fortune from the beginning. Essential advice contain:
Ensuring enough spacing betw
2 notes
·
View notes
Text
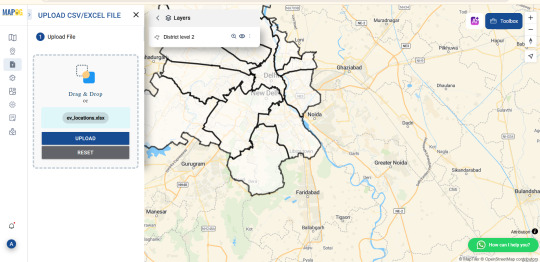
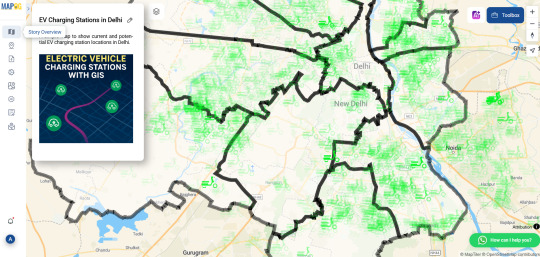
Mapping Electric Vehicle Charging Stations Using GIS
As cities embrace cleaner transportation, the demand for electric vehicle (EV) charging infrastructure is surging. Yet while EVs gain popularity, many urban areas are still figuring out where to place charging stations most effectively. Without careful planning, some neighborhoods end up with clusters of chargers while others are left underserved. That’s where Geographic Information Systems (GIS) come in—offering a smarter, data-driven way to visualize and plan for EV needs.

How GIS Makes the Network Smarter GIS lets you see beyond the street level. By uploading spatial data like traffic density, residential zones, and current EV station locations, urban planners can create layered maps that highlight gaps and overlaps. You can also add custom fields like “charger type” or “station usage” to analyze performance and capacity.
One powerful technique is spatial buffering—drawing influence zones around each station to visualize coverage. Combine this with cross-layer analysis, and you can pinpoint underserved areas based on traffic flow, proximity to major roads, or even power grid access. These insights aren’t just helpful for long-term planning—they’re essential for avoiding grid strain and ensuring accessibility across income groups.
Who’s Using It? Governments, transport planners, and sustainability teams are now turning to GIS to guide EV infrastructure rollouts. Private companies use it to select profitable locations. Utility providers rely on spatial analysis to prepare for increased electricity demand. Even environmental groups and tech startups are tapping into GIS tools to support EV adoption through better planning and advocacy.
Simple, Powerful Mapping Tools You don’t need to be a GIS expert to start mapping. Browser-based platforms like MAPOG are lowering the barrier, allowing users to upload Excel files, style data, and analyze spatial relationships without complicated software installs. Want to compare EV charger density across cities? Or see how charger accessibility overlaps with income levels? Tools like these make that kind of insight easy to visualize—and easier to act on.
Charging Toward a Greener Future The road to sustainability is paved with good data. With GIS tools in hand, EV infrastructure planning becomes more equitable, efficient, and transparent. Whether you're part of a government initiative, a startup, or a local community group, these maps can help you answer a simple but powerful question: where should we build next?
Have you tried mapping EV stations in your city? Upload your data, run some spatial analysis, and see the electrified future unfold—one layer at a time.
2 notes
·
View notes
Text
PPC Training Course: Become a Certified Pay-Per-Click Advertising Expert
Course Overview
In today’s competitive digital marketplace, Pay-Per-Click (PPC) advertising has emerged as one of the most powerful ways to attract highly targeted traffic, generate quality leads, and drive conversions. Whether you are managing a small business campaign or running large-scale enterprise ads, mastering PPC can significantly improve your marketing ROI.
Our Comprehensive PPC Training Course is designed to equip marketers, entrepreneurs, students, and professionals with in-depth knowledge and hands-on experience in paid advertising across leading platforms like Google Ads, Bing Ads, Facebook Ads, and more. This course will help you learn how to craft effective ad campaigns, optimize performance, manage budgets, analyze results, and scale your advertising for maximum profitability.
From keyword selection and bidding strategies to ad copywriting, A/B testing, and conversion tracking, this course covers every essential aspect of PPC advertising in a practical, easy-to-understand format.
Learning Objectives
By the end of this course, participants will be able to:
Understand PPC fundamentals, auction systems, and ad networks.
Create, manage, and optimize campaigns on platforms like Google Ads and Facebook Ads.
Conduct in-depth keyword research and match types selection.
Write compelling ad copy that converts.
Set budgets and bidding strategies effectively.
Track conversions and measure campaign ROI.
Perform A/B testing to optimize ads and landing pages.
Understand Google Ads policies and avoid common mistakes.
Use advanced tools and analytics to make data-driven decisions.
Who Should Take This Course?
This PPC course is ideal for:
Digital marketers looking to master paid advertising
Business owners and entrepreneurs who want to drive more leads and sales
Marketing students and job seekers aiming to build strong PPC expertise
Freelancers and consultants offering PPC services
Content creators, affiliate marketers, and eCommerce sellers
Anyone looking to pass Google Ads certifications or boost their resume
Whether you are a complete beginner or have some experience in online advertising, this course is structured to take you from foundational concepts to advanced techniques.
Course Duration & Format
Total Duration: 4 to 6 Weeks
Mode: Live Online Classes | Self-Paced Videos | In-Person (in select cities)
Class Schedule: 2–3 sessions per week (1.5–2 hours per session)
Assignments & Projects: Weekly exercises and a final live campaign project
Certification: Industry-recognized Certificate of Completion
Participants also receive lifetime access to course materials, templates, and recordings.
Course Modules
Module 1: Introduction to PPC Advertising
What is PPC? How it works
PPC vs. SEO: Key differences and benefits
Understanding ad auctions, quality score, and ad rank
Overview of major platforms: Google Ads, Bing Ads, Facebook/Instagram Ads, LinkedIn Ads
Module 2: Google Ads – Search Network
Account structure: Campaigns, ad groups, and ads
Keyword research tools and techniques (Google Keyword Planner, Ubersuggest, SEMrush)
Match types: Broad, Phrase, Exact, and Negative Keywords
Creating text ads and responsive search ads
Setting up campaigns, budgets, and bidding strategies
Understanding Quality Score and Ad Rank
Best practices for search ad optimization
Module 3: Google Ads – Display & Remarketing
Display Network basics and visual ad formats
Targeting options: audience, contextual, placements
Creating banner ads and HTML5 ads
Setting up remarketing audiences
Display campaign creation and optimization
Retargeting strategies to bring back lost visitors
Module 4: Google Ads – Shopping & YouTube Ads
Google Merchant Center and product feeds
Setting up Smart Shopping and Performance Max campaigns
Introduction to YouTube Ads (TrueView, bumper ads)
Video ad creation and targeting
Budgeting and video ad performance tracking
Module 5: Facebook and Instagram Ads
Setting up a Business Manager and Ad Account
Creating audiences: custom, lookalike, saved audiences
Ad formats: image, carousel, video, story, collection
Campaign objectives: awareness, consideration, conversion
Pixel installation and event tracking
A/B testing and campaign optimization
Budgeting, bidding, and scaling strategies
Module 6: Landing Pages and Conversion Optimization
Importance of a high-converting landing page
Key elements: headline, CTA, visuals, trust signals
Tools for building and testing landing pages (e.g., Unbounce, Leadpages)
A/B testing for ads and landing pages
Reducing bounce rate and improving user experience
Module 7: Analytics, Tracking & Reporting
Conversion tracking setup (Google Ads, GA4, Meta Pixel)
UTM parameters and campaign tagging
Google Analytics integration and goal tracking
Reading reports: impressions, CTR, CPC, CPA, ROAS
Creating custom dashboards and performance reports
Identifying underperforming ads and campaigns
Module 8: Budgeting, Bidding, and Scaling
Manual vs. automated bidding strategies
CPC, CPM, CPA, and ROAS models
Campaign budgeting and forecasting
Scaling campaigns profitably
Avoiding overspending and improving ad efficiency
Module 9: Advanced Strategies and Common Pitfalls
Smart bidding and machine learning in PPC
Audience layering and segmentation
Seasonality and campaign planning
Common mistakes in PPC and how to avoid them
Google Ads policies, ad disapprovals, and account suspensions
Module 10: Capstone Project & Certification
Create a live campaign for a real or mock business
Set up and optimize ads across at least two platforms
Present strategy, results, and learnings
Receive instructor feedback and final assessment
Certificate of Completion + Google Ads exam preparation (optional)
Course Features
Hands-on Practice: Live campaign setup and real-time platform navigation
Industry Tools Covered: Google Ads, Meta Ads Manager, Google Keyword Planner, SEMrush, Canva, Google Analytics 4 (GA4), and more
Templates & Resources: Ad copy templates, budget calculators, performance trackers
Access to PPC Experts: Live Q&A sessions and mentor feedback
Career Guidance: Resume building tips, portfolio development, and job assistance
Certification
All participants who complete the course and pass the final project will receive an Industry-Recognized Certificate. You will also be guided on how to clear the Google Ads Certifications, such as:
Google Ads Search Certification
Google Ads Display Certification
Google Ads Video Certification
Shopping Ads Certification
These certifications are valuable for building credibility as a digital marketing professional or freelancer.
Why Choose Our PPC Training Course?
✅ Up-to-date Curriculum aligned with current ad platform features ✅ Practical & Real-World Focus with live account walkthroughs ✅ Expert Faculty with years of campaign management experience ✅ Free Access to Tools & Templates used by top advertisers ✅ Supportive Community of learners, marketers, and business owners ✅ Flexibility to learn at your own pace or through live instruction
Benefits of PPC Skills in 2025 and Beyond
High demand for PPC specialists across industries
Essential for digital marketing agencies, eCommerce, SaaS, local businesses, and consultants
Control over marketing costs with measurable ROI
Quick visibility and traffic generation compared to organic methods
Adds a high-paying skill to your resume or freelance profile
2 notes
·
View notes
Text


How New NASA, India Earth Satellite NISAR Will See Earth
Set to launch within a few months, NISAR will use a technique called synthetic aperture radar to produce incredibly detailed maps of surface change on our planet.
When NASA and the Indian Space Research Organization’s (ISRO) new Earth satellite NISAR (NASA-ISRO Synthetic Aperture Radar) launches in coming months, it will capture images of Earth’s surface so detailed they will show how much small plots of land and ice are moving, down to fractions of an inch. Imaging nearly all of Earth’s solid surfaces twice every 12 days, it will see the flex of Earth’s crust before and after natural disasters such as earthquakes; it will monitor the motion of glaciers and ice sheets; and it will track ecosystem changes, including forest growth and deforestation.
The mission’s extraordinary capabilities come from the technique noted in its name: synthetic aperture radar, or SAR. Pioneered by NASA for use in space, SAR combines multiple measurements, taken as a radar flies overhead, to sharpen the scene below. It works like conventional radar, which uses microwaves to detect distant surfaces and objects, but steps up the data processing to reveal properties and characteristics at high resolution.
To get such detail without SAR, radar satellites would need antennas too enormous to launch, much less operate. At 39 feet (12 meters) wide when deployed, NISAR’s radar antenna reflector is as wide as a city bus is long. Yet it would have to be 12 miles (19 kilometers) in diameter for the mission’s L-band instrument, using traditional radar techniques, to image pixels of Earth down to 30 feet (10 meters) across.
Synthetic aperture radar “allows us to refine things very accurately,” said Charles Elachi, who led NASA spaceborne SAR missions before serving as director of NASA’s Jet Propulsion Laboratory in Southern California from 2001 to 2016. “The NISAR mission will open a whole new realm to learn about our planet as a dynamic system.”
How SAR Works
Elachi arrived at JPL in 1971 after graduating from Caltech, joining a group of engineers developing a radar to study Venus’ surface. Then, as now, radar’s allure was simple: It could collect measurements day and night and see through clouds. The team’s work led to the Magellan mission to Venus in 1989 and several NASA space shuttle radar missions.
An orbiting radar operates on the same principles as one tracking planes at an airport. The spaceborne antenna emits microwave pulses toward Earth. When the pulses hit something — a volcanic cone, for example — they scatter. The antenna receives those signals that echo back to the instrument, which measures their strength, change in frequency, how long they took to return, and if they bounced off of multiple surfaces, such as buildings.
This information can help detect the presence of an object or surface, its distance away, and its speed, but the resolution is too low to generate a clear picture. First conceived at Goodyear Aircraft Corp. in 1952, SAR addresses that issue.
“It’s a technique to create high-resolution images from a low-resolution system,” said Paul Rosen, NISAR’s project scientist at JPL.
As the radar travels, its antenna continuously transmits microwaves and receives echoes from the surface. Because the instrument is moving relative to Earth, there are slight changes in frequency in the return signals. Called the Doppler shift, it’s the same effect that causes a siren’s pitch to rise as a fire engine approaches then fall as it departs.
Computer processing of those signals is like a camera lens redirecting and focusing light to produce a sharp photograph. With SAR, the spacecraft’s path forms the “lens,” and the processing adjusts for the Doppler shifts, allowing the echoes to be aggregated into a single, focused image.
Using SAR
One type of SAR-based visualization is an interferogram, a composite of two images taken at separate times that reveals the differences by measuring the change in the delay of echoes. Though they may look like modern art to the untrained eye, the multicolor concentric bands of interferograms show how far land surfaces have moved: The closer the bands, the greater the motion. Seismologists use these visualizations to measure land deformation from earthquakes.
Another type of SAR analysis, called polarimetry, measures the vertical or horizontal orientation of return waves relative to that of transmitted signals. Waves bouncing off linear structures like buildings tend to return in the same orientation, while those bouncing off irregular features, like tree canopies, return in another orientation. By mapping the differences and the strength of the return signals, researchers can identify an area’s land cover, which is useful for studying deforestation and flooding.
Such analyses are examples of ways NISAR will help researchers better understand processes that affect billions of lives.
“This mission packs in a wide range of science toward a common goal of studying our changing planet and the impacts of natural hazards,” said Deepak Putrevu, co-lead of the ISRO science team at the Space Applications Centre in Ahmedabad, India.
TOP IMAGE: NASA’s Jet Propulsion Laboratory used radar data taken by ESA’s Sentinel-1A satellite before and after the 2015 eruption of the Calbuco volcano in Chile to create this interferogram showing land deformation. The color bands west of the volcano indicat… Credit: ESA/NASA/JPL-Caltech
CENTRE IMAGE: A SAR image — like ones NISAR will produce — shows land cover on Mount Okmok on Alaska’s Umnak Island. Created with data taken in August 2011 by NASA’s UAVSAR instrument, it is an example of polarimetry, which measures return waves’ orientation relati… Credit: NASA/JPL-Caltech
LOWER IMAGE: A collaboration between NASA and the Indian Space Research Organisation, NISAR will use synthetic aperture radar to offer insights into change in Earth’s solid surfaces, including the Antarctic ice sheet. The spacecraft, depicted here in an artist’s concept, will launch from India. Credit: NASA/JPL-Caltech
3 notes
·
View notes
Text
Data Visualization: Transforming Data into Insight
In an technology wherein information is produced at an remarkable tempo, the ability to extract significant insights is extra vital than ever. Data visualization plays a vital function on this procedure, enabling individuals and corporations to understand complex statistics sets, pick out trends, and communicate findings effectively. By converting abstract numbers into intuitive visuals, information visualization bridges the gap among uncooked data and human cognition, turning complexity into readability.
Data Visualization In Research

The Importance of Data Visualization
Data visualization is the graphical illustration of information and facts. By the use of visible elements like charts, graphs, and maps, statistics visualization tools make it less difficult to see and understand styles, trends, and outliers in facts. Its importance lies in numerous key areas:
Improved Understanding: Visuals are processed 60,000 times faster than textual content by way of the human mind. Graphs and charts can screen insights that would pass omitted in spreadsheets.
Enhanced Communication: Well-crafted visualizations allow statistics to be shared in a manner that’s available to a broader audience, no longer simply records analysts or statisticians.
Data-Driven Decision Making: In enterprise, governments, and medical research, visualizations support selection-making via without a doubt showing the implications of various statistics tendencies.
Pattern and Anomaly Detection: They help users quick become aware of deviations, spikes, or drops in data, which could suggest possibilities or threats.
Types of Data Visualization
Data visualization encompasses a big selection of techniques, each applicable to precise types of records and analytical desires. Some of the most commonly used sorts include:
1. Bar Charts
Bar charts are best for comparing quantities throughout classes. They are simple however effective for displaying differences among agencies.
2. Line Graphs
Often used to music changes over time, line graphs display tendencies and fluctuations, making them a fave for time-series information.
3. Pie Charts
They’re satisfactory for simple, clear percent facts.
4. Histograms
Histograms display the distribution of a dataset, making them beneficial for understanding records spread, crucial tendency, and frequency.
5. Heat Maps
Heat maps use colour gradients to indicate value depth throughout two dimensions.
6. Scatter Plots
Scatter plots are used to pick out relationships between variables, often revealing correlations or clusters in facts.
7. Box Plots
Box plots show the distribution of a dataset thru its quartiles, highlighting medians, variability, and ability outliers.
8. Geospatial Maps
These visualizations display facts associated with geographic regions and are extensively utilized in demographic research, environmental tracking, and logistics.
9. Dashboards
Dashboards integrate multiple visualizations into one interface, supplying a actual-time assessment of key metrics and overall performance signs.
Tools for Data Visualization
A huge range of tools is to be had for growing effective statistics visualizations. Popular alternatives encompass:
Tableau: A leading platform for interactive, shareable dashboards with drag-and-drop functions.
Power BI: Microsoft's enterprise analytics tool with sturdy integration into the Office atmosphere.
Google Data Studio: A unfastened tool for developing customizable reports the use of Google records sources.
Ggplot2: A effective R package for constructing state-of-the-art plots the use of the grammar of snap shots.
Each device gives distinctive competencies depending at the user’s technical information, information complexity, and desired results.
Best Practices in Data Visualization
Creating effective facts visualizations requires more than just technical skill. It includes an information of design ideas, cognitive psychology, and storytelling. Here are key exceptional practices:
1. Know Your Audience
Tailor the visualization to the information stage and pursuits of your target market. What a statistics scientist unearths intuitive is probably complicated to a business executive.
2. Choose the Right Chart
Using an inappropriate chart kind can deceive or confuse the viewer. For instance, a line chart ought to not be used for specific information.
Three. Simplify and Clarify
Avoid muddle. Focus on essential statistics and put off unnecessary elements like immoderate gridlines, decorative snap shots, or redundant labels.
Four. Use Color Thoughtfully
Color can enhance know-how but additionally lie to if used improperly. Stick to a consistent color scheme and use contrasts to highlight key points.
5. Tell a Story
Effective facts visualizations guide the viewer through a story. Highlight tendencies, anomalies, or correlations that support your message.
6. Maintain Integrity
Never manipulate axes or distort scales to magnify findings. Ethical visualization ensures accurate illustration of statistics.
Real-World Applications
Data visualization is applied in nearly each region, transforming industries through stepped forward insight and communication.
1. Business Analytics
In commercial enterprise, visualization tools assist in monitoring sales, client behavior, supply chain efficiency, and extra.
2. Healthcare
In medicinal drug and public health, visualizations are crucial for tracking disorder outbreaks, affected person records, and treatment results. For example, COVID-19 dashboards performed a main function in information the pandemic's unfold.
3. Finance
Financial analysts use records visualization to recognize market tendencies, examine investment overall performance, and check chance.
Four. Education
Educators and researchers use visualization to track pupil performance, perceive mastering gaps, and gift studies findings.
Five. Government and Policy
Policymakers use visible facts to understand social trends, aid allocation, and financial overall performance.
6. Journalism
Data journalism is growing hastily. Visual stories on topics like weather change, election results, or social inequality use charts and infographics to inform and engage readers.
Challenges and Limitations
Despite its electricity, facts visualization isn't with out demanding situations:
Data Quality: Inaccurate or incomplete information can lead to deceptive visuals.
Over-Simplification: Trying to make information too easy can lead to lack of nuance or important info.
Misinterpretation: Poor design selections or biased displays can cause audiences to draw wrong conclusions.
Tool Limitations: Not all equipment aid the extent of customization or interactivity wished for unique projects.
Overcoming these demanding situations requires a mix of technical talent, area information, and moral responsibility.
The Future of Data Visualization
The future of statistics visualization is increasingly interactive, actual-time, and AI-assisted. Emerging traits include:
Augmented and Virtual Reality (AR/VR): Immersive visualizations permit users to explore records in three-dimensional environments.
Machine Learning Integration: Algorithms can now endorse or even vehicle-generate visualizations based on the information furnished.
Collaborative Platforms: Teams can now work collectively in actual time on visualization dashboards, improving communique and agility.
These advancements will hold to make records greater accessible and insightful throughout all domain names.
Difference Between Augmented Reality (AR) and Virtual Reality (VR)
What Is Data Analysis In Research
2 notes
·
View notes
Text
LEARN ABOUT IMAGE PROCESSING
Image fusion is a process where two or more images are combined to create a single, more informative or visually enhanced image. This technique is used in various fields like photography, remote sensing, medical imaging, and computer vision. The goal of image fusion is to enhance the overall quality of the final image by combining information from multiple sources while retaining the most relevant details.

Types of Image Fusion: Pixel-Level Fusion: This involves combining pixel values from different images to create a new image. The images are typically of the same scene or subject taken under different conditions.

The algorithms learn from the patterns based on the training data with particular parameters. However, we can always fine-tune the trained model based on the performance metrics. Lastly, we can use the trained model to make new predictions on unseen data.
#image description in alt#ai image#image#image processing#3d printing#3d image processing#ppt image#technoart#techno design#technoland expert#technoland facts#techno animation#ppt image process#adobe#photoshop#illustrator
6 notes
·
View notes
Text

Patch 1.1.0 is out -- NOW ON STEAM! Just in time for the holidays! Other PC platforms (EGS, GOG, Stove) will follow in due time. However, due to various development circumstances, we could not get this new patch ready for console porting in time before the holidays. We will inform you more later when we are better aware of the release timeline for consoles - so we ask for your patience.
Without further ado though, here are the Patch Notes for Gravity Circuit 1.1.0:
New features
Boss Rush: Guardian Corps HQ now features Combat Memory Bank, a computer which lets you refight any of the game's bosses at your leisure. Good for practice, or for chasing record times!
Armor paints: Prim, a painter NPC that hangs around in the Guardian Corps HQ, now offers swappable armor paints, allowing further customization! These armor paints each bestow new abilities or effects, so give them all a try! Prim will explain to you how to unlock the paints to her shop.
Quality of life additions
Loadout swap: A dedicated button for quickly swapping loadouts on the fly. During gameplay any unset or empty loadouts are skipped when the button is pressed, so you can choose to use only two loadout slots, or all three.
Slide: A dedicated button has been added for sliding. Down and jump will still continue to work, but this button may be useful for those who need it.
Hookshot - vertical: A dedicated button that locks the hookshot's aim only to upwards vertical directions. This may help with any platforming involving the hookshot, for those who might need it.
Mouse control mapping: You can now map mouse buttons on PC, in addition to keyboard keys.
Effect Timer: An additional toggle setting has been added to the game's system options menu. This toggle adds on-screen visuals for certain effect durations, removing ambiguity. This setting is enabled by default, but can be toggled off at any time.
Burst techniques
Cycle Kick: In-game shop price reduced from 2000 to 1500.
Surface Render: In-game shop price reduced from 2000 to 1500.
Gravity Freeze: Affected area increased, damage slightly increased.
Piercing Drill: The chain portion now also damages enemies, not just the tip, making the technique easier to use effectively.
Flying Strike: Fixed an issue involving the Speedrun Mode, where it was possible to accidentally skip acquiring the technique by saving and quitting during the Opening Stage (Central Station). It was still possible to buy the technique, but Flying Strike is intended to be given to the player for free.
Gameplay
Pass-through platforms: Kai can now gain sprinting speed by holding the run button (or having "inverse" run button behavior enabled) when dropping through pass-through platforms.
Sprint jumping when hugging walls: Previously, if Kai was hugging a wall while grounded (holding left/right while up against a wall), Kai would be unable to gain sprinting speed when the run button was held (or having "inverse" run button behavior enabled) when jumping. This behavior has been fixed.
Hopkick: Kai's hopkick (up+attack while grounded) has been sped up by a few frames based on player feedback.
Telefragging: When Kai is struck by a hazard (lava, spikes, crushing), Kai will perform an Emergency Warp to last safe ground. Because this behavior could sometimes lead to Kai respawning inside an enemy, Kai now automatically defeats any enemy around him.
Data chips
"NPC" type data chips: Research cost reduced from 150 to 100.
Stage changes
Highway: Fixed an issue where it was possible to skip over the stage's checkpoints with certain actions.
Ore Mines: Fixed a certain area not having correct camera triggers when entering it in a specific way.
Guardian Corps HQ (visuals): Additional sign has been added to hint towards the location of the training facilities.
Guardian Corps HQ (design): Additional platforms added to make reaching the Training Room easier.
Guardian Corps HQ (training room): When Dave the Training Dummy is hit, the Training Room door will be inoperable for a few seconds. This is to prevent players from accidentally exiting the room while performing combos.
Guardian Corps HQ (NPCs): "Prim" and "Shock" NPCs have switched places. Their dialogue has been adjusted slightly to match these changes.
Final stage: Additional respawn points added in a certain section.
Localization
Chinese: A certain scene had an issue where the talking characters were accidentally reversed, and there were other issues involving few untranslated words. This has been fixed.
English: Fixed a slight typo in Pat's dialogue.
Misc
macOS: Loading times improved by changing some code, that made some of the game's threads run slower on systems with M1 chips.
Speedrun Mode: If the in-game timer is enabled from the game's system settings, Speedrun Mode is enabled by default when launching the game (if Speedrun Mode has been unlocked). This is so that speedrunners do not need to remember to toggle this setting every time they launch the game.
General code performance: Slight improvements across the board in various places, that cumulatively help the game run more smoothly on lower end hardware.
23 notes
·
View notes
Text
Mortal Kombat's Sexualized Approach to Character Design
BLOG 7: Exoticism and Sexualization in Game Media
I turned to Mortal Kombat as a surprising and comforting release for my pent-up frustrations during the turbulent times of my adolescence. I found a therapeutic release from the difficulties and rage that surrounded me in the visceral world of fatalities and brutalities. I had no idea that beneath the surface of this legendary game was a rich tapestry of themes that I would not fully comprehend until much later.
I didn't start looking at the Mortal Kombat characters through a different lens until we got to talking about exoticism and sexualization. The very characters I controlled on screen, delivering vicious finishes, abruptly transcended the status of avatars and became representations of a widespread cultural phenomenon. This insight led me to set out on an investigative quest to analyze the complex interactions between exoticism and sexualization in the framework of a game that served as both a significant source of entertainment and a turning point in my coming-of-age story.

About Mortal Kombat
The 1992 arcade game Mortal Kombat, created by Ed Boon and John Tobias, introduced a revolutionary fusion of martial arts, fantasy, and digital graphics. Its popularity made way for more entries, ensuring its place in the gaming industry as a flagship franchise.
Mortal Kombat changed as time went on, embracing new storytelling techniques and technological breakthroughs. A pixelated fight turned into a cinematic experience with deep character arcs and narratives that drew players in and kept them interested beyond the boundaries of a normal fighting game.
Academic Standpoint
For a number of decades, academic discourse has focused on the intersection of gender representation and media, especially in the context of video games. The criticism of media representations that sexually objectify women has its origins in the 1970s, as Busby (1975) and other scholars have pointed out. (Ward, 2016)
Different definitions of sexual objectification have been offered within this scholarly framework. It explores the division of bodies, body parts, or sexual functions from one's identity and goes beyond the simple visual depiction of individuals. Sexual objectification reduces people to being nothing more than tools, existing mainly for the enjoyment and use of other people. Treating people as though their bodies are the only thing that can truly represent them is part of this dehumanizing process. (Ward, 2016)
Examining current beauty standards is an important part of the conversation about sexual objectification. According to research, there are certain standards of beauty for women in relation to American men. These standards frequently dictate a particular body type, such as slender and short or rounded and curved. The idealized female form consists of a bell-shaped lower torso, rounded arms, sloping shoulders, and a small waist tucked between a rounded bosom. The extremities are also examined, including the small, delicate feet and the hands with tapering fingers. The idealized complexion is described as white, and if colored, it may occasionally have a pink flush to the cheeks. (Mazur, 1986)
Character Case Studies
The case study is only focusing on women being sexualized in the game. It is not suggesting that women are the only characters which are sexualized in the game, it could be otherwise, and the data related to it will be absent in this post.


Just for the sake of this study we are going to consider three characters, namely Mileena, Kitana and Jade from Mortal Kombat.
The physical allure of Kitana, Jade, and Mileena adheres gracefully to conventional beauty standards, characterized by a fair or wheat-ish complexion and a harmonious balance between a slender, muscular physique. Each character embodies the timeless elegance of a bell-shaped lower torso, complemented by wider hips and a gracefully narrow waist, effectively encapsulating a universally accepted archetype of femininity. Their statuesque height further refines their curves, seamlessly harmonizing with established beauty norms.
Kitana, Jade, and Mileena's wardrobe choices are always form-fitting garments that skillfully draw attention to their figures' contours, combining martial skill with appealing beauty. Their purposeful use of form-fitting apparel draws attention to their defined curves and muscularity. The purposefully crafted costumes with well-placed openings that reveal skin with a deft artistic touch are what really catch the eye. The characters' visual appeal is enhanced by the meticulous creation, which also plays a significant role in the exoticization and sexualization of the characters by skillfully fusing sensuality into their combat personas. It's important to note how their wardrobe has changed over time, with some costumes gradually baring more skin, demonstrating the franchise's flexibility in response to shifting fashion trends and cultural quirks.
Conclusion
The Mortal Kombat characters Kitana, Jade, and Mileena represent a fascinating blend of conscious design choices and traditional beauty standards in the game's intricate weaving. Their pale skin tones, toned bodies, and balanced outlines capture both the traditional values and the changing aesthetic of the Mortal Kombat world. Beyond simple combat aesthetics, the deft combination of form-fitting clothing and well-placed gaps in their costumes reveals a complex interaction between exoticization and sexualization. As the characters' looks change over time, Mortal Kombat transforms into a dynamic canvas that adapts to shifting beauty standards and cultural quirks. Past the deaths and violence is a space for gaming, introspection, and scholarly conversation that provides an in-depth examination of societal narratives, identity, and representation in the gaming industry.
References
Ward, L.M. (2016) 'Media and Sexualization: State of Empirical Research, 1995–2015,' Journal of Sex Research, 53(4–5), pp. 560–577. https://doi.org/10.1080/00224499.2016.1142496.
Mazur, A. (1986) 'U.S. trends in feminine beauty and overadaptation,' Journal of Sex Research, 22(3), pp. 281–303. https://doi.org/10.1080/00224498609551309.
#pc games#game#game art#game design#game theory#video games#gaming#videogame#gamers#fighting games#mortal kombat#jade#kitana#mortal kombat 1#mileena#character design#character art#fashion#sexualization#exoticism#game studies
18 notes
·
View notes
Text
Short-Term vs. Long-Term Data Analytics Course in Delhi: Which One to Choose?

In today’s digital world, data is everywhere. From small businesses to large organizations, everyone uses data to make better decisions. Data analytics helps in understanding and using this data effectively. If you are interested in learning data analytics, you might wonder whether to choose a short-term or a long-term course. Both options have their benefits, and your choice depends on your goals, time, and career plans.
At Uncodemy, we offer both short-term and long-term data analytics courses in Delhi. This article will help you understand the key differences between these courses and guide you to make the right choice.
What is Data Analytics?
Data analytics is the process of examining large sets of data to find patterns, insights, and trends. It involves collecting, cleaning, analyzing, and interpreting data. Companies use data analytics to improve their services, understand customer behavior, and increase efficiency.
There are four main types of data analytics:
Descriptive Analytics: Understanding what has happened in the past.
Diagnostic Analytics: Identifying why something happened.
Predictive Analytics: Forecasting future outcomes.
Prescriptive Analytics: Suggesting actions to achieve desired outcomes.
Short-Term Data Analytics Course
A short-term data analytics course is a fast-paced program designed to teach you essential skills quickly. These courses usually last from a few weeks to a few months.
Benefits of a Short-Term Data Analytics Course
Quick Learning: You can learn the basics of data analytics in a short time.
Cost-Effective: Short-term courses are usually more affordable.
Skill Upgrade: Ideal for professionals looking to add new skills without a long commitment.
Job-Ready: Get practical knowledge and start working in less time.
Who Should Choose a Short-Term Course?
Working Professionals: If you want to upskill without leaving your job.
Students: If you want to add data analytics to your resume quickly.
Career Switchers: If you want to explore data analytics before committing to a long-term course.
What You Will Learn in a Short-Term Course
Introduction to Data Analytics
Basic Tools (Excel, SQL, Python)
Data Visualization (Tableau, Power BI)
Basic Statistics and Data Interpretation
Hands-on Projects
Long-Term Data Analytics Course
A long-term data analytics course is a comprehensive program that provides in-depth knowledge. These courses usually last from six months to two years.
Benefits of a Long-Term Data Analytics Course
Deep Knowledge: Covers advanced topics and techniques in detail.
Better Job Opportunities: Preferred by employers for specialized roles.
Practical Experience: Includes internships and real-world projects.
Certifications: You may earn industry-recognized certifications.
Who Should Choose a Long-Term Course?
Beginners: If you want to start a career in data analytics from scratch.
Career Changers: If you want to switch to a data analytics career.
Serious Learners: If you want advanced knowledge and long-term career growth.
What You Will Learn in a Long-Term Course
Advanced Data Analytics Techniques
Machine Learning and AI
Big Data Tools (Hadoop, Spark)
Data Ethics and Governance
Capstone Projects and Internships
Key Differences Between Short-Term and Long-Term Courses
FeatureShort-Term CourseLong-Term CourseDurationWeeks to a few monthsSix months to two yearsDepth of KnowledgeBasic and Intermediate ConceptsAdvanced and Specialized ConceptsCostMore AffordableHigher InvestmentLearning StyleFast-PacedDetailed and ComprehensiveCareer ImpactQuick Entry-Level JobsBetter Career Growth and High-Level JobsCertificationBasic CertificateIndustry-Recognized CertificationsPractical ProjectsLimitedExtensive and Real-World Projects
How to Choose the Right Course for You
When deciding between a short-term and long-term data analytics course at Uncodemy, consider these factors:
Your Career Goals
If you want a quick job or basic knowledge, choose a short-term course.
If you want a long-term career in data analytics, choose a long-term course.
Time Commitment
Choose a short-term course if you have limited time.
Choose a long-term course if you can dedicate several months to learning.
Budget
Short-term courses are usually more affordable.
Long-term courses require a bigger investment but offer better returns.
Current Knowledge
If you already know some basics, a short-term course will enhance your skills.
If you are a beginner, a long-term course will provide a solid foundation.
Job Market
Short-term courses can help you get entry-level jobs quickly.
Long-term courses open doors to advanced and specialized roles.
Why Choose Uncodemy for Data Analytics Courses in Delhi?
At Uncodemy, we provide top-quality training in data analytics. Our courses are designed by industry experts to meet the latest market demands. Here’s why you should choose us:
Experienced Trainers: Learn from professionals with real-world experience.
Practical Learning: Hands-on projects and case studies.
Flexible Schedule: Choose classes that fit your timing.
Placement Assistance: We help you find the right job after course completion.
Certification: Receive a recognized certificate to boost your career.
Final Thoughts
Choosing between a short-term and long-term data analytics course depends on your goals, time, and budget. If you want quick skills and job readiness, a short-term course is ideal. If you seek in-depth knowledge and long-term career growth, a long-term course is the better choice.
At Uncodemy, we offer both options to meet your needs. Start your journey in data analytics today and open the door to exciting career opportunities. Visit our website or contact us to learn more about our Data Analytics course in delhi.
Your future in data analytics starts here with Uncodemy!
2 notes
·
View notes
Text
Mastery Journal Entry: Reflecting on Business Venture Research Class
Going into m Business Venture Research class, my main goal was to get the understanding of how to properly do research and learn the different research methods while learning and evaluating how to launch a successful business. I was using this class as a way to develop the skills I needed to be in marketing, and how to learn about the trends within my writing industry. I also wanted to learn about the structure of my own business idea with using real data from people who already did the research, and I just had to find it to see how well I would pair off in my field.
Needless to say, this course met my expectation because it equipped me with the tools on how to conduct research with valid resources on different aspects of my writing business. I looked at many different case studies, I read different articles, and the assignments I did helped me assess the market demand and how I should refine my business model to make it better, and how to make it stand out above the others.
The key takeaway from this course would be how important it is to actually do research and make sure its thorough before putting your business out there. You want to make sure you stay on top trends and that there is a demand in the market for your business. Some of the readings I found extremely useful would be:
The Five Cs of Opportunity Identification: The five Cs would be Customer needs, competition, context, and capabilities. These principles had given me a structured format to visualize when creating my business idea.
Business Research Methods by Naval Bajpai: Specifically I want to talk about chapter 1. The chapter went over the differences between basic and applied research. The purpose of these two types of research is to help you decide to develop or contribute your knowledge. It went over the importance of the techniques and procedures for doing the research.
Startup Opportunities by Brad Feld and Sean Wise: This is another noteworthy resource I found helpful. In Chapter 3 it talks about the criteria for an opportunity. An idea but be durable, timely, attractive and it has to add value to the buyer. If it doesn't meet these four criteria's then there is no opportunity, and it won't be successful.
The Lean Startup by Eric Ries: This reading had given me an understanding about the methodology of the Lean Startup. It had focused on creating products and get feedback from customers so that we could better our business and products. This approach would be essential or me simply because with my content creation I want to create content people want, and in order to do that I would need to gather my reader's and clients feedback. It's essential to my success.
In my business, I would utilize the skills I learned in this class and apply al of the research methods and evaluations so that I can make my freelance business better and more appealing to my clients. More importantly, I would utilize the Five Cs of Opportunity Identification so I can better understand the market, trends, clients, and my readers. This would help strengthen my confidence in my ability to do proper research but also help me gain the knowledge for my writing. This class has helped me make better decisions and gave me the kills I needed to help me during my decision-making process and how to properly find opportunities for my business.
Mastery Journal
4 notes
·
View notes
Text
Metal Bringer launches this winter - Gematsu
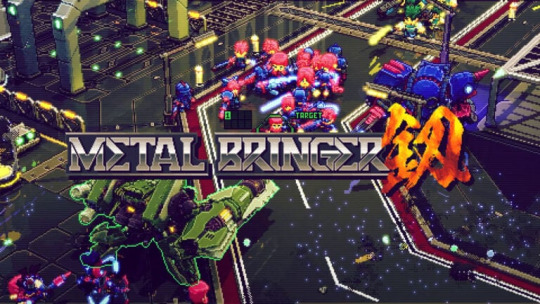
Roguelite action game Metal Bringer will launch for PlayStation 5 and PC via Steam this winter, publisher PLAYISM and developer Alphawing announced.
Here is an overview of the game, via PLAYISM:
About
Samurai Bringer, Alphawing’s previous game, is a Japanese roguelite action game released in 2022, where you play as Susanoo and defeat world-famous Japanese samurai as you collect combat techniques to create your own fighting style. It has received over 800 reviews on Steam with a Very Positive rating. Metal Bringer is the second game in the Bringer series, and this time, the setting is completely different—in this game, you fight in a science-fiction world with androids and giant robots in horde-based combat that’s even more satisfying than the last game, and of course, your combat actions will evolve as you fight.
The Story
“The sky is blue, infinitely high, and infinitely vast… Whose words were these again…? Ah, I remember… It was about a virtual reality Rudra told me about. A fairy tale. How many years has it been since humanity took refuge underground? No one alive has ever seen a blue sky. And now, I’m trapped in the depths, in a small, lifeless room. Just how long have I been here…?” A young girl named Suria wakes up in a laboratory and finds out that she has been put in cyrosleep for 1000 years without her knowledge. In order to search for the rest of humanity, she builds Labor with her trusty Buds, and sends them off to investigate…
Highly Customizable Player Characters and Arms
Build and control android soldiers called “Labor”, or have them pilot giant machines called “Arms”. Each and every Labor and Arms you build is highly customizable. You can change the color and appearance of their features, or swap out parts to change their fighting styles. The sheer variety in character customization will allow you to create and fight with the mech of your dreams.
The More You Play, the Stronger You Get
Labors can be strengthened by installing over 150 different types of apps. Apps can be obtained by defeating enemies, but you lose all installed apps when you fall in battle. However, by analyzing an app’s data, you can carry it over to your next Labor, allowing you to perform better each run until you can freely trample all over your opponents with ease.
Obtain Enemy Arms Parts on the Go
Even the most powerful Arms will eventually wear down, but when that happens, you can use Arms parts left behind by the enemy. What’s more, you can analyze the blueprints of powerful Arms parts over the course of the game, which unlocks various customization options.
New Technologies, Both Visual and Audio
This game uses the same retro art style as Samurai Bringer, but just like Samurai Bringer, it also implements a real time pixel art generating system, and will also feature the newest raytracing technology for beautifully lit environments. The music too is made with the newest technology, as it is played in real time and changes according to the situation.
Character Designs by Suzuhito Yasuda
The protagonist Suria and the keyart were designed by Suzuhito Yasuda, and on the writing team, we have Sami Shinosaki on board! The pixel art portraits for Suria are drawn by illustrator kutsuwa.
Suzuhito Yasuda (Twitter) – Illustrator, manga artist, and character designer for multiple popular games and media, such as Durarara!! and the Shin Megami Tensei: Devil Survivor series. Creator of the ongoing manga series Bootsleg and Yozakura Quartet (serialized in Monthly Shonen Sirius).
Sami Shinosaki – Novelist. Known for the novelizations of the Armored Core and Fire Emblem series.
Word from the Developer: Takahama Makoto from Alphawing
Hi, I’m Takahama, the development director of Metal Bringer. It’s been one year since we announced the game during last year’s PLAYISM Game Show, and in order to fully realize our original concepts, we’ve scrapped and rebuilded the game many times to improve it. At first, you might struggle to survive with your weak Labor and slow Arms, but gradually, you’ll gain more and more power until you eventually become unstoppable, with incredible mobility to match. This game is one where you can experience the thrill and satisfaction of growing stronger. We’re preparing a new playable demo right now, which will be showcased at PAX West 2024 and Tokyo Game Show 2024. Please stop by to try it out!
Watch a new trailer below. View a new set of screenshots at the gallery.
Release Window Trailer
English
youtube
Japanese
youtube
6 notes
·
View notes