
Statistics
We looked inside some of the posts by themamaps and here's what we found interesting.
Average Info
Notes Per Post
14
Likes Per Post
14
Reblog Per Post
0
Reply Per Post
0
Time Between Posts
4 days
Number of Posts By Type
Photo
16
Text
1
Last Seen Tumblr Blogs


Fun Fact
The total number of visits Tumblr.com received during January 2021 is 327 million.
Photo

The climate crisis is an existential threat to life on Earth. To reduce the magnitude of the crisis’ impacts, we must limit global warming to 1.5°C, as decided in the Paris Agreement. Only decisive action will reduce greenhouse gas emissions, which are responsible for climate change. Source: CCPI #climatecrisis #climatechange #climateaction #climateemergency #climate #globalwarming #environment #sustainability #climatejustice #climatechangeisreal #savetheplanet #climatestrike #nature #fridaysforfuture #ecofriendly #earth #zerowaste #noplanetb #sustainableliving #sustainable #gogreen #gretathunberg #extinctionrebellion #climateactionnow #cop #pollution #plasticfree #actnow #savetheearth #saveourplanet https://www.instagram.com/p/CiH2G1Dsl3G/?igshid=NGJjMDIxMWI=
#climatecrisis#climatechange#climateaction#climateemergency#climate#globalwarming#environment#sustainability#climatejustice#climatechangeisreal#savetheplanet#climatestrike#nature#fridaysforfuture#ecofriendly#earth#zerowaste#noplanetb#sustainableliving#sustainable#gogreen#gretathunberg#extinctionrebellion#climateactionnow#cop#pollution#plasticfree#actnow#savetheearth#saveourplanet
8 notes
·
View notes
Photo
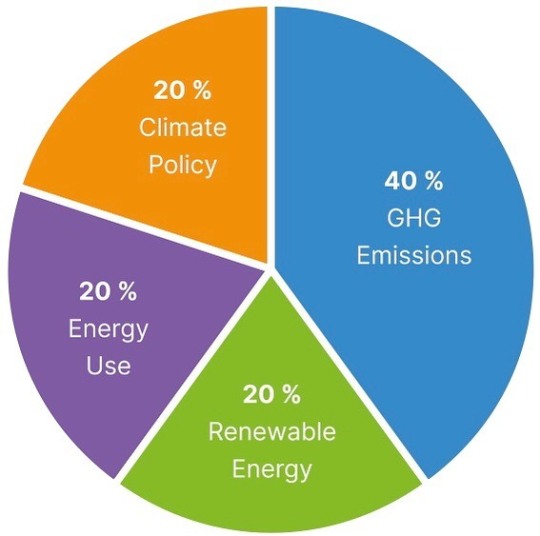
The climate crisis is an existential threat to life on Earth. To reduce the magnitude of the crisis’ impacts, we must limit global warming to 1.5°C, as decided in the Paris Agreement. Only decisive action will reduce greenhouse gas emissions, which are responsible for climate change. As an independent monitoring tool, the CCPI has a leading role in informing on the Paris Agreement’s implementation phase. Since 2005, the CCPI has provided analysis of countries’ climate protection performance. It creates transparency in climate policy, makes it possible to compare climate protection efforts, and lets you see progress and setbacks. #climatecrisis #climatechange #climateaction #climateemergency #climate #globalwarming #environment #sustainability #climatejustice #climatechangeisreal #savetheplanet #climatestrike #nature #fridaysforfuture #ecofriendly #earth #zerowaste #noplanetb #sustainableliving #sustainable #gogreen #gretathunberg #extinctionrebellion #climateactionnow #cop #pollution #plasticfree #actnow #savetheearth #saveourplanet https://www.instagram.com/p/CiH2G1Dsl3G/?igshid=NGJjMDIxMWI=
#climatecrisis#climatechange#climateaction#climateemergency#climate#globalwarming#environment#sustainability#climatejustice#climatechangeisreal#savetheplanet#climatestrike#nature#fridaysforfuture#ecofriendly#earth#zerowaste#noplanetb#sustainableliving#sustainable#gogreen#gretathunberg#extinctionrebellion#climateactionnow#cop#pollution#plasticfree#actnow#savetheearth#saveourplanet
0 notes
Photo

Rising Seas Will Erase More Cities by 2050 New Research, New Research Shows By Denise Lu and Christopher Flavelle. Rising seas could affect three times more people by 2050 than previously thought , according to new research , threatening to all but erase some of the world's great coastal cities. The authors of a paper published Tuesday developed a more accurate way of calculating land elevation based on satellite readings , a standard way of estimating the effects of sea level rise over large areas , and found that the previous numbers were far too optimistic . The new research shows that some 150 million people are now living on land that will be below the high tide line by midcentury. #globalwarming #climatechange #environment #savetheplanet #nature #sustainability #climatecrisis #climate #ecofriendly #climateaction #earth #gogreen #zerowaste #climatechangeisreal #green #climateemergency #pollution #recycle #plasticfree #sustainable #climatestrike #eco #fridaysforfuture #savetheearth #sustainableliving #climatejustice #saveearth #gretathunberg #saveourplanet #noplanetb https://www.instagram.com/p/CgzMsFQMwn5/?igshid=NGJjMDIxMWI=
#globalwarming#climatechange#environment#savetheplanet#nature#sustainability#climatecrisis#climate#ecofriendly#climateaction#earth#gogreen#zerowaste#climatechangeisreal#green#climateemergency#pollution#recycle#plasticfree#sustainable#climatestrike#eco#fridaysforfuture#savetheearth#sustainableliving#climatejustice#saveearth#gretathunberg#saveourplanet#noplanetb
2 notes
·
View notes
Photo

Global Warming The Earth is warming up, and humans are at least partially to blame. The causes, effects, and complexities of global warming are important to understand so that we can fight for the health of our planet. Global warming is the long-term warming of the planet’s overall temperature. Though this warming trend has been going on for a long time, its pace has significantly increased in the last hundred years due to the burning of fossil fuels. As the human population has increased, so has the volume of fossil fuels burned. Fossil fuels include coal, oil, and natural gas, and burning them causes what is known as the “greenhouse effect” in Earth’s atmosphere. The greenhouse effect is when the Sun’s rays penetrate the atmosphere, but when that heat is reflected off the surface cannot escape back into space. Gases produced by the burning of fossil fuels prevent the heat from leaving the atmosphere. These greenhouse gasses are carbon dioxide, chlorofluorocarbons, water vapor, methane, and nitrous oxide. The excess heat in the atmosphere has caused the average global temperature to rise overtime, otherwise known as global warming. Global warming has presented another issue called climate change. Sometimes these phrases are used interchangeably, however, they are different. Climate change refers to changes in weather patterns and growing seasons around the world. It also refers to sea level rise caused by the expansion of warmer seas and melting ice sheets and glaciers. Global warming causes climate change, which poses a serious threat to life on earth in the forms of widespread flooding and extreme weather. Scientists continue to study global warming and its impact on Earth. BY NATIONAL GEOGRAPHIC #globalwarming #climatechange #environment #savetheplanet #nature #sustainability #climatecrisis #climate #ecofriendly #climateaction #earth #gogreen #zerowaste #climatechangeisreal #green #climateemergency #pollution #recycle #plasticfree #sustainable #climatestrike #eco #fridaysforfuture #savetheearth #sustainableliving #climatejustice #saveearth #gretathunberg #saveourplanet #noplanetb https://www.instagram.com/p/CgwAVMlM7gp/?igshid=NGJjMDIxMWI=
#globalwarming#climatechange#environment#savetheplanet#nature#sustainability#climatecrisis#climate#ecofriendly#climateaction#earth#gogreen#zerowaste#climatechangeisreal#green#climateemergency#pollution#recycle#plasticfree#sustainable#climatestrike#eco#fridaysforfuture#savetheearth#sustainableliving#climatejustice#saveearth#gretathunberg#saveourplanet#noplanetb
0 notes
Photo

A new study provides a solid evidence for global warming Ocean energy budget estimated by Cheng et al. 2017. The 93% of the energy imbalance observed from the top of atmosphere is shown in yellow. Global warming is driven by the Earth's energy imbalance (EEI): our planet traps more and more heat due to continuous increasing greenhouse gases. From the energy perspective, the global warming is actually ocean warming, since ocean stores more than 90% of the trapped heat. Therefore, ocean heat content (OHC) change is a fundamental indicator of global warming, thus direct measurement of OHC will provide a direct evidence for climate change. By Zheng Lin Institute of Atmospheric Physics, Chinese Academy of Sciences https://www.instagram.com/p/CgXehwGMF7b/?igshid=NGJjMDIxMWI=
0 notes
Text
Global surface temperature change 1880-2021
The 'climate spiral' is a visualization designed by climate scientist Ed Hawkins.
#global warming#climateemergency#climatechange#globalwarming#savetheplanet#climate#climatechangeisreal#climatecrisis#warming up#breaking news#renewables#renewableenergy#solarenergy
0 notes
Photo

Energy use per person, 2020 Energy use not only includes electricity, but also other areas of consumption including transport, heating and cooking. Note: Energy refers to primary energy – the energy input before the transformation to forms of energy for end-use (such as electricity or petrol for transport). #cleanenergy #energy #solar #renewableenergy #renewables #power #future #clean #support #wind #solarpower #world #jobs #projects #climatechange #solarenergy #business #gas #windpower #bank #climateaction #light #green #climate #co2 #news #oil #petrol https://www.instagram.com/p/CgMdqX_oOEx/?igshid=NGJjMDIxMWI=
#cleanenergy#energy#solar#renewableenergy#renewables#power#future#clean#support#wind#solarpower#world#jobs#projects#climatechange#solarenergy#business#gas#windpower#bank#climateaction#light#green#climate#co2#news#oil#petrol
0 notes
Photo

Primary energy annual consumption, 2020 Primary energy consumption is measured in terawatt-hours (TWh). Source: BP Statistical Review of World Energy; and EIA Note: Data includes only commercially-traded fuels (coal, oil, gas), nuclear and modern renewables. It does not include traditional biomass. #cleanenergy #energy #solar #renewableenergy #renewables #power #future #clean #support #wind #solarpower #world #jobs #projects #climatechange #solarenergy #business #gas #windpower #bank #climateaction #light #green #climate #co2 #news #oil #worldmap #geography #mapping https://www.instagram.com/p/CgHNM0II0mX/?igshid=NGJjMDIxMWI=
#cleanenergy#energy#solar#renewableenergy#renewables#power#future#clean#support#wind#solarpower#world#jobs#projects#climatechange#solarenergy#business#gas#windpower#bank#climateaction#light#green#climate#co2#news#oil#worldmap#geography#mapping
0 notes
Photo

The world’s energy problem, 2020 The world faces two energy problems: most of our energy production still produces greenhouse gas emissions, and hundreds of millions lack access to energy entirely. by Max Roser December 10, 2020 The world lacks safe, low-carbon, and cheap large-scale energy alternatives to fossil fuels. Until we scale up those alternatives the world will continue to face the two energy problems of today. The energy problem that receives most attention is the link between energy access and greenhouse gas emissions. But the world has another global energy problem that is just as big: hundreds of millions of people lack access to sufficient energy entirely, with terrible consequences to themselves and the environment. #emissions #climatechange #environment #sustainability #climatecrisis #pollution #climate #carbon #globalwarming #climateaction #cleanenergy #maintenance #carbonfootprint #energy #diagnostics #co2 #cars #climateemergency #sustainable #engine #clean #ecofriendly #diesel #gogreen #airpollution #performance #smogtest #smallbusiness #servicing #prevention https://www.instagram.com/p/CgEhiOPoHnU/?igshid=NGJjMDIxMWI=
#emissions#climatechange#environment#sustainability#climatecrisis#pollution#climate#carbon#globalwarming#climateaction#cleanenergy#maintenance#carbonfootprint#energy#diagnostics#co2#cars#climateemergency#sustainable#engine#clean#ecofriendly#diesel#gogreen#airpollution#performance#smogtest#smallbusiness#servicing#prevention
0 notes
Photo
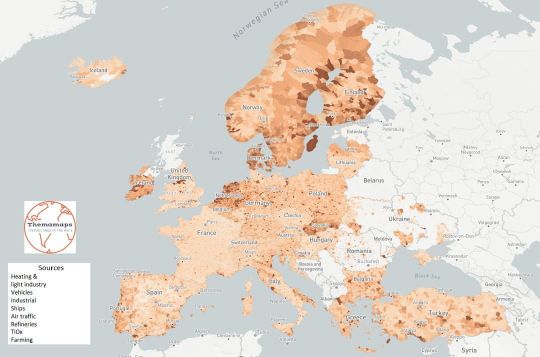
Estimating CO2 emissions for 108 000 European cities (at the municipal level) An overview of the results for Europe is shown in map. Some noteworthy features are the high emissions in the coastal Netherlands, associated with marine activity, and the high emissions from the island of Gotland in the Baltic Sea, driven by one large cement facility there. Emissions in France are remarkably concentrated into a few, primarily coastal, cities. One limitation which must be kept in mind when looking at the results at the municipal level is that municipalities vary in size between countries. In continental Europe municipalities are quite small, while in the Scandinavian countries the most local administrative units are relatively large and thus aggregate more emissions and are more visually prominent. Population per administrative area was estimated by overlaying the administrative boundary on the GHS-POP gridded population map. Gray areas indicate areas where no model results are available. In some cases (as seen for example in Ukraine and Romania) the administrative regions at that level are not exhaustive Darker colors (browns, purples) indicate higher emissions (absolute values can be found at the website http://openghgmap.net, last access: 7 February 2022). #climatechange #environment #sustainability #nature #globalwarming #savetheplanet #climate #climatecrisis #ecofriendly #climateaction #zerowaste #sustainable #earth #gogreen #climatechangeisreal #plasticfree #green #sustainableliving #climateemergency #recycle #eco #pollution #fridaysforfuture #climatejustice #climatestrike #covid #vegan #renewableenergy #water #photography https://www.instagram.com/p/CgCDnPPIVZQ/?igshid=NGJjMDIxMWI=
#climatechange#environment#sustainability#nature#globalwarming#savetheplanet#climate#climatecrisis#ecofriendly#climateaction#zerowaste#sustainable#earth#gogreen#climatechangeisreal#plasticfree#green#sustainableliving#climateemergency#recycle#eco#pollution#fridaysforfuture#climatejustice#climatestrike#covid#vegan#renewableenergy#water#photography
1 note
·
View note
Photo
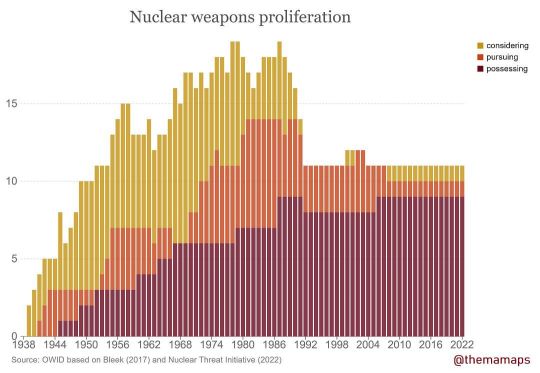
Number of countries that consider pursue or possess nuclear weapons, 2022 #nuclearpower #nuclearwar #nuclearbomb #geographyteacher #politicstoday #worldmaps #nuclearenergy #nuclearweapons #politicalactivist https://www.instagram.com/p/Cf3wbj7IA-j/?igshid=NGJjMDIxMWI=
#nuclearpower#nuclearwar#nuclearbomb#geographyteacher#politicstoday#worldmaps#nuclearenergy#nuclearweapons#politicalactivist
2 notes
·
View notes
Photo
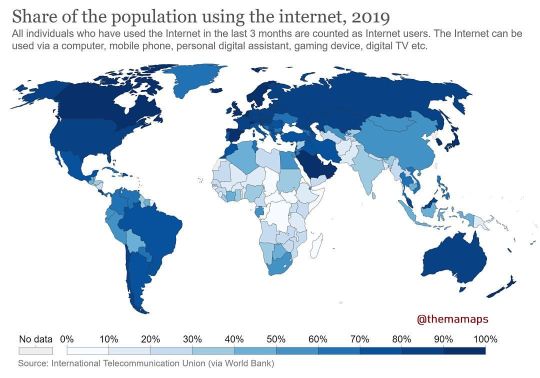
Globally, the number of Internet users increased from only 413 million in 2000 to over 3.4 billion in 2016. The one-billion barrier was crossed in 2005. Every day over the past five years, an average of 640,000 people went online for the first time. But how many people from each country are online? In the maps, we see the total number of users by country, and the percentage of a country’s population who are users. #gis #map #maps #mapping #mapmaker #mapmakers #mapofeurope #cartography #mapmonday #geography #geographyteacher #cartographyart #worldmaps #mapstagram #worldculture #teachersforteachers #politicstoday #countriesoftheworld #internet #internets #internetbusiness #digitalmarketing #internets https://www.instagram.com/p/Cfyf-OQIuXy/?igshid=NGJjMDIxMWI=
#gis#map#maps#mapping#mapmaker#mapmakers#mapofeurope#cartography#mapmonday#geography#geographyteacher#cartographyart#worldmaps#mapstagram#worldculture#teachersforteachers#politicstoday#countriesoftheworld#internet#internets#internetbusiness#digitalmarketing
0 notes
Photo

Share of the population using the internet, 2019 #teachersforteachers #mapmonday #geographyteacher #internetlifestyle #cartographyart #worldmaps #mapstagram #internetincome https://www.instagram.com/p/CfwCC_ro9Cc/?igshid=NGJjMDIxMWI=
#teachersforteachers#mapmonday#geographyteacher#internetlifestyle#cartographyart#worldmaps#mapstagram#internetincome
0 notes
Photo
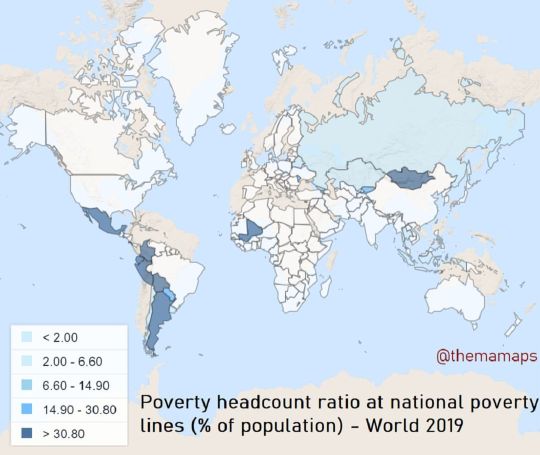
Poverty headcount ratio at national poverty lines (% of population) - World. National poverty headcount ratio is the percentage of the population living below the national poverty line(s). National estimates are based on population-weighted subgroup estimates from household surveys. For economies for which the data are from EU-SILC, the reported year is the income reference year, which is the year before the survey year. #gis #map #maps #mapping #mapmaker #mapmakers #mapofeurope #cartography #mapmonday #geography #geographyteacher #cartographyart #worldmaps #mapstagram #worldculture #teachersforteachers #politicstoday #economy #poverty #inflation #welfare #salary #workers https://www.instagram.com/p/Cftx24rIkf2/?igshid=NGJjMDIxMWI=
#gis#map#maps#mapping#mapmaker#mapmakers#mapofeurope#cartography#mapmonday#geography#geographyteacher#cartographyart#worldmaps#mapstagram#worldculture#teachersforteachers#politicstoday#economy#poverty#inflation#welfare#salary#workers
0 notes
Photo
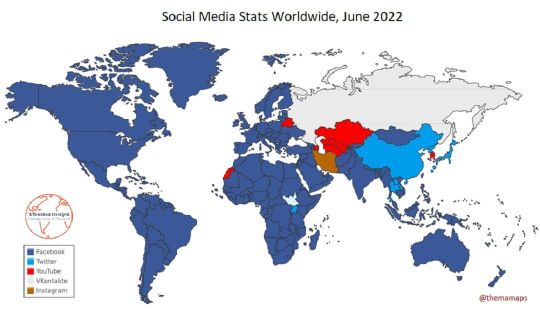
Social Media Stats Worldwide - June 2022 The most used (with the highest percentage share) social media usage is shown on the map. #gis #map #maps #mapping #mapmaker #mapmakers #mapofeurope #cartography #mapmonday #geography #geographyteacher #worldmaps #mapstagram #worldculture #teachersforteachers #politicstoday #socialmedia #socialmediamarketing #socialmediamanager #tiktok #youtube #facebook #instagram #twitter #pinterest #linkedin #internet #mobile #smartphone https://www.instagram.com/p/CfrGMVvI9o-/?igshid=NGJjMDIxMWI=
#gis#map#maps#mapping#mapmaker#mapmakers#mapofeurope#cartography#mapmonday#geography#geographyteacher#worldmaps#mapstagram#worldculture#teachersforteachers#politicstoday#socialmedia#socialmediamarketing#socialmediamanager#tiktok#youtube#facebook#instagram#twitter#pinterest#linkedin#internet#mobile#smartphone
0 notes
Photo

Extreme poverty: The share of people living on less than 1.90 int.-$ per day. The most straightforward way to measure poverty is to set a poverty line and to count the number of people living with incomes or consumption levels below that poverty line. This is the so-called poverty headcount ratio. Measuring poverty by the headcount ratio provides information that is straightforward to interpret; by definition, it tells us the share of the population living with consumption (or incomes) below some minimum level. The World Bank defines extreme poverty as living on less than 1.90 int.-$. In the map shows available estimates of the extreme poverty headcount ratio, country by country. #gis #map #maps #mapping #mapmaker #mapmakers #mapofeurope #cartography #mapmonday #geography #geographyteacher #cartographyart #worldmaps #mapstagram #worldculture #teachersforteachers #politicstoday #economy #poverty #inflation #welfare #salary #workers #livelihood #difficulties #life #lifestyle #business #businessowner https://www.instagram.com/p/CfoaiFRo4p7/?igshid=NGJjMDIxMWI=
#gis#map#maps#mapping#mapmaker#mapmakers#mapofeurope#cartography#mapmonday#geography#geographyteacher#cartographyart#worldmaps#mapstagram#worldculture#teachersforteachers#politicstoday#economy#poverty#inflation#welfare#salary#workers#livelihood#difficulties#life#lifestyle#business#businessowner
0 notes
Photo

Global Forced Displacement, 2021 Continuing a worrying decade-long rising trend, the number of people forced to flee due to persecution, conflict, violence, human rights violations and events seriously disturbing public order climbed to 89.3 million by the end of 2021. This is more than double the 42.7 million people who remained forcibly displaced at the end of 2012 and represents a sharp 8 per cent increase of almost 7 million people in the span of just 12 months. As a result, above one per cent of the world’s population – or 1 in 88 people – were forcibly displaced at the end of 2021. This compare swith 1 in 167 at the end of 2012. data by UNHCR, the UN Refugee Agency #gis #map #maps #mapping #mapmaker #mapmakers #mapofeurope #cartography #mapmonday #geography #geographyteacher #worldmaps #mapstagram #worldculture #teachersforteachers #politicstoday #displacement #war #migration #persecution #conflict #violence #humanrights #violations #threat #expatriate #politics https://www.instagram.com/p/CfmoAAuISrH/?igshid=NGJjMDIxMWI=
#gis#map#maps#mapping#mapmaker#mapmakers#mapofeurope#cartography#mapmonday#geography#geographyteacher#worldmaps#mapstagram#worldculture#teachersforteachers#politicstoday#displacement#war#migration#persecution#conflict#violence#humanrights#violations#threat#expatriate#politics
1 note
·
View note