#Bearish Candlestick Patterns
Explore tagged Tumblr posts
Visit Tumblr Blog
Explore Tumblr blogs with no restrictions, modern design and the best experience.
Last Seen Tumblr Blogs


Fun Fact
Tumblr Inc. has $15.1M in annual revenue.
Text
Understanding Bearish Candlestick Patterns
In the world of technical analysis, candlestick patterns play a crucial role in predicting future price movements. Among these patterns, bearish candlestick patterns are essential for traders looking to identify potential downtrends and reversals. Understanding these patterns can enhance your ability to make informed trading decisions. In this blog, we’ll dive into the most common bearish candlestick patterns and how you can use them to anticipate market movements.
What Are Bearish Candlestick Patterns?
Bearish candlestick patterns are formations on a price chart that suggest a potential decline in the asset's price. These patterns often indicate a shift in market sentiment from bullish to bearish, signaling a possible selling opportunity. Recognizing these patterns can help traders prepare for potential downturns and manage their trades more effectively.
Key Bearish Candlestick Patterns
1. Shooting Star
Description: The shooting star is a single-candle pattern that appears after an uptrend. It has a small body at the lower end of the candle with a long upper shadow and little to no lower shadow.
Indication: A shooting star signals a potential reversal of the uptrend and suggests that the market may be turning bearish.
Trading Strategy: Look for confirmation of the bearish reversal on the next candle or through other technical indicators before making trading decisions.
2. Dark Cloud Cover
Description: This two-candle pattern appears after an uptrend. The first candle is a long bullish candle, followed by a bearish candle that opens above the high of the previous candle but closes below the midpoint of the first candle.
Indication: The dark cloud cover pattern indicates that the bullish momentum is waning, and a bearish reversal may be on the horizon.
Trading Strategy: Wait for confirmation of the pattern with a further decline in price before executing a trade.
3. Engulfing Pattern
Description: The bearish engulfing pattern consists of two candles. The first candle is a small bullish candle, and the second candle is a larger bearish candle that completely engulfs the body of the first candle.
Indication: This pattern suggests that the bears are gaining control, potentially signaling the start of a downtrend.
Trading Strategy: Confirm the pattern with additional technical indicators or subsequent price action to validate the bearish signal.
4. Hanging Man
Description: The hanging man is a single-candle pattern found at the top of an uptrend. It has a small body at the upper end with a long lower shadow and little to no upper shadow.
Indication: The hanging man suggests that selling pressure is increasing, which could signal a bearish reversal if confirmed by subsequent price action.
Trading Strategy: Look for confirmation of the bearish reversal with a bearish follow-through on the next candle.
5. Evening Star
Description: The evening star is a three-candle pattern. It starts with a long bullish candle, followed by a small-bodied candle that gaps up, and concludes with a long bearish candle that closes well into the body of the first candle.
Indication: This pattern indicates a strong potential reversal from bullish to bearish and suggests that the market may be entering a downtrend.
Trading Strategy: Confirm the pattern with additional technical analysis before taking a bearish position.
How to Use Bearish Candlestick Patterns
1. Confirmation is Key: Always look for confirmation of bearish signals through additional technical indicators or subsequent price action. Patterns alone may not always be reliable without confirmation.
2. Combine with Other Analysis: Use bearish candlestick patterns in conjunction with other technical analysis tools, such as trend lines, moving averages, or volume analysis, to enhance the accuracy of your predictions.
3. Risk Management: Implement proper risk management strategies, including setting stop-loss orders and managing position sizes, to protect your capital in case the market does not behave as anticipated.
4. Practice and Learn: Familiarize yourself with these patterns by studying historical charts and practicing on demo accounts. The more you observe and analyze these patterns, the better you will become at identifying and interpreting them.
Conclusion
Understanding bearish candlestick patterns is crucial for traders looking to identify potential reversals and capitalize on downtrends. Patterns such as the shooting star, dark cloud cover, engulfing pattern, hanging man, and evening star can provide valuable insights into market sentiment and potential price movements. By combining these patterns with other technical analysis tools and practicing sound risk management, you can enhance your trading strategy and improve your chances of success. Happy trading!
0 notes
Text
Candlestick Charting: A Tale of Tradition and Innovation from Japan
Candlestick charting's rich origins in Japan reveal timeless insights into market sentiment. Embrace the past's wisdom as we navigate today's markets, confident that understanding emotions will illuminate brighter trading paths! 🚀📈 #FinancialWisdom
Candlestick charting, a vital tool for traders globally, originated in 18th-century Japan amid a feudal society and a thriving rice market. Developed by legendary trader Munehisa Homma, it visualised price movements using candlesticks, revealing market psychology and predicting trends. Steve Nison’s introduction of candlestick charting to the West in the 1980s revolutionised technical analysis.…

View On WordPress
#Bullish and Bearish Patterns#Candlestick Patterns#Feudal Japan#Financial Education#Japan#Market Psychology#Modern Trading#Price Action#Risk management#Technical Analysis
4 notes
·
View notes
Text
How to Trade with Engulfing Candlestick Patterns
Engulfing Candlestick Patterns are a type of chart pattern used in technical analysis to predict market trends. They occur when a larger candlestick completely covers or “engulfs” the previous smaller one, signalling a potential reversal in price direction. There are two types of engulfing candlestick patterns, i.e., bullish engulfing pattern and bearish engulfing pattern. These patterns are a useful tool in determining entry and exit points for trade or understanding the market behaviour to make informed portfolio decisions.

Types of Engulfing Candlestick Patterns
How to Trade Using Engulfing Candlestick Patterns
Pros and Cons of Bullish Engulfing Candlestick Pattern
Pros and Cons of Bearish Engulfing Candlestick Pattern
#engulfing candlestick#types of engulfing candlestick pattern#bullish engulfing candlestick#bearish engulfing candlestick pattern
0 notes
Text
youtube
Mastering Forex Charts: A Beginner's Guide to Candlesticks, Lines, and Bar Patterns
#Forex trading#Forex charts#candlestick charts#line charts#bar charts#trading tutorial#chart analysis#technical analysis#Forex market#bullish patterns#bearish patterns#price movements#market trends#OHLC#trading strategies#chart reading#price action#trading tips#beginner trading#advanced trading#Forex education#PipInfuse#trading insights#market sentiment#trend analysis#trading confidence#Youtube
1 note
·
View note
Text
10 Candlestick Patterns for Effective Trading
Candlestick patterns are a powerful tool for traders to analyze price movements and predict future market behavior. Developed in Japan over 300 years ago, these patterns are widely used in modern technical analysis. This article will explore ten essential candlestick patterns that can help traders make informed decisions and enhance their trading strategies. What are Candlestick…
#Bearish Patterns#Bullish Patterns#Candlestick Patterns#Downtrend#Entry and Exit Points#Forex#Forex Traders#Forex Trading#Market Reversal#Price Movements#Risk Management#Stop-Loss#Take-Profit#Technical Analysis#Trading Psychology#Trading Strategies#Trading Strategy#Trend Direction#Trend Identification#Uptrend
1 note
·
View note
Text
Unlock the Secrets of Trading with Top Chart Patterns! Explore the world of chart patterns with Funded Traders Global. From understanding the basics of technical analysis to recognizing common chart patterns like head and shoulders, double tops, and flags, our blog equips you with the knowledge to enhance your trading skills. Discover advanced patterns like pennants, wedges, and harmonic patterns, and gain practical tips for effective trading. Improve your risk management, pinpoint entry and exit points, and combine chart patterns with technical indicators. Start your journey towards trading success today with Funded Traders Global!
#Advanced Chart Pattern#and Descending Triangles#and mini trading#Ascending#Basics of Technical Analysis#Benefits of Recognizing in Chart Pattern#Bullish and Bearish Flags Pattern#candlestick#candlestick Pattern#career in forex trading#chart patterns#classic reversal pattern#common chart patterns#cup and handle pattern#Double top and double bottom patterns#drawdown#financial markets#Forex trading financial freedom#FTG#ftg prop firm#ftg trading#Funded Traders Global#Gaps#Harmonic Patterns#Head and Shoulders Pattern#how to scale into a forex trade#Macro#Master the Market with These Top Chart Patterns for Trading#mastering Forex trading#micro
0 notes
Link
#CandlestickAnalysis#candlestickpatterns#chartpatterns#ForexTrading#markettrends#MomentumTrading#priceaction#ReversalPatterns#riskmanagement#StockMarket#supportandresistance#technicalanalysis#TradingSignals#TradingStrategy#TrendContinuation
2 notes
·
View notes
Text
Bitcoin, the leading cryptocurrency, has recently faced a significant downturn, trading around $56,697.32. Despite this bearish phase, there are signs of a potential rebound. The Relative Strength Index (RSI) stands at 28.41, indicating oversold conditions typically seen as buying opportunities. Candlestick patterns with long lower shadows suggest buying pressure at lower levels, hinting at a price reversal.
Influential analyst CryptoJack is optimistic, predicting Bitcoin will surpass $100,000 despite the current downturn. He believes Bitcoin is near its bottom, aligning with technical indicators suggesting an oversold market.
Market data from CoinMarketCap shows Bitcoin’s market cap at $1.12 trillion, a 2.63% increase in one day, while the 24-hour trading volume has decreased by 38.03% to $31.91 billion, indicating consolidation. Traders are cautious, but the oversold RSI and bullish patterns support the possibility of a rebound. Watching for signs of reversal could signal the start of a recovery phase.
4 notes
·
View notes
Text
📉 Three Black Crows Pattern: A Powerful Bearish Reversal Signal in Technical Analysis
In the world of candlestick charting, patterns provide traders with insights into potential market movements. One of the most powerful bearish reversal patterns is the Three Black Crows. This pattern is widely recognized for its ability to signal a potential shift from an uptrend to a downtrend, giving traders an early indication to exit long positions or initiate shorts. In this post, we’ll…
#Bearish Candlestick Patterns#bearish chart patterns#bearish engulfing vs Three Black Crows#Bearish reversal candlestick pattern#best trading strategy using Three Black Crows#Candlestick pattern confirmation#Candlestick patterns in trading#day trading reversal setups#how to identify Three Black Crows in stock charts#how to trade Three Black Crows#Japanese candlestick patterns#learn technical analysis#reliable bearish signals in technical analysis#RSI divergence with candlesticks#Short Selling Strategy#Stock Chart Patterns#Stock Market Reversal Patterns#stock markets#stock trading#successful trading#Swing trading strategies#technical analysis#technical indicators for confirmation#Three Black Crows candlestick#Three Black Crows example#Three Black Crows formation#Three Black Crows pattern#Three Black Crows strategy#Three Black Crows technical analysis#Three Black Crows trading
0 notes
Text
The Top Bearish Candlestick Patterns Every Trader Should Know
In the realm of technical analysis, candlestick patterns play a crucial role in helping traders identify potential shifts in market sentiment and price trends. Bearish candlestick patterns specifically indicate potential downward movements in prices, providing valuable signals for traders looking to capitalize on selling opportunities or implement risk management strategies. In this blog, we'll explore some of the top bearish candlestick patterns that every trader should be familiar with, their characteristics, and how to interpret them effectively.
Understanding Bearish Candlestick Patterns
Bearish candlestick patterns are formations that suggest a higher probability of price decline or reversal. These patterns typically consist of one or more candlesticks with specific shapes and characteristics that indicate selling pressure or weakening bullish momentum.
Top Bearish Candlestick Patterns
1. Bearish Engulfing Pattern
Description: The bearish engulfing pattern consists of two candlesticks. The first candle is bullish (green) and is followed by a larger second candle that is bearish (red). The second candle completely engulfs the body of the first candle, signaling a potential reversal from bullish to bearish sentiment.
Interpretation: The larger the second (bearish) candle and the higher the volume accompanying it, the stronger the bearish signal.
2. Dark Cloud Cover
Description: The dark cloud cover pattern occurs when a bullish candle (green) is followed by a bearish candle (red) that opens above the high of the preceding bullish candle and closes below its midpoint.
Interpretation: This pattern suggests a potential reversal or resistance level, indicating that bullish momentum may be waning and a bearish reversal could follow.
3. Evening Star
Description: The evening star pattern is a three-candlestick pattern. It begins with a large bullish candle, followed by a small-bodied candle (either bullish or bearish) that gaps up or down, and concludes with a large bearish candle that closes well into the first candle's body.
Interpretation: The evening star pattern signifies a transition from bullishness to bearishness, with the third candle confirming increased selling pressure and potential downward movement.
4. Shooting Star
Description: A shooting star is a single candlestick with a small body (green or red) and a long upper shadow (wick) that is at least twice the length of the body. The candlestick indicates that buyers pushed the price significantly higher during the session but encountered selling pressure, resulting in a bearish reversal.
Interpretation: The long upper shadow suggests a failed attempt by buyers to sustain upward momentum, often leading to a reversal or price correction.
Using Bearish Candlestick Patterns in Trading
When incorporating bearish candlestick patterns into your trading strategy, consider the following:
Confirmation: Look for additional signs of bearish confirmation, such as high trading volume or divergence with other technical indicators.
Risk Management: Place stop-loss orders above the pattern's high to manage risk in case of a false signal or unexpected market movement.
Time Frame: Patterns are more reliable on higher time frames (e.g., daily or weekly charts), providing clearer signals amidst noise on shorter time frames.
Conclusion
Mastering bearish candlestick patterns empowers traders to identify potential reversal points or bearish continuation opportunities in the market. By understanding the characteristics and interpreting these patterns correctly, traders can enhance their decision-making process and improve the profitability of their trades. However, it's essential to combine candlestick patterns with other technical analysis tools and consider broader market trends and economic indicators for comprehensive trading strategies.
Integrate bearish candlestick patterns into your trading toolkit and leverage their predictive power to navigate the dynamic landscape of financial markets with confidence and precision.
Happy trading!
0 notes
Text
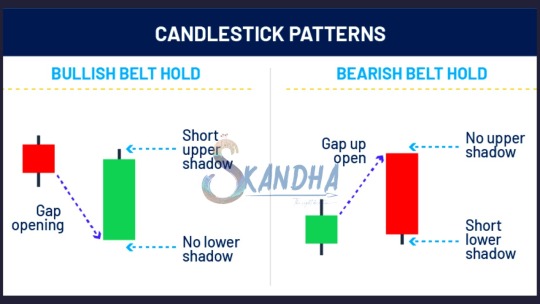
A belt hold pattern suggests that a trend may be reversing and indicates investor sentiment may have changed. When looking at them historically, there will often be a clear trend in one direction, followed by a clear trend in the other direction as the color of the candlestick changes.
There are two types of belt hold candlestick: one bullish and one bearish.
#skandhatrade #belthold #support #resistance #stock #chart #Trade #signal #patterns
#trend #Technicals #analysis #strategies #candlestick #priceaction #entry #supply #demand
To Learn More DM us
We Offer Paid Courses And Training Contact us Via
Email : [email protected]
https://forms.gle/8rWzz1gUuerxwVM49
Website: https://skandhatrade.com/
To Register for Learning:
2 notes
·
View notes
Text
Inverted Hammer Pattern Explained: Spot Market Reversals Like a Pro
Are you spotting the right reversal signals in the market?
Understanding candlestick patterns can provide a critical edge in trading, especially when it comes to identifying potential trend reversals. One such pattern is the Inverted Hammer—a powerful single-candle formation that often signals a possible shift from bearish to bullish momentum. However, recognizing it isn’t enough. Traders must understand the psychology behind the candle, its context within a trend, and how to confirm its validity with other indicators.
In our latest article, we break down the Inverted Hammer Pattern in detail: how to spot it, what it really means, and how to use it effectively in your trading strategy.
Start making smarter trading decisions today.
Read the full guide here:
#CandlestickPatterns#TradingForBeginners#InvertedHammer#StockMarket#TechnicalAnalysis#PriceAction#SmartTrading
0 notes
Text

Mastering stock charts helps you track price trends, spot bullish/bearish patterns, and gauge momentum with tools like RSI, MACD, and moving averages. Reading candlesticks, volume, and support/resistance levels sharpens your timing. For expert guidance and smarter investing, trust MNCL – your reliable stock broking and investment partner.
0 notes
Text
How to read candlestick charts and patterns for better trades?
Candlestick charts are a powerful tool for making better trading decisions. Each candle shows the open, high, low, and close price for a specific time frame. Patterns like Doji, Hammer, Engulfing, and Shooting Star can signal potential reversals or trend continuations.
To read them effectively:
Look for pattern confirmation with volume.
Understand bullish vs. bearish signals.
Combine candlestick analysis with support and resistance levels or indicators like RSI.
Learning to read these patterns takes practice and guided learning. At Empirical Academy, we offer hands-on training in technical analysis, including live candlestick chart reading.
📚 Learn to trade with clarity and confidence. 👉 Enroll now: https://www.empiricalacademy.net
0 notes
Text
Hanging Man Candlestick: A Professional’s Guide to Spotting Bearish Reversals
🕵️♂️ In the world of financial markets, every candlestick tells a story. For traders and investors, reading these stories is crucial to navigating the often tumultuous waters of stock trading. One such pattern that has long captured the attention of analysts is the Hanging Man, a formation that occasionally signals a potential shift in market sentiment. It might look unassuming at first glance,…
0 notes
Text
Mastering Indian Stock Market Trading & Investing: Technical Analysis for Smart Decisions

If you've ever found yourself staring at stock charts, wondering what those zigzag lines really mean or how seasoned traders predict market moves so accurately—it’s time to dive deep into the fascinating world of technical analysis.
Whether you're a beginner aiming to make your first trade or a budding investor who wants to understand market trends better, technical analysis is your gateway to reading the stock market like a pro. It’s not magic. It’s strategy—and with the right mindset, tools, and a bit of practice, anyone can learn it.
In this guide, we’ll explore what technical analysis is, how it's used in Indian stock market trading, and why mastering it can be a game-changer for your financial future.
What is Technical Analysis, Really?
At its core, technical analysis is about analyzing price movements and patterns. Instead of focusing on a company’s balance sheet or profits (which is fundamental analysis), technical analysis zooms in on stock charts, volume trends, support/resistance levels, and indicators like RSI, MACD, and moving averages.
Here’s the idea: history often repeats itself in the markets. Traders believe that past price movements can provide clues about future behavior.
But don’t worry—it’s not about memorizing hundreds of formulas. It’s about recognizing patterns, understanding market psychology, and using tools that are available to everyone.
Why is Technical Analysis Crucial in Indian Stock Market Trading?
India’s stock market, with major exchanges like NSE and BSE, is vibrant, fast-moving, and full of opportunities. With retail participation increasing and more young investors entering the scene, understanding technical analysis is not just a skill—it’s a competitive edge.
Here's why it matters:
�� Volatility is Opportunity: Indian stocks often experience sharp movements. Technical analysis helps you time entries and exits better.
🔍 Helps Filter the Noise: News, opinions, and rumors? Technical charts let the price action speak for itself.
🕒 Perfect for Short-term & Swing Trading: Want to catch trends that last a few days or weeks? TA is your best friend.
💼 Complements Long-Term Investing: Even if you’re a long-term investor, knowing when to buy a fundamentally strong stock can greatly enhance returns.
Core Principles of Technical Analysis
To make smart decisions, you need a few essentials in your toolkit. Let’s break them down.
1. Price Discounts Everything
This is the first rule of technical analysis. Every known factor—earnings, news, expectations—is already reflected in the price.
2. Trends are Key
Markets move in trends: upward (bullish), downward (bearish), or sideways. Identifying the trend early can give you a head start.
3. History Tends to Repeat Itself
Humans drive the markets. Emotions like fear and greed lead to recurring price patterns.
Must-Know Tools and Indicators for Beginners
Learning technical analysis doesn’t mean staring blankly at complex graphs. Start with these basic tools:
🟢 Moving Averages (MA)
They smoothen price data to help you identify the trend. A simple 50-day and 200-day MA combo can reveal bullish or bearish signals.
🟣 Relative Strength Index (RSI)
A momentum indicator that tells you if a stock is overbought or oversold. It works on a scale of 0-100. Typically, above 70 means overbought; below 30 means oversold.
🔵 MACD (Moving Average Convergence Divergence)
Used to catch trend reversals. It gives crossover signals that many day traders live by.
🟡 Support and Resistance
Support is a level where buyers enter; resistance is where sellers dominate. Price tends to bounce between these zones.
🔴 Candlestick Patterns
Japanese candlesticks offer visual insights into market psychology. Patterns like Doji, Hammer, and Engulfing tell a story of potential reversals.
A Real-World Example: Let’s Analyze a Stock
Let’s say you’re looking at Infosys. You open the daily chart and notice:
The RSI is around 80 ➜ The stock might be overbought.
It’s near a resistance level it couldn’t cross twice before.
A bearish engulfing candle forms.
This is a potential short signal.
On the flip side, if the stock is near its 200-day MA, RSI is around 35, and a hammer pattern appears near support—you might consider buying.
The beauty of technical analysis? These setups repeat over time.
Day Trading vs Swing Trading vs Investing: How Does TA Fit?
✅ Day Trading
Entry and exit in the same day.
Requires strict discipline and quick decision-making.
TA is essential—especially 5-min, 15-min, hourly charts.
✅ Swing Trading
Positions held for days or weeks.
Based on short-to-medium-term trends.
Ideal for working professionals.
✅ Investing
Long-term horizon, but TA helps in timing your entry.
For example: Buying at a support level during a correction can improve returns significantly.
How to Start Learning Technical Analysis the Smart Way?
The internet is full of content, but not all of it is structured or beginner-friendly. If you’re serious about mastering it, choose a comprehensive, beginner-to-advanced course that focuses on the Indian stock market context.
We highly recommend starting with this Indian Stock Market Trading | Investing: Technical Analysis!! course. It’s perfect for beginners, filled with practical charting tips, live examples, and Indian stock-specific case studies.
Not only will it teach you chart reading, but you’ll also learn how to:
Use charting platforms effectively
Apply 20+ indicators in real-world scenarios
Build your trading strategy
Avoid beginner mistakes
Read volume like a pro
Whether you want to trade Bank Nifty, mid-cap stocks, or explore intraday and positional strategies, this course brings clarity and depth in a step-by-step format.
Common Mistakes New Traders Make (and How to Avoid Them)
Many new traders jump in with high hopes and little prep. Here’s how not to fall into the same traps:
❌ Trading Without a Plan: Always have entry, stop-loss, and target.
❌ Overusing Indicators: More isn’t better. Stick to 2–3 that suit your style.
❌ Ignoring Risk Management: Never risk more than 1–2% of your capital on a single trade.
❌ Letting Emotions Rule: Fear and greed are your biggest enemies.
Consistency comes from mindset, not just methods.
Building Your Trading System with Technical Analysis
Once you get the basics, build your own trading system—a repeatable strategy that aligns with your risk appetite.
Ask yourself:
What’s my trading style? (Scalping, Intraday, Positional)
What’s my entry signal? (Crossover, pattern, breakout)
What’s my stop-loss logic? (Fixed %, below support)
What are my exit rules? (Trailing stop, fixed reward ratio)
Test your system. Backtest it. Paper trade. And once it works—scale it.
Is Technical Analysis Foolproof?
No system is perfect. Technical analysis gives probabilities, not certainties. But when used correctly, it dramatically tilts the odds in your favor.
It's not about predicting the future. It's about reading the present clearly enough to make informed decisions.
That’s the edge that sets apart successful traders from the rest.
Final Thoughts: Why Now is the Best Time to Learn Technical Analysis
With rising retail participation in India’s stock market and easy access to free and paid charting tools, this is the perfect time to learn technical analysis.
Whether you're doing it to:
Create a side income,
Manage your investments better,
Or someday trade full-time,
Mastering technical analysis opens a whole new dimension in your financial journey.
And the best part? You don’t need a finance degree or fancy tools—just curiosity, a good course, and a willingness to learn.
Start your journey with confidence. Explore the Indian Stock Market Trading | Investing: Technical Analysis!! course today and take your first step toward smarter investing.
0 notes