#bearish candlestick patterns
Explore tagged Tumblr posts
Visit Tumblr Blog
Explore Tumblr blogs with no restrictions, modern design and the best experience.
Last Seen Tumblr Blogs


Fun Fact
Tumblr.com is the 103rd most visited website in the world.
Text
Understanding Bearish Candlestick Patterns
In the world of technical analysis, candlestick patterns play a crucial role in predicting future price movements. Among these patterns, bearish candlestick patterns are essential for traders looking to identify potential downtrends and reversals. Understanding these patterns can enhance your ability to make informed trading decisions. In this blog, we’ll dive into the most common bearish candlestick patterns and how you can use them to anticipate market movements.
What Are Bearish Candlestick Patterns?
Bearish candlestick patterns are formations on a price chart that suggest a potential decline in the asset's price. These patterns often indicate a shift in market sentiment from bullish to bearish, signaling a possible selling opportunity. Recognizing these patterns can help traders prepare for potential downturns and manage their trades more effectively.
Key Bearish Candlestick Patterns
1. Shooting Star
Description: The shooting star is a single-candle pattern that appears after an uptrend. It has a small body at the lower end of the candle with a long upper shadow and little to no lower shadow.
Indication: A shooting star signals a potential reversal of the uptrend and suggests that the market may be turning bearish.
Trading Strategy: Look for confirmation of the bearish reversal on the next candle or through other technical indicators before making trading decisions.
2. Dark Cloud Cover
Description: This two-candle pattern appears after an uptrend. The first candle is a long bullish candle, followed by a bearish candle that opens above the high of the previous candle but closes below the midpoint of the first candle.
Indication: The dark cloud cover pattern indicates that the bullish momentum is waning, and a bearish reversal may be on the horizon.
Trading Strategy: Wait for confirmation of the pattern with a further decline in price before executing a trade.
3. Engulfing Pattern
Description: The bearish engulfing pattern consists of two candles. The first candle is a small bullish candle, and the second candle is a larger bearish candle that completely engulfs the body of the first candle.
Indication: This pattern suggests that the bears are gaining control, potentially signaling the start of a downtrend.
Trading Strategy: Confirm the pattern with additional technical indicators or subsequent price action to validate the bearish signal.
4. Hanging Man
Description: The hanging man is a single-candle pattern found at the top of an uptrend. It has a small body at the upper end with a long lower shadow and little to no upper shadow.
Indication: The hanging man suggests that selling pressure is increasing, which could signal a bearish reversal if confirmed by subsequent price action.
Trading Strategy: Look for confirmation of the bearish reversal with a bearish follow-through on the next candle.
5. Evening Star
Description: The evening star is a three-candle pattern. It starts with a long bullish candle, followed by a small-bodied candle that gaps up, and concludes with a long bearish candle that closes well into the body of the first candle.
Indication: This pattern indicates a strong potential reversal from bullish to bearish and suggests that the market may be entering a downtrend.
Trading Strategy: Confirm the pattern with additional technical analysis before taking a bearish position.
How to Use Bearish Candlestick Patterns
1. Confirmation is Key: Always look for confirmation of bearish signals through additional technical indicators or subsequent price action. Patterns alone may not always be reliable without confirmation.
2. Combine with Other Analysis: Use bearish candlestick patterns in conjunction with other technical analysis tools, such as trend lines, moving averages, or volume analysis, to enhance the accuracy of your predictions.
3. Risk Management: Implement proper risk management strategies, including setting stop-loss orders and managing position sizes, to protect your capital in case the market does not behave as anticipated.
4. Practice and Learn: Familiarize yourself with these patterns by studying historical charts and practicing on demo accounts. The more you observe and analyze these patterns, the better you will become at identifying and interpreting them.
Conclusion
Understanding bearish candlestick patterns is crucial for traders looking to identify potential reversals and capitalize on downtrends. Patterns such as the shooting star, dark cloud cover, engulfing pattern, hanging man, and evening star can provide valuable insights into market sentiment and potential price movements. By combining these patterns with other technical analysis tools and practicing sound risk management, you can enhance your trading strategy and improve your chances of success. Happy trading!
0 notes
Text
Candlestick Charting: A Tale of Tradition and Innovation from Japan
Candlestick charting's rich origins in Japan reveal timeless insights into market sentiment. Embrace the past's wisdom as we navigate today's markets, confident that understanding emotions will illuminate brighter trading paths! 🚀📈 #FinancialWisdom
Candlestick charting, a vital tool for traders globally, originated in 18th-century Japan amid a feudal society and a thriving rice market. Developed by legendary trader Munehisa Homma, it visualised price movements using candlesticks, revealing market psychology and predicting trends. Steve Nison’s introduction of candlestick charting to the West in the 1980s revolutionised technical analysis.…

View On WordPress
#Bullish and Bearish Patterns#Candlestick Patterns#Feudal Japan#Financial Education#Japan#Market Psychology#Modern Trading#Price Action#Risk management#Technical Analysis
4 notes
·
View notes
Text
How to Trade with Engulfing Candlestick Patterns
Engulfing Candlestick Patterns are a type of chart pattern used in technical analysis to predict market trends. They occur when a larger candlestick completely covers or “engulfs” the previous smaller one, signalling a potential reversal in price direction. There are two types of engulfing candlestick patterns, i.e., bullish engulfing pattern and bearish engulfing pattern. These patterns are a useful tool in determining entry and exit points for trade or understanding the market behaviour to make informed portfolio decisions.

Types of Engulfing Candlestick Patterns
How to Trade Using Engulfing Candlestick Patterns
Pros and Cons of Bullish Engulfing Candlestick Pattern
Pros and Cons of Bearish Engulfing Candlestick Pattern
#engulfing candlestick#types of engulfing candlestick pattern#bullish engulfing candlestick#bearish engulfing candlestick pattern
0 notes
Text
youtube
Mastering Forex Charts: A Beginner's Guide to Candlesticks, Lines, and Bar Patterns
#Forex trading#Forex charts#candlestick charts#line charts#bar charts#trading tutorial#chart analysis#technical analysis#Forex market#bullish patterns#bearish patterns#price movements#market trends#OHLC#trading strategies#chart reading#price action#trading tips#beginner trading#advanced trading#Forex education#PipInfuse#trading insights#market sentiment#trend analysis#trading confidence#Youtube
1 note
·
View note
Text
10 Candlestick Patterns for Effective Trading
Candlestick patterns are a powerful tool for traders to analyze price movements and predict future market behavior. Developed in Japan over 300 years ago, these patterns are widely used in modern technical analysis. This article will explore ten essential candlestick patterns that can help traders make informed decisions and enhance their trading strategies. What are Candlestick…
#Bearish Patterns#Bullish Patterns#Candlestick Patterns#Downtrend#Entry and Exit Points#Forex#Forex Traders#Forex Trading#Market Reversal#Price Movements#Risk Management#Stop-Loss#Take-Profit#Technical Analysis#Trading Psychology#Trading Strategies#Trading Strategy#Trend Direction#Trend Identification#Uptrend
1 note
·
View note
Text
Unlock the Secrets of Trading with Top Chart Patterns! Explore the world of chart patterns with Funded Traders Global. From understanding the basics of technical analysis to recognizing common chart patterns like head and shoulders, double tops, and flags, our blog equips you with the knowledge to enhance your trading skills. Discover advanced patterns like pennants, wedges, and harmonic patterns, and gain practical tips for effective trading. Improve your risk management, pinpoint entry and exit points, and combine chart patterns with technical indicators. Start your journey towards trading success today with Funded Traders Global!
#Advanced Chart Pattern#and Descending Triangles#and mini trading#Ascending#Basics of Technical Analysis#Benefits of Recognizing in Chart Pattern#Bullish and Bearish Flags Pattern#candlestick#candlestick Pattern#career in forex trading#chart patterns#classic reversal pattern#common chart patterns#cup and handle pattern#Double top and double bottom patterns#drawdown#financial markets#Forex trading financial freedom#FTG#ftg prop firm#ftg trading#Funded Traders Global#Gaps#Harmonic Patterns#Head and Shoulders Pattern#how to scale into a forex trade#Macro#Master the Market with These Top Chart Patterns for Trading#mastering Forex trading#micro
0 notes
Link
#CandlestickAnalysis#candlestickpatterns#chartpatterns#ForexTrading#markettrends#MomentumTrading#priceaction#ReversalPatterns#riskmanagement#StockMarket#supportandresistance#technicalanalysis#TradingSignals#TradingStrategy#TrendContinuation
2 notes
·
View notes
Text
📉 Three Black Crows Pattern: A Powerful Bearish Reversal Signal in Technical Analysis
In the world of candlestick charting, patterns provide traders with insights into potential market movements. One of the most powerful bearish reversal patterns is the Three Black Crows. This pattern is widely recognized for its ability to signal a potential shift from an uptrend to a downtrend, giving traders an early indication to exit long positions or initiate shorts. In this post, we’ll…
#Bearish Candlestick Patterns#bearish chart patterns#bearish engulfing vs Three Black Crows#Bearish reversal candlestick pattern#best trading strategy using Three Black Crows#Candlestick pattern confirmation#Candlestick patterns in trading#day trading reversal setups#how to identify Three Black Crows in stock charts#how to trade Three Black Crows#Japanese candlestick patterns#learn technical analysis#reliable bearish signals in technical analysis#RSI divergence with candlesticks#Short Selling Strategy#Stock Chart Patterns#Stock Market Reversal Patterns#stock markets#stock trading#successful trading#Swing trading strategies#technical analysis#technical indicators for confirmation#Three Black Crows candlestick#Three Black Crows example#Three Black Crows formation#Three Black Crows pattern#Three Black Crows strategy#Three Black Crows technical analysis#Three Black Crows trading
0 notes
Text
The Top Bearish Candlestick Patterns Every Trader Should Know
In the realm of technical analysis, candlestick patterns play a crucial role in helping traders identify potential shifts in market sentiment and price trends. Bearish candlestick patterns specifically indicate potential downward movements in prices, providing valuable signals for traders looking to capitalize on selling opportunities or implement risk management strategies. In this blog, we'll explore some of the top bearish candlestick patterns that every trader should be familiar with, their characteristics, and how to interpret them effectively.
Understanding Bearish Candlestick Patterns
Bearish candlestick patterns are formations that suggest a higher probability of price decline or reversal. These patterns typically consist of one or more candlesticks with specific shapes and characteristics that indicate selling pressure or weakening bullish momentum.
Top Bearish Candlestick Patterns
1. Bearish Engulfing Pattern
Description: The bearish engulfing pattern consists of two candlesticks. The first candle is bullish (green) and is followed by a larger second candle that is bearish (red). The second candle completely engulfs the body of the first candle, signaling a potential reversal from bullish to bearish sentiment.
Interpretation: The larger the second (bearish) candle and the higher the volume accompanying it, the stronger the bearish signal.
2. Dark Cloud Cover
Description: The dark cloud cover pattern occurs when a bullish candle (green) is followed by a bearish candle (red) that opens above the high of the preceding bullish candle and closes below its midpoint.
Interpretation: This pattern suggests a potential reversal or resistance level, indicating that bullish momentum may be waning and a bearish reversal could follow.
3. Evening Star
Description: The evening star pattern is a three-candlestick pattern. It begins with a large bullish candle, followed by a small-bodied candle (either bullish or bearish) that gaps up or down, and concludes with a large bearish candle that closes well into the first candle's body.
Interpretation: The evening star pattern signifies a transition from bullishness to bearishness, with the third candle confirming increased selling pressure and potential downward movement.
4. Shooting Star
Description: A shooting star is a single candlestick with a small body (green or red) and a long upper shadow (wick) that is at least twice the length of the body. The candlestick indicates that buyers pushed the price significantly higher during the session but encountered selling pressure, resulting in a bearish reversal.
Interpretation: The long upper shadow suggests a failed attempt by buyers to sustain upward momentum, often leading to a reversal or price correction.
Using Bearish Candlestick Patterns in Trading
When incorporating bearish candlestick patterns into your trading strategy, consider the following:
Confirmation: Look for additional signs of bearish confirmation, such as high trading volume or divergence with other technical indicators.
Risk Management: Place stop-loss orders above the pattern's high to manage risk in case of a false signal or unexpected market movement.
Time Frame: Patterns are more reliable on higher time frames (e.g., daily or weekly charts), providing clearer signals amidst noise on shorter time frames.
Conclusion
Mastering bearish candlestick patterns empowers traders to identify potential reversal points or bearish continuation opportunities in the market. By understanding the characteristics and interpreting these patterns correctly, traders can enhance their decision-making process and improve the profitability of their trades. However, it's essential to combine candlestick patterns with other technical analysis tools and consider broader market trends and economic indicators for comprehensive trading strategies.
Integrate bearish candlestick patterns into your trading toolkit and leverage their predictive power to navigate the dynamic landscape of financial markets with confidence and precision.
Happy trading!
0 notes
Text
Bitcoin, the leading cryptocurrency, has recently faced a significant downturn, trading around $56,697.32. Despite this bearish phase, there are signs of a potential rebound. The Relative Strength Index (RSI) stands at 28.41, indicating oversold conditions typically seen as buying opportunities. Candlestick patterns with long lower shadows suggest buying pressure at lower levels, hinting at a price reversal.
Influential analyst CryptoJack is optimistic, predicting Bitcoin will surpass $100,000 despite the current downturn. He believes Bitcoin is near its bottom, aligning with technical indicators suggesting an oversold market.
Market data from CoinMarketCap shows Bitcoin’s market cap at $1.12 trillion, a 2.63% increase in one day, while the 24-hour trading volume has decreased by 38.03% to $31.91 billion, indicating consolidation. Traders are cautious, but the oversold RSI and bullish patterns support the possibility of a rebound. Watching for signs of reversal could signal the start of a recovery phase.
4 notes
·
View notes
Text
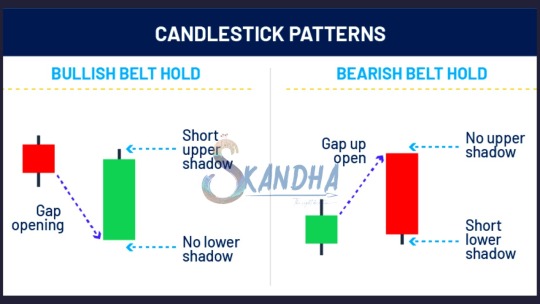
A belt hold pattern suggests that a trend may be reversing and indicates investor sentiment may have changed. When looking at them historically, there will often be a clear trend in one direction, followed by a clear trend in the other direction as the color of the candlestick changes.
There are two types of belt hold candlestick: one bullish and one bearish.
#skandhatrade #belthold #support #resistance #stock #chart #Trade #signal #patterns
#trend #Technicals #analysis #strategies #candlestick #priceaction #entry #supply #demand
To Learn More DM us
We Offer Paid Courses And Training Contact us Via
Email : [email protected]
https://forms.gle/8rWzz1gUuerxwVM49
Website: https://skandhatrade.com/
To Register for Learning:
2 notes
·
View notes
Text
Is the Market Lying to You? Decode Sentiment with the Put Call Ratio
Every chart tells a story. But sometimes, what you see on the surface isn't what the market truly feels. Enter the Put Call Ratio — a surprisingly honest indicator that reveals what traders really expect to happen next.
Think of it this way: if the market’s rising but the Put Call Ratio is also going up, it means traders are still heavily buying puts. Why? Maybe they don’t trust the rally. And often, that kind of fear confirms the uptrend may still have legs.

Now reverse it. Say the market is dropping, but the PCR is super low. Traders aren’t hedging. They’re complacent. That can be a setup for a deeper correction.
The Put Call Ratio doesn’t predict the future. It predicts expectations — and that’s sometimes more valuable. Pair it with volume, trendlines, and your own market bias, and it becomes a sharp tool for spotting crowd psychology gone too far.
Ever wondered what seasoned traders look at before making a move in the stock market? While price charts and news headlines get most of the attention, there's a less obvious yet incredibly insightful metric that many pros quietly rely on — the Put Call Ratio.
So, what exactly is the Put Call Ratio, and why does it matter so much?
At its core, the Put Call Ratio (PCR) is a simple calculation. It tells you how many put options (bets the market will fall) are being traded compared to call options (bets the market will rise). But the magic lies not in the formula — it lies in how traders interpret it.
If the ratio is high, it means more investors are buying puts than calls. That sounds like a bearish signal, right? But here’s the twist — too many puts can actually signal that the market is overly pessimistic. And in the stock market, extreme pessimism often sets the stage for a bounce.
On the flip side, if the ratio is too low, it means everyone’s buying calls. That’s bullish behavior — but again, too much optimism often leads to disappointment. In both cases, the Put Call Ratio works as a contrarian indicator.
Let’s say the Put Call Ratio for the Nifty 50 jumps to 1.6. This doesn’t just suggest traders are fearful — it screams it. Historically, such high PCR levels have preceded sharp upward reversals. It’s like when everyone expects a market crash and starts hedging — the actual bottom may be closer than you think.
But here’s where most newbies get it wrong: they treat the Put Call Ratio like a crystal ball. It’s not. The real value lies in combining it with other tools — maybe a support level on the chart, or RSI indicating oversold conditions. Think of the PCR as a market mood indicator, not a standalone trading signal.
You’ll often see the PCR discussed in terms of volume or open interest. Volume-based PCR focuses on how many contracts were traded that day, while open interest-based PCR looks at all existing contracts. Both give clues, but the open interest variant is usually more reliable for short-term sentiment.
In the Indian market, the Nifty PCR is closely watched — especially during volatile weeks. Many traders consider a PCR between 0.9 and 1.1 as neutral. Anything below 0.8 might indicate extreme optimism (and a potential correction), while anything above 1.3 hints at panic selling (and a potential rebound).
So how can you use the Put Call Ratio to your advantage?
Start by tracking it daily for major indices like Nifty or Bank Nifty. Note the changes and compare them with price movements. Over time, you’ll begin to notice patterns — like PCR rising while the market falls, which could be a signal that the market is about to reverse.
Also, be wary of reading too much into a single day’s data. Market mood swings fast. But a rising or falling trend in PCR over 3–5 sessions? Now that’s worth watching.
In conclusion, the Put Call Ratio may not be as flashy as candlestick patterns or news-based trades, but it offers something more subtle and arguably more powerful — insight into crowd psychology. When used wisely, it can help you avoid crowded trades, spot market tops and bottoms, and add an extra edge to your strategy.
It’s not about predicting the market. It’s about understanding what others expect — and preparing for when they’re likely to be wrong.
0 notes
Text
How to Trade Using Candlestick Patterns for Better Trade Decisions
Candlestick patterns are one of the most widely used tools in technical analysis. They provide valuable insights into market sentiment and potential price movements by analyzing the open, close, high, and low of each trading period. By understanding and using candlestick patterns, traders can make more informed decisions, anticipate market reversals, and optimize entry and exit points.
Here’s how you can use candlestick patterns effectively in your trading strategy.
1. What are Candlestick Patterns?
A candlestick pattern is formed by one or more candlesticks that represent price movements within a given timeframe. Each candlestick shows:
Open price: The price at which the asset opened during the time period.
Close price: The price at which the asset closed during the time period.
High price: The highest price reached during the period.
Low price: The lowest price reached during the period.
Candlestick patterns can be either bullish (indicating an upward price movement) or bearish (indicating a downward price movement), depending on the relationship between the open and close prices.
2. Popular Bullish Candlestick Patterns
Bullish candlestick patterns signal potential upward price movement. Here are a few common ones to look out for:
Bullish Engulfing Pattern: This pattern consists of a small bearish candlestick followed by a larger bullish candlestick that completely engulfs the previous one. It indicates strong buying pressure and often signals the beginning of an uptrend.
Hammer: A hammer candlestick has a small body and a long lower shadow, which indicates that sellers tried to push the price lower, but buyers stepped in and drove the price back up. It suggests a potential reversal from a downtrend to an uptrend.
Morning Star: This pattern consists of three candlesticks: a long bearish candlestick, followed by a small-bodied candlestick, and then a long bullish candlestick. The morning star indicates a potential trend reversal from bearish to bullish.
3. Popular Bearish Candlestick Patterns
Bearish candlestick patterns suggest potential downward price movement. Here are a few common bearish patterns to look for:
Bearish Engulfing Pattern: The opposite of the bullish engulfing pattern, the bearish engulfing consists of a small bullish candlestick followed by a larger bearish candlestick that completely engulfs it. This pattern indicates strong selling pressure and often signals the start of a downtrend.
Shooting Star: The shooting star has a small body and a long upper shadow, signaling that buyers tried to push the price higher but were unable to sustain it. This pattern suggests a potential reversal from an uptrend to a downtrend.
Evening Star: The evening star is the opposite of the morning star, consisting of a long bullish candlestick, followed by a small-bodied candlestick, and then a long bearish candlestick. This pattern indicates a potential reversal from bullish to bearish.
4. Using Candlestick Patterns for Entry and Exit
Candlestick patterns can be used to make more informed decisions about when to enter and exit trades:
Entry: When you identify a bullish reversal pattern (like a bullish engulfing or hammer) at support levels, it could be an indication to enter a long position. Similarly, a bearish reversal pattern (like a bearish engulfing or shooting star) at resistance levels could signal a short position.
Exit: Candlestick patterns can also help with determining exit points. For example, if you are in a long position and a bearish reversal pattern (like an evening star) forms near a resistance level, it might be a signal to close your position or set a stop-loss order to protect your profits.
5. Combining Candlestick Patterns with Other Indicators
While candlestick patterns can provide valuable insights, they work best when combined with other technical indicators to confirm the signals. Here are some tools you can use alongside candlestick patterns:
Support and Resistance: Look for candlestick patterns that form at key support or resistance levels. For example, a bullish engulfing pattern at a support level has a higher probability of success.
Moving Averages: Combine candlestick patterns with moving averages (e.g., 50-day or 200-day MA) to confirm the overall trend. A candlestick pattern that aligns with the trend can be more reliable.
RSI (Relative Strength Index): Use RSI to confirm whether an asset is overbought or oversold. A candlestick reversal pattern accompanied by an overbought or oversold condition can strengthen your trade decision.
6. Practice Patience and Wait for Confirmation
Candlestick patterns should never be used in isolation. They work best when you wait for confirmation before entering a trade. For example:
Volume: If a candlestick pattern forms with high volume, it’s a stronger signal. Volume confirmation helps validate the strength of the pattern.
Other Indicators: Look for confirmation from indicators like RSI or moving averages. For example, a bullish engulfing pattern near a moving average support level combined with an RSI showing oversold conditions may provide a more reliable signal.
Waiting for confirmation ensures you’re not jumping into a trade based on an isolated pattern, which could turn out to be a false signal.
Final Thought: Master Candlestick Patterns for Smarter Trading
Candlestick patterns are a powerful tool that can enhance your trading strategy. By understanding and recognizing common bullish and bearish patterns, you can make more informed decisions about entry and exit points, improve timing, and manage risk more effectively.
Ready to trade smarter with expert-backed strategies? Download Univest — the SEBI-registered trading app that helps you identify profitable candlestick patterns, follow expert strategies, and trade with confidence. Stay ahead of the market and improve your trading success.
0 notes
Text
Ethereum Signals Uptrend With Key Candlestick Pattern, Could A Rally Follow?
In the past few days, Ethereum has been struggling below the $2,600 price level after the general crypto market took a bearish hit, halting its recent upward trend. While ETH’s price has faced notable bearish movements, there is still a possibility that the altcoin could rally in the upcoming weeks as a key bullish pattern emerges. A Possible Rebound Emerging For Ethereum Ethereum’s upward
Read More: You won't believe what happens next... Click here!
1 note
·
View note
Text
Nifty Forecast Tomorrow: Expert Predictions and Market Trends You Should Know
If you're looking for the most accurate Nifty forecast for tomorrow, you're not alone. Every day, thousands of traders and investors closely follow the Nifty 50 index, aiming to anticipate the next market move and get a step ahead of the volatility. In this post, we break down key technical levels, current sentiment, and expert-backed strategies to help you prepare for the trading session ahead.
📊 What Is the Nifty 50 and Why Its Forecast Matters
The Nifty 50 is India’s flagship stock market index, representing 50 of the largest and most liquid companies listed on the National Stock Exchange (NSE). It's a key barometer for market trends and investor confidence.
A well-researched forecast for Nifty 50 movement tomorrow can be highly valuable for:
Intraday traders planning entry and exit points.
Swing traders timing short-term opportunities.
Investors staying aligned with macroeconomic trends.
🔍 Nifty 50 Technical Analysis for Tomorrow
1. Key Support and Resistance Levels
Based on today’s market close and recent trading patterns:
Support zones: 22,300 and 22,180
Resistance zones: 22,500 and 22,640
If the index breaks above 22,500 with momentum, it may push higher. A drop below 22,180 could shift sentiment toward bearish.
2. Moving Averages
Nifty is trading above both 20-day and 50-day EMAs, suggesting the trend remains positive.
The Relative Strength Index (RSI) is around 58–60, reflecting healthy momentum without overbought conditions.
3. Candlestick Pattern
Today’s session showed indecision, forming a neutral candle. A breakout candle or a bullish engulfing pattern tomorrow would be a strong confirmation of upward momentum.
🗣️ Market Sentiment & Global Cues
Sentiment in the market remains cautiously optimistic. Some of the key global and domestic factors influencing the Nifty forecast tomorrow include:
U.S. Federal Reserve commentary on interest rates
Movement in crude oil prices
INR/USD exchange rate fluctuations
Institutional investor activity (FII/DII inflow/outflow)
FIIs were net buyers today, a signal that global appetite for Indian equities remains intact — at least for now.
📈 Expert Outlook: Nifty Forecast for Tomorrow
Analysts are leaning towards a mild bullish trend continuing into tomorrow’s session, assuming no sudden negative cues overnight. That said, volatility is likely to spike during the first hour of trade.
Here are some smart trading reminders:
Don’t chase early price gaps.
Stick to well-defined stop losses.
Wait for volume confirmation, especially near breakout zones.
💡 Tip: A breakout above 22,500 on strong volume could provide a high-probability setup for short-term trades.
🛠️ Action Plan for Traders
Intraday Traders
Observe the first 15–30 minute range for market direction.
Indicators like MACD, RSI, and volume spikes are crucial for timing entries.
Use a trailing stop-loss strategy once in profit.
Positional Traders
Consider adding long positions above 22,500 with upside targets around 22,800.
If Nifty dips below 22,180, reassess and wait for a base to form before entering.
🔗 Live Updates and Tools
Want more granular data? For real-time charts, key levels, and analyst videos, check out the full Nifty 50 forecast and live analysis page.
📬 Final Thoughts
A well-informed Nifty prediction for tomorrow helps traders cut through the noise and take calculated risks. No forecast is 100% guaranteed, but combining technical signals, market sentiment, and global cues can give you an edge.
Trade smart. Stay disciplined. And always have a plan.
#nifty forecast tomorrow#nifty 50 prediction#nifty 50 forecast#nifty technical analysis#nifty trend tomorrow#share market forecast#stock market prediction#nifty outlook#nifty analysis#nifty trading strategy#nifty support and resistance#nifty levels tomorrow#intraday trading tips#stock market india#nifty market trend#nifty tomorrow analysis#nifty movement prediction#NSE forecast#indian stock market forecast#market trend analysis#technical analysis nifty 50#nifty 50 chart#fii dii data analysis#stock market update today#trading view nifty#nifty live updates#nifty chart pattern#nifty stock tips#nifty breakout strategy#nifty candlestick analysis
0 notes
Text
Engulfing Pattern Indicator with Volume Confirmation - indicator MetaTrader 5
Description: This indicator identifies bullish and bearish engulfing candlestick patterns on the chart and optionally confirms them with volume. When the volume of the current candle exceeds that of the previous one, the pattern is considered stronger and more reliable. The user can choose whether or not to apply this volume confirmation filter. External Inputs: BullishArrowColor : Color of the…
0 notes