#Stock Chart Patterns
Explore tagged Tumblr posts
Visit Tumblr Blog
Explore Tumblr blogs with no restrictions, modern design and the best experience.
Last Seen Tumblr Blogs


Fun Fact
Mobile Tumblr US users spend an average of 4.04 minutes per session on the app.
Text
📉 Three Black Crows Pattern: A Powerful Bearish Reversal Signal in Technical Analysis
In the world of candlestick charting, patterns provide traders with insights into potential market movements. One of the most powerful bearish reversal patterns is the Three Black Crows. This pattern is widely recognized for its ability to signal a potential shift from an uptrend to a downtrend, giving traders an early indication to exit long positions or initiate shorts. In this post, we’ll…
#Bearish Candlestick Patterns#bearish chart patterns#bearish engulfing vs Three Black Crows#Bearish reversal candlestick pattern#best trading strategy using Three Black Crows#Candlestick pattern confirmation#Candlestick patterns in trading#day trading reversal setups#how to identify Three Black Crows in stock charts#how to trade Three Black Crows#Japanese candlestick patterns#learn technical analysis#reliable bearish signals in technical analysis#RSI divergence with candlesticks#Short Selling Strategy#Stock Chart Patterns#Stock Market Reversal Patterns#stock markets#stock trading#successful trading#Swing trading strategies#technical analysis#technical indicators for confirmation#Three Black Crows candlestick#Three Black Crows example#Three Black Crows formation#Three Black Crows pattern#Three Black Crows strategy#Three Black Crows technical analysis#Three Black Crows trading
0 notes
Text
Importance of chart analysis for equity investments
Image by freepik Chart analysis, or technical analysis, can be quite helpful for equity investment in the Indian stock market. Here are several reasons why it is beneficial: Benefits of Chart Analysis in the Indian Stock Market 1.Trend Identification The Indian stock market, like any other, exhibits trends over time. Chart analysis helps in identifying these trends, allowing investors to ride…
#chart analysis#equity investment#Financial Markets#Indian stock market#investment strategies#market analysis#Market Sentiment#Stock Charts#Stock Market#Stock Trading#Support and Resistance#Technical Analysis#Technical Indicators#Trading Patterns#Trend Identification#Volume Analysis
3 notes
·
View notes
Text
youtube
Looking to spot trend reversals before the rest of the market catches on? This video breaks down powerful reversal signals every smart trader should know to maximize profits and minimize losses. In this detailed guide, we uncover the top reversal patterns, indicators, and techniques used by successful traders across the stock, forex, and crypto markets. Learn how to identify momentum shifts, trap zones, and entry/exit points that could change the game for your trading strategy. Whether you're day trading, swing trading, or investing long-term, understanding reversal signals is key to protecting your capital and boosting returns. Websites: https://tradegenie.com/ https://nosheekhan.com/ Twitter - https://twitter.com/marketswizard Facebook - https://www.facebook.com/financialmar Head Office: Trade Genie Inc. 315 South Coast Hwy 101, Encinitas, CA 92024 Phone Number: 212-408-3000 #ReversalSignals #TradingProfits #TechnicalAnalysis #PriceAction #ChartPatterns #StockMarketTips #ForexTrading #CryptoSignals #SwingTrading #DayTrading #TrendReversal #SmartTrading #UnlockProfits #TradingEducation #MarketMoves
#Reversal-Signals#Trading-Profits#Technical-Analysis#Price-Action#Chart-Patterns#Stock-Market-Tips#Forex-Trading#Crypto-Signals#Swing-Trading#Day-Trading#Trend-Reversal#Smart-Trading#Trading-Education#Youtube
0 notes
Text
Nifty Forecast Tomorrow: Expert Predictions and Market Trends You Should Know
If you're looking for the most accurate Nifty forecast for tomorrow, you're not alone. Every day, thousands of traders and investors closely follow the Nifty 50 index, aiming to anticipate the next market move and get a step ahead of the volatility. In this post, we break down key technical levels, current sentiment, and expert-backed strategies to help you prepare for the trading session ahead.
📊 What Is the Nifty 50 and Why Its Forecast Matters
The Nifty 50 is India’s flagship stock market index, representing 50 of the largest and most liquid companies listed on the National Stock Exchange (NSE). It's a key barometer for market trends and investor confidence.
A well-researched forecast for Nifty 50 movement tomorrow can be highly valuable for:
Intraday traders planning entry and exit points.
Swing traders timing short-term opportunities.
Investors staying aligned with macroeconomic trends.
🔍 Nifty 50 Technical Analysis for Tomorrow
1. Key Support and Resistance Levels
Based on today’s market close and recent trading patterns:
Support zones: 22,300 and 22,180
Resistance zones: 22,500 and 22,640
If the index breaks above 22,500 with momentum, it may push higher. A drop below 22,180 could shift sentiment toward bearish.
2. Moving Averages
Nifty is trading above both 20-day and 50-day EMAs, suggesting the trend remains positive.
The Relative Strength Index (RSI) is around 58–60, reflecting healthy momentum without overbought conditions.
3. Candlestick Pattern
Today’s session showed indecision, forming a neutral candle. A breakout candle or a bullish engulfing pattern tomorrow would be a strong confirmation of upward momentum.
🗣️ Market Sentiment & Global Cues
Sentiment in the market remains cautiously optimistic. Some of the key global and domestic factors influencing the Nifty forecast tomorrow include:
U.S. Federal Reserve commentary on interest rates
Movement in crude oil prices
INR/USD exchange rate fluctuations
Institutional investor activity (FII/DII inflow/outflow)
FIIs were net buyers today, a signal that global appetite for Indian equities remains intact — at least for now.
📈 Expert Outlook: Nifty Forecast for Tomorrow
Analysts are leaning towards a mild bullish trend continuing into tomorrow’s session, assuming no sudden negative cues overnight. That said, volatility is likely to spike during the first hour of trade.
Here are some smart trading reminders:
Don’t chase early price gaps.
Stick to well-defined stop losses.
Wait for volume confirmation, especially near breakout zones.
💡 Tip: A breakout above 22,500 on strong volume could provide a high-probability setup for short-term trades.
🛠️ Action Plan for Traders
Intraday Traders
Observe the first 15–30 minute range for market direction.
Indicators like MACD, RSI, and volume spikes are crucial for timing entries.
Use a trailing stop-loss strategy once in profit.
Positional Traders
Consider adding long positions above 22,500 with upside targets around 22,800.
If Nifty dips below 22,180, reassess and wait for a base to form before entering.
🔗 Live Updates and Tools
Want more granular data? For real-time charts, key levels, and analyst videos, check out the full Nifty 50 forecast and live analysis page.
📬 Final Thoughts
A well-informed Nifty prediction for tomorrow helps traders cut through the noise and take calculated risks. No forecast is 100% guaranteed, but combining technical signals, market sentiment, and global cues can give you an edge.
Trade smart. Stay disciplined. And always have a plan.
#nifty forecast tomorrow#nifty 50 prediction#nifty 50 forecast#nifty technical analysis#nifty trend tomorrow#share market forecast#stock market prediction#nifty outlook#nifty analysis#nifty trading strategy#nifty support and resistance#nifty levels tomorrow#intraday trading tips#stock market india#nifty market trend#nifty tomorrow analysis#nifty movement prediction#NSE forecast#indian stock market forecast#market trend analysis#technical analysis nifty 50#nifty 50 chart#fii dii data analysis#stock market update today#trading view nifty#nifty live updates#nifty chart pattern#nifty stock tips#nifty breakout strategy#nifty candlestick analysis
0 notes
Text
Mukka Proteins Acquires 51% Stake in GSM Marine Export for ₹14 Crore
Mukka Proteins Limited has announced the successful acquisition of a 51% stake in GSM Marine Export, a partnership firm engaged in the manufacturing of fish meal and fish oil. The acquisition, finalized through capital contribution for a consideration not exceeding ₹14 crore, is in line with the company’s strategic vision to strengthen its core business operations. In its regulatory filing under…

View On WordPress
#MUKKA 52-week high#MUKKA 52-week low#MUKKA EPS#MUKKA NSE#MUKKA P/E ratio#MUKKA price to book ratio#Mukka Proteins dividend yield#Mukka Proteins financials#Mukka Proteins investment analysis#Mukka Proteins Ltd financial ratios#Mukka Proteins Ltd IPO review#Mukka Proteins Ltd share price#Mukka Proteins Ltd stock news#Mukka Proteins market cap#Mukka Proteins quarterly results#Mukka Proteins share#Mukka Proteins share performance#Mukka Proteins shareholding pattern#Mukka Proteins stock analysis#MUKKA stock chart#MUKKA stock forecast#MUKKA stock price#MUKKA stock review#MUKKA stock trading volume#MUKKA stock volatility
0 notes
Text

📉 U.S. Bond Yields Expected to Fall Despite Trade Tensions: What Investors Should Know
In a surprising twist amid growing trade tensions, leading bond strategists predict that U.S. Treasury yields are set to decline in the coming months.
According to a recent Reuters poll, the benchmark 10-year Treasury yield—currently around 4.38%—is expected to drop to 4.21% by June and further down to 4.14% within a year. This projection comes despite market fears that escalating tariffs and inflation pressures could push yields higher. read more
#trade war#bonds#how to trade online#bond yields#how to invest in real estate#u.s.-china trade war#how to invest in stocks#trade sanctions#how to invest#trade negotiations#trade talks#us china trade#how to be a millionaire in 3 years#investor psychology#how to be a millionaire#how to build wealth in your 20s#how to build wealth#trade deal#bond yield#trade wars#china trade#us europe trade#chart patterns#trump trade war impact#trade
0 notes
Text
Unlocking the Power of TradingView: The Best Charting Platform for Traders
A sleek and modern TradingView dashboard displaying real-time charts, candlestick patterns, and powerful technical indicators like RSI and MACD. Are you looking for a powerful, easy-to-use charting tool to enhance your trading? Whether you’re a beginner or an experienced trader, TradingView is one of the best platforms for technical analysis, market insights, and strategy building. And here’s…
#Affiliate Marketing#Automated trading#Candlestick patterns#Crypto trading#Day trading#Forex trading#Investing#MACD#Market analysis#Online trading#passive income#RSI#Stock market#Swing trading#Technical analysis#Trading alerts#Trading bots#Trading platform#Trading signals#Trading strategies#Trading tools#TradingView#TradingView charts#TradingView indicators#TradingView plans#TradingView pricing#TradingView review
0 notes
Text
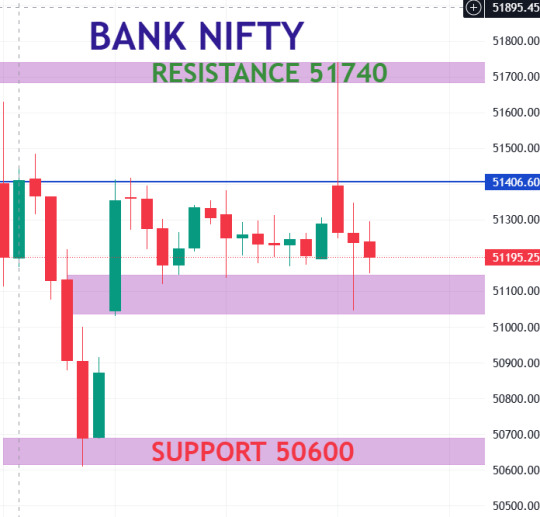

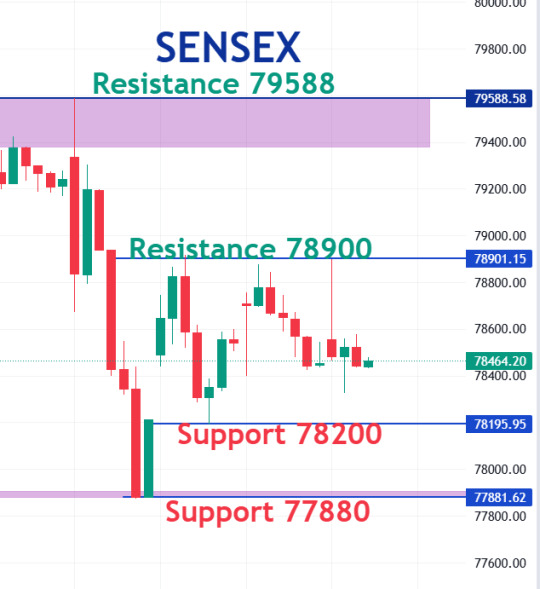
Nift Bannifty Sensex Technical analysis 28 DEC
#stock market#nifty#nifty50#nifty prediction#nifty fifty#banknifty#sensex#nse#bse#bse sensex#share market#technicalanalysis#chart patterns#finnifty#live trading#howtrading2#howtrading
1 note
·
View note
Text
Head and Shoulders Chart Pattern in Stock Trading

The Head and Shoulders pattern is a chart formation that often signals a reversal in the trend of a financial asset like stocks, commodities, or currencies. Traders use this pattern to spot when a market is about to shift from an upward trend to a downward trend (or vice versa), making it an essential tool for both beginners and experienced investors. This pattern has three peaks with the centre peak shaped like a ‘head’ supported by the two ‘shoulders’ or smaller peaks on either side which gives the pattern its name.
Read Full Blog Post: Head and Shoulders Pattern in Technical Analysis
#Head and Shoulders Chart Pattern in Technical Analysis#How to Trade using Head and Shoulders Pattern#Different Types of Head and Shoulders Pattern#Head And Shoulders Pattern In Stock Trading#Inverse head and shoulders pattern
0 notes
Text

GIFT Nifty Indicates Muted Opening; UCO Bank Hikes Lending Rates by 5bps for Certain Tenures
for more details click here
#William J. O'Neil (William O Neil)#CANSLIM#Indian Stock Market#Stock Market Research#Market Outlook#Stock Screener#Stock Watchlists#Chart Pattern#Stock Analysis#Breakout Stocks#Stocks to Watch#Stocks to Buy#Growth Stocks#Stock Investing#Stock Trading#Momentum Investing#IPO Stocks#Fundamental Analysis#Technical Analysis#Stock M#arket Courses#Best Sector To Invest#Top Stock Advisory Services
1 note
·
View note
Text
Gujarat CM Inaugurates State’s Largest Private Cancer Centre at HCG Aastha Cancer Centre, Ahmedabad
Gujarat took a major stride in advanced cancer care with the inauguration of the expanded HCG Aastha Cancer Centre in Ahmedabad by Hon’ble Chief Minister Shri Bhupendra Patel on April 19. Now the largest private cancer care facility in the state, the centre marks a significant milestone in delivering world-class, accessible, and technology-driven oncology services. Located opposite Bhagwat…

View On WordPress
#buy or sell HCG stock#HCG hospital stock#HCG share#HCG share news#HCG share NSE#HCG share price fundamentals#HCG share price growth#HCG share price live update#HCG share price target#HCG share price today#HCG shareholding pattern#HCG stock analysis#HCG stock chart analysis#HCG stock forecast#HCG stock future prediction#HCG stock performance#HCG stock price#Healthcare Global Enterprises share price#Healthcare Global share#should I invest in HCG share
0 notes
Video
youtube
Mastering the DOUBLE BOTTOM FOREX TRADING for Maximum Gain 2023
#youtube#youtube trending#Double Bottom Pattern Explained#Trading Strategies with Double Bottom#Identifying Double Bottom Reversals#Double Bottom Chart Pattern Tutorial#How to Spot Double Bottoms in Forex#Double Bottom Candlestick Patterns#Double Bottom Trading Signals#Double Bottom vs. Double Top Differences#Double Bottom Formation Analysis#Successful Double Bottom Trading Tips#Double Bottom Pattern for Beginners#Real Examples of Double Bottom in Stock Market#Double Bottom Breakout Strategies#Double Bottom Technical Analysis Guide#Common Mistakes in Double Bottom Trading
0 notes
Text
#SHARE MARKET में CANDLESTICK CHART PATTERN (मोमबत्ती ) कैसे काम करती है ?#share market news#candlestick pattern hindi#all candlestick pattern#मोमबत्ती#stock market news in hindi#ecommerce#stock market news in india#share market news today#share market
0 notes
Text
Printable Chart Patterns Cheat Sheet
When trading in the financial markets, clearly understanding chart patterns can be a game-changer. Chart patterns visually represent traders’ price movements to identify potential trading opportunities in such scenarios. A Printable chart patterns cheat sheet comes in handy. Whether you are a seasoned trader or just starting, having access to reliable information on chart patterns is crucial.In…

View On WordPress
#Chart pattern#chart patterns#cheat sheet#Cryptocurrency#FYI#IOS#Pattern recognition#PDF#printable#Stock market#Support and resistance#Technical analysis
1 note
·
View note
Text
🤩 How we made money on REAL?
YouTube Channel: ChartSense_TA
Link: 👇👇👇
youtube
#economy and trade#investors#investment#stockmarket#stocks#technical analysis#youtube#traders#tradingstocks#chart patterns
1 note
·
View note
Text
Advanced Chart Pattern Study Course
1 note
·
View note