#Chart Patterns for Trading
Explore tagged Tumblr posts
Visit Tumblr Blog
Explore Tumblr blogs with no restrictions, modern design and the best experience.
Last Seen Tumblr Blogs


Fun Fact
Tumblr has been providing a Korean-language service since 2013.
Text
Trading Strategies for the Broadening Top Pattern
Understanding the Broadening Top Pattern The Broadening Top Pattern, also referred to as the megaphone pattern, is a classic chart formation that signifies increasing volatility and indecision in the market. This pattern is characterized by a series of higher highs and lower lows, creating a structure that resembles an expanding triangle or a megaphone. Traders often observe this formation…
#Bearish Broadening Top#Breakout Trading Strategy#Broadening Top Examples#Broadening Top Pattern#Broadening Top Reversal#Bullish Broadening Top#Chart Patterns for Trading#How to Trade Broadening Top#learn technical analysis#Megaphone Chart Pattern#Stock Market Chart Analysis#Stock market trading strategies#stock markets#stock trading#successful trading#technical analysis#Technical Analysis Patterns#Trading Risk Management#Trendline Retest Strategy#Volume confirmation in trading
0 notes
Text
Best Online Trading Platform - Flows Trading

Flows Trading is an best online trading platform designed to enhance traders' decision-making and performance. It offers over 100 technical indicators and drawing tools, customizable charting layouts, and real-time market data, allowing for precise technical analysis.
The platform includes a comprehensive trading journal that automatically logs trades and performance metrics, helping users identify strengths and weaknesses.
Additionally, Flows Trading supports programmable custom indicators through a simple scripting language, enabling traders to create and backtest their own indicators.
#best online trading platform#online trading#flows trading#share market#share market analysis#chart patterns
2 notes
·
View notes
Text
:/ turns out i haven't bothered to learn anything for piano in THREE YEARS oh no................
#rubia speaks#it's not that big of a deal like i haven't really craved to play piano or else i would have#and when i feel like playing an instrument i prefer to play guitar. or sometimes ukulele#but not being able to play piano skillfully feels like a failing to me. i felt the same way before i took up crochet again#years ago i got it in my mind that i have to be jack of all trades proficient at all#as if it's.... not enough to do well all of the things i already do well? it's overcompensatory for sure.#i would be in awe of someone with even a quarter of the skills i have but because it's me i feel like i have to make up for being me#by being good at more things#but my knowledge is only at the depth of parlor tricks. i can play a song and a half. i can make a square or a border#but if i have to read complex sheet music or any crochet chart or written pattern my illusion of knowledge crumbles to dust#i might like to take up piano again though at some point. if only to finish learning Goodbye Yellow Brick Road#i was getting kind of fine at playing it. i'm a little bit sad i stopped#(and i do intend to learn more crochet 100%. someday i will learn more things for it)
2 notes
·
View notes
Text
Importance of chart analysis for equity investments
Image by freepik Chart analysis, or technical analysis, can be quite helpful for equity investment in the Indian stock market. Here are several reasons why it is beneficial: Benefits of Chart Analysis in the Indian Stock Market 1.Trend Identification The Indian stock market, like any other, exhibits trends over time. Chart analysis helps in identifying these trends, allowing investors to ride…
#chart analysis#equity investment#Financial Markets#Indian stock market#investment strategies#market analysis#Market Sentiment#Stock Charts#Stock Market#Stock Trading#Support and Resistance#Technical Analysis#Technical Indicators#Trading Patterns#Trend Identification#Volume Analysis
3 notes
·
View notes
Text
Technical Analysis in a Nutshell
Technical analysis is a method used to evaluate and forecast the price movements of financial instruments, such as stocks, commodities, and currencies, by analyzing historical price data and trading volumes. Unlike fundamental analysis, which focuses on a company’s financial health, technical analysis relies on patterns, trends, and statistical indicators to make trading decisions. This article…
#Bollinger Bands#Chart Patterns#Divergence#Entry and Exit Points#Exponential Moving Average#Financial Markets#Fundamental Analysis#MACD#Market Movements#Moving Average#Moving Average Convergence Divergence#Oversold Conditions#Position Sizing#Price Charts#Price Movement#Price Movements#Relative Strength#Risk Management#RSI#Security#Stop-Loss#Support And Resistance#Technical Analysis#Trading Decisions#Trading Strategies#Trading Volume#Trend Lines#Volatility
2 notes
·
View notes
Text
Technical Analysis & Trend Patterns: Learn Share Market Trading the Right Way

At Chart Monks, we believe that trading is a skill — not a gamble. If you’re tired of confusion, indicator overload, or following calls blindly, it’s time to change the way you trade. With our practical approach to technical analysis and real-time understanding of trend continuation patterns, we help you learn online trading the right way — with clarity, confidence, and control.
Whether you're a complete beginner or someone looking to refine your strategies, we offer some of the best trading courses in India tailored to every stage of your journey.
Why Choose Chart Monks to Learn Online Trading?
Unlike traditional platforms that focus heavily on theory or flashy strategies, we simplify the process. At Chart Monks, we teach you to read the price action, understand market psychology, and make independent decisions based on structure and logic — not noise.
Our mission is to provide online trading courses for beginners and intermediate traders that are grounded, actionable, and free from unnecessary complexity.
Trading Classes for Beginners – Build a Strong Foundation
If you're just getting started, you don’t need complicated strategies. You need a strong foundation. That’s why our trading classes for beginners focus on what truly matters:
Understanding how price moves
Identifying market phases
Recognizing demand and supply zones
Reading structure and trend continuation patterns
Managing risk and maintaining discipline
We break down each concept in a simple, visual way that anyone can understand — no financial background needed. You’ll gain the skills to trade independently, without relying on tips or signals.
Share Market Technical Analysis Course – Learn What Really Moves the Market
Our share market technical analysis course is one of the most practical and insightful programs available online in India. We go beyond just candlesticks and indicators. We train you to see the bigger picture — how institutions move the market, how retail traders react, and how you can stay ahead by reading pure price action.
Inside this course, you’ll learn:
How to recognize and trade trend continuation patterns with confidence
How to build high-probability setups using price structure
The psychology behind big moves
How to avoid common traps and false breakouts
Real chart examples from the Indian stock market
This isn’t about memorizing patterns — it’s about understanding why the market moves and where it’s likely to go next.
Avoid Trading Burnout – Train with Clarity and Focus
Many traders face trading burnout not because they lack motivation, but because they’re overwhelmed with too much conflicting information. At Chart Monks, we remove that stress by offering a structured, step-by-step learning journey.
Our approach helps you:
Focus on one system and master it
Avoid information overload from too many sources
Gain mental clarity with simple, repeatable strategies
Build the right mindset to handle wins and losses calmly
At Chart Monks, we believe trading success is 20% strategy and 80% psychology. That’s why we also help you develop the mental discipline to stay consistent.
Online Trading Courses in India – Learn Anytime, Anywhere
We understand that flexibility is important. That’s why we offer all our online courses —so you can learn whenever and wherever it suits you. Whether you're working full-time, in college, or trading part-time, our online trading courses for beginners are designed to fit your schedule.
With our platform, you get:
Lifetime access to course material
Mobile and desktop-friendly video content
Downloadable resources and charts
Live sessions and mentor support
Community access for feedback and progress tracking
No need to travel or attend costly seminars — with Chart Monks, everything is available from the comfort of your home.
What Makes Our Trading Courses Online the Best?
There are many platforms offering trading courses online, but few truly focus on what matters. We stand out by:
Teaching real price action, not just theory
Breaking down live chart examples from the Indian stock market
Focusing on trend continuation patterns and practical setups
Helping you develop a consistent mindset
Offering support through mentorship, not just videos
Keeping things affordable and transparent
We don’t promise overnight success. We promise real skills and lifelong learning.
Free Online Courses for Trading – Start With Zero Risk
Still unsure if our courses are the right fit? Try our free online courses for trading. These mini-courses give you an introduction to how we teach and what we cover. You’ll learn key trading concepts, market structures, and entry-level technical analysis — all at zero cost.
They’re a great way to test the waters and see if our approach aligns with your goals.
Prepared to Begin Your Trading Journey with the Right Approach?
If you’re serious about trading and want to learn in a clear, practical, and mentally sustainable way, Chart Monks is here to guide you. Whether you're looking for trading classes for beginners, a share market technical analysis course, or a full online trading course in India, we’ve got the roadmap you need.Start with our free courses, or dive into our full programs to transform your approach to the market. Call us now at +91-9220943789, Visit: www.chartmonks.com.
#Learn Online Trading#Trading Classes For Beginners#Share Market Technical Analysis Course#Trend Continuation Patterns#Trading Courses Online#Best Trading Courses#Trading Burnout#Free Online courses For Trading#Online Trading Courses For Beginners#Online Trading Course in India#Price Action#Technical Analysis Course#Chart Monks
0 notes
Text
youtube
Looking to spot trend reversals before the rest of the market catches on? This video breaks down powerful reversal signals every smart trader should know to maximize profits and minimize losses. In this detailed guide, we uncover the top reversal patterns, indicators, and techniques used by successful traders across the stock, forex, and crypto markets. Learn how to identify momentum shifts, trap zones, and entry/exit points that could change the game for your trading strategy. Whether you're day trading, swing trading, or investing long-term, understanding reversal signals is key to protecting your capital and boosting returns. Websites: https://tradegenie.com/ https://nosheekhan.com/ Twitter - https://twitter.com/marketswizard Facebook - https://www.facebook.com/financialmar Head Office: Trade Genie Inc. 315 South Coast Hwy 101, Encinitas, CA 92024 Phone Number: 212-408-3000 #ReversalSignals #TradingProfits #TechnicalAnalysis #PriceAction #ChartPatterns #StockMarketTips #ForexTrading #CryptoSignals #SwingTrading #DayTrading #TrendReversal #SmartTrading #UnlockProfits #TradingEducation #MarketMoves
#Reversal-Signals#Trading-Profits#Technical-Analysis#Price-Action#Chart-Patterns#Stock-Market-Tips#Forex-Trading#Crypto-Signals#Swing-Trading#Day-Trading#Trend-Reversal#Smart-Trading#Trading-Education#Youtube
0 notes
Text
Nifty Forecast Tomorrow: Expert Predictions and Market Trends You Should Know
If you're looking for the most accurate Nifty forecast for tomorrow, you're not alone. Every day, thousands of traders and investors closely follow the Nifty 50 index, aiming to anticipate the next market move and get a step ahead of the volatility. In this post, we break down key technical levels, current sentiment, and expert-backed strategies to help you prepare for the trading session ahead.
📊 What Is the Nifty 50 and Why Its Forecast Matters
The Nifty 50 is India’s flagship stock market index, representing 50 of the largest and most liquid companies listed on the National Stock Exchange (NSE). It's a key barometer for market trends and investor confidence.
A well-researched forecast for Nifty 50 movement tomorrow can be highly valuable for:
Intraday traders planning entry and exit points.
Swing traders timing short-term opportunities.
Investors staying aligned with macroeconomic trends.
🔍 Nifty 50 Technical Analysis for Tomorrow
1. Key Support and Resistance Levels
Based on today’s market close and recent trading patterns:
Support zones: 22,300 and 22,180
Resistance zones: 22,500 and 22,640
If the index breaks above 22,500 with momentum, it may push higher. A drop below 22,180 could shift sentiment toward bearish.
2. Moving Averages
Nifty is trading above both 20-day and 50-day EMAs, suggesting the trend remains positive.
The Relative Strength Index (RSI) is around 58–60, reflecting healthy momentum without overbought conditions.
3. Candlestick Pattern
Today’s session showed indecision, forming a neutral candle. A breakout candle or a bullish engulfing pattern tomorrow would be a strong confirmation of upward momentum.
🗣️ Market Sentiment & Global Cues
Sentiment in the market remains cautiously optimistic. Some of the key global and domestic factors influencing the Nifty forecast tomorrow include:
U.S. Federal Reserve commentary on interest rates
Movement in crude oil prices
INR/USD exchange rate fluctuations
Institutional investor activity (FII/DII inflow/outflow)
FIIs were net buyers today, a signal that global appetite for Indian equities remains intact — at least for now.
📈 Expert Outlook: Nifty Forecast for Tomorrow
Analysts are leaning towards a mild bullish trend continuing into tomorrow’s session, assuming no sudden negative cues overnight. That said, volatility is likely to spike during the first hour of trade.
Here are some smart trading reminders:
Don’t chase early price gaps.
Stick to well-defined stop losses.
Wait for volume confirmation, especially near breakout zones.
💡 Tip: A breakout above 22,500 on strong volume could provide a high-probability setup for short-term trades.
🛠️ Action Plan for Traders
Intraday Traders
Observe the first 15–30 minute range for market direction.
Indicators like MACD, RSI, and volume spikes are crucial for timing entries.
Use a trailing stop-loss strategy once in profit.
Positional Traders
Consider adding long positions above 22,500 with upside targets around 22,800.
If Nifty dips below 22,180, reassess and wait for a base to form before entering.
🔗 Live Updates and Tools
Want more granular data? For real-time charts, key levels, and analyst videos, check out the full Nifty 50 forecast and live analysis page.
📬 Final Thoughts
A well-informed Nifty prediction for tomorrow helps traders cut through the noise and take calculated risks. No forecast is 100% guaranteed, but combining technical signals, market sentiment, and global cues can give you an edge.
Trade smart. Stay disciplined. And always have a plan.
#nifty forecast tomorrow#nifty 50 prediction#nifty 50 forecast#nifty technical analysis#nifty trend tomorrow#share market forecast#stock market prediction#nifty outlook#nifty analysis#nifty trading strategy#nifty support and resistance#nifty levels tomorrow#intraday trading tips#stock market india#nifty market trend#nifty tomorrow analysis#nifty movement prediction#NSE forecast#indian stock market forecast#market trend analysis#technical analysis nifty 50#nifty 50 chart#fii dii data analysis#stock market update today#trading view nifty#nifty live updates#nifty chart pattern#nifty stock tips#nifty breakout strategy#nifty candlestick analysis
0 notes
Text
Chart Pattern Analysis in Saudi Arabia:- Ellipsys Financial Market is your trusted transparent forex broker, offers expert forex trading courses and trading solutions. In case you are a beginner or an experienced trader, we provide the tools, education, and transparency needed for success in the global forex market. Learn to trade with confidence, backed by professional support and proven strategies. Choose Ellipsys for trusted forex brokerage and complete trading education to your goals. https://www.elpmarkets.com/patterns.html
0 notes
Text
Trading Chart Patterns PDF Guide & Algo Tools
Mastering Market Moves: The Ultimate Guide to Trading Chart Patterns Book PDF
Introduction
Have you ever looked at a stock chart and thought, “What am I even looking at?” You’re not alone! Deciphering those zig-zagging lines can feel like trying to read an alien language. But what if I told you that those shapes — those patterns — actually tell a story? And once you understand that story, you could make smarter trading decisions. That’s where a trading chart patterns book PDF becomes your secret weapon.
In this article, we'll break down trading chart patterns in a friendly, no-nonsense way. We'll also explore how combining this knowledge with algorithmic trading software — especially the best algo trading software in India — can supercharge your trading game.
Download the best trading chart patterns book PDF. Learn how chart patterns, algorithmic trading software, and the best algo trading software in India help you win.
What Are Trading Chart Patterns?
Think of chart patterns like footprints in the snow. They show you where traders have been — and sometimes where they might go next. A chart pattern is just a visual formation on a price chart that helps traders make predictions. Whether it’s a triangle, a head and shoulders, or a double bottom — these shapes can signal buying or selling opportunities.
Why Use a Trading Chart Patterns Book PDF?
Let’s be real — the internet is loaded with scattered info. But a trading chart patterns book PDF puts everything in one place. It’s your go-to guide, available offline, structured, and perfect for both beginners and seasoned traders. Plus, you can refer to it anytime — even during a coffee break.
The 3 Main Types of Chart Patterns
Just like in movies, there are three main types of chart patterns:
Reversal Patterns: These hint that the trend is about to change.
Continuation Patterns: These suggest the trend will likely continue.
Bilateral Patterns: They could go either way — like a cliffhanger ending.
Understanding these gives you the power to react smartly, not emotionally.
Top Reversal Patterns Explained
Reversal patterns are like plot twists. They tell you the story is changing.
Head and Shoulders: Think of it like a person slumping. It often signals a shift from up to downtrend.
Double Top and Bottom: These patterns look like the letter ‘M’ or ‘W’. They scream, “Change is coming!”
Learning to spot these can save you from a bad trade — or help you enter just in time.
Key Continuation Patterns You Should Know
Continuation patterns keep the story flowing in the same direction.
Triangles (Ascending, Descending, Symmetrical): Imagine price compressing like a spring — ready to break out.
Flags and Pennants: These are like pit stops in a rally. The price pauses, then zooms off again.
Master these, and you’ll catch trends before others even notice.
How to Read Patterns Like a Pro
Reading chart patterns is part art, part science. Here’s how to get good at it:
Use candlestick charts for clarity.
Watch volume — it tells you how strong a move is.
Use support and resistance lines like guardrails.
It’s like learning to read music — confusing at first, but magical once you get it.
Common Mistakes Traders Make
Even the best traders mess up. Here are common traps:
Forcing patterns: If it doesn’t fit, don’t force it.
Ignoring volume: Patterns without strong volume are weak.
Overtrading: Don’t jump into every “almost” pattern.
Remember: Quality over quantity wins the game.
Best Resources for Chart Pattern PDFs
Here are some great places to find your next trading chart patterns book PDF:
Chart Patterns & Technical Indicators by Edward Dobson
Technical Analysis of the Financial Markets by John Murphy
Online libraries like Scribd, Academia, and even Reddit threads
Official broker platforms often offer free downloads
Just make sure you pick one with charts and examples, not just theory.
How Algorithmic Trading Software Helps
This is where things get exciting. Algorithmic trading software uses computer code to place trades. It can recognize patterns faster than any human. When you combine this with your knowledge of chart patterns, you’ve got a winning formula.
It’s like pairing Sherlock Holmes (your pattern spotting) with Watson (your algo software). Together, unbeatable!
Best Algo Trading Software in India
If you’re in India, here are some top-rated options:
Quanttrix – Known for speed and user-friendly interface.
Zerodha Streak – Drag-and-drop logic for non-coders.
AlgoTrader India – Offers institutional-grade automation.
Each has features like backtesting, live execution, and real-time analysis — ideal for traders who want results.
Using Chart Patterns in Algorithmic Strategies
Good algorithmic traders don’t just rely on numbers. They bake in pattern recognition rules:
Code to detect head and shoulders
Alerts for double tops
Algorithms that track breakout triangles
These strategies can be coded in platforms like MetaTrader, Python scripts, or even Streak.
Getting Started With a Chart Pattern Book
Here’s how to start:
Download a recommended trading chart patterns book PDF.
Start with 3-5 basic patterns.
Print a cheat sheet.
Look at real charts daily.
Journal what you see.
Consistency is key — don’t expect overnight success.
Tips to Practice Pattern Recognition
Think of pattern spotting like facial recognition. The more faces (charts) you see, the better you get.
Use trading simulators
Join trader communities
Quiz yourself using historical charts
Mark up charts manually
This hands-on practice boosts your confidence and instincts.
Mobile Apps & Tools for Chart Learning
Want to learn on the go? Try these:
TradingView: Mobile-friendly and packed with features.
Investing.com App: Clean charts and lots of news.
ChartSchool by StockCharts: A mini chart encyclopedia.
These help reinforce what you read in your chart pattern PDF.
Final Thoughts
Trading isn’t magic — it’s mastery. Understanding chart patterns gives you a serious edge. And when paired with powerful algorithmic trading software, especially the best algo trading software in India, you can turn insights into intelligent action.
So go ahead. Download that trading chart patterns book PDF, open up a demo account, and start seeing the market with new eyes. The journey from confusion to clarity starts with one pattern.
FAQs
What is the best trading chart patterns book PDF for beginners? “Technical Analysis for Dummies” and “Chart Patterns Explained” are great PDFs for those starting out.
Can I use chart patterns with algorithmic trading software? Yes! Many algorithmic tools allow you to code or automate pattern recognition and trading rules.
Which is the best algo trading software in India? Quanttrix and Zerodha Streak are widely recommended due to their user-friendly tools and performance.
Are trading chart patterns reliable for predicting markets? They’re not perfect, but when combined with volume and confirmation signals, they greatly improve your odds.
Where can I practice chart pattern recognition for free? Websites like TradingView and platforms like MetaTrader offer free tools and demo accounts.
0 notes
Text
Learn Different Types of Chart Patterns
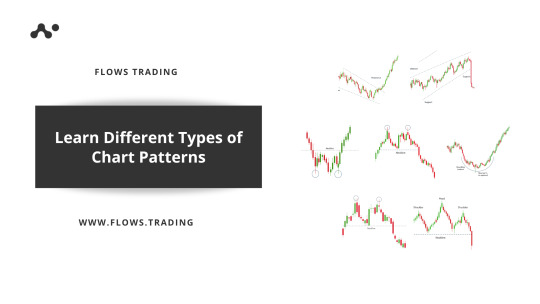
Make exceptional financial gains by analyzing different types of chart patterns in trading. Traders use these charts to get equipped with the nature of the market. It requires experience to gain accuracy, but never too late to start learning about them with a keen eye.
#types of chart patterns#different chart patterns#trading chart patterns#chart patterns#flows trading
1 note
·
View note
Text
Mukka Proteins Acquires 51% Stake in GSM Marine Export for ₹14 Crore
Mukka Proteins Limited has announced the successful acquisition of a 51% stake in GSM Marine Export, a partnership firm engaged in the manufacturing of fish meal and fish oil. The acquisition, finalized through capital contribution for a consideration not exceeding ₹14 crore, is in line with the company’s strategic vision to strengthen its core business operations. In its regulatory filing under…

View On WordPress
#MUKKA 52-week high#MUKKA 52-week low#MUKKA EPS#MUKKA NSE#MUKKA P/E ratio#MUKKA price to book ratio#Mukka Proteins dividend yield#Mukka Proteins financials#Mukka Proteins investment analysis#Mukka Proteins Ltd financial ratios#Mukka Proteins Ltd IPO review#Mukka Proteins Ltd share price#Mukka Proteins Ltd stock news#Mukka Proteins market cap#Mukka Proteins quarterly results#Mukka Proteins share#Mukka Proteins share performance#Mukka Proteins shareholding pattern#Mukka Proteins stock analysis#MUKKA stock chart#MUKKA stock forecast#MUKKA stock price#MUKKA stock review#MUKKA stock trading volume#MUKKA stock volatility
0 notes
Text

📉 U.S. Bond Yields Expected to Fall Despite Trade Tensions: What Investors Should Know
In a surprising twist amid growing trade tensions, leading bond strategists predict that U.S. Treasury yields are set to decline in the coming months.
According to a recent Reuters poll, the benchmark 10-year Treasury yield—currently around 4.38%—is expected to drop to 4.21% by June and further down to 4.14% within a year. This projection comes despite market fears that escalating tariffs and inflation pressures could push yields higher. read more
#trade war#bonds#how to trade online#bond yields#how to invest in real estate#u.s.-china trade war#how to invest in stocks#trade sanctions#how to invest#trade negotiations#trade talks#us china trade#how to be a millionaire in 3 years#investor psychology#how to be a millionaire#how to build wealth in your 20s#how to build wealth#trade deal#bond yield#trade wars#china trade#us europe trade#chart patterns#trump trade war impact#trade
0 notes
Text
Unlocking the Power of TradingView: The Best Charting Platform for Traders
A sleek and modern TradingView dashboard displaying real-time charts, candlestick patterns, and powerful technical indicators like RSI and MACD. Are you looking for a powerful, easy-to-use charting tool to enhance your trading? Whether you’re a beginner or an experienced trader, TradingView is one of the best platforms for technical analysis, market insights, and strategy building. And here’s…
#Affiliate Marketing#Automated trading#Candlestick patterns#Crypto trading#Day trading#Forex trading#Investing#MACD#Market analysis#Online trading#passive income#RSI#Stock market#Swing trading#Technical analysis#Trading alerts#Trading bots#Trading platform#Trading signals#Trading strategies#Trading tools#TradingView#TradingView charts#TradingView indicators#TradingView plans#TradingView pricing#TradingView review
0 notes
Text
Why Every Trader Should Learn Multiple Charts Pattern Analysis

In the dynamic world of trading, patterns are more than just lines and shapes on a chart—they are visual representations of market psychology, a roadmap to potential price movement. For traders looking to enhance their market analysis and decision-making skills, learning Multiple Charts Pattern analysis is not just beneficial—it’s essential.
Whether you're new to trading or a seasoned market participant, understanding various chart patterns can dramatically improve your success rate. This article explores why every trader should learn Multiple Charts Pattern analysis and how this skill forms the foundation of profitable trading strategies.
The Power of Patterns in Trading
Each chart pattern captures the interplay of buyer and seller psychology, offering a glimpse into market sentiment. These patterns, when correctly interpreted, can signal whether the market is likely to continue its current direction or reverse course. Patterns such as head and shoulders, double tops and bottoms, triangles, flags, and wedges provide traders with clear entry and exit signals.
However, relying on just one or two familiar patterns can limit your potential. The complexity of markets is reflected in the diverse and intricate patterns they produce. That’s why it’s important to learn Multiple Charts Pattern analysis—to broaden your perspective and increase your adaptability in different market conditions.
What is Multiple Charts Pattern Analysis?
Multiple Charts Pattern Analysis is the practice of studying and recognizing a wide range of technical chart patterns across various timeframes and market scenarios. Rather than focusing solely on one chart type or timeframe, traders analyze different patterns from candlestick charts, bar charts, line charts, and more. They also explore these patterns across daily, weekly, and intraday time frames to get a comprehensive view of market behavior.
This approach helps traders spot potential setups with greater accuracy, avoid false signals, and align their trades with the broader market trend.
Benefits of Learning Multiple Charts Pattern Analysis
Improved Decision Making: When you learn Multiple Charts Pattern techniques, you gain a structured way to interpret market data. This leads to better, faster decision-making and increased confidence in your trades.
Greater Flexibility in Trading Strategies: Not all markets move the same way. By mastering different chart patterns, you can adapt your trading strategy to suit trending, ranging, or volatile markets.
Reduced Emotional Trading: Fear and greed can cloud judgment, leading traders to act on impulse rather than logic. A solid understanding of chart patterns adds discipline to your trading, helping you rely on logic and analysis instead of gut feelings.
Enhanced Risk Management: Most chart patterns come with well-defined areas for placing stop-loss and take-profit orders. This clarity allows for better risk-reward setups, keeping losses small and maximizing potential gains.
How to Start Learning Multiple Charts Pattern Analysis?
With the growing availability of trading courses online, mastering this skill is more accessible than ever. With structured guidance, practical demonstrations, and community support, online courses help traders go from beginner to advanced level at their own pace.
When looking to learn trading online, make sure the course includes:
A wide variety of chart patterns
Real-world trading examples
Practice charts and quizzes
Access to mentors or peer groups
The best online trading course will not only teach you the patterns but also show you how to apply them in live market scenarios.
Why Traders Prefer Online Learning?
More traders today are turning to online trading courses due to their accessibility, flexibility, and cost-effectiveness. Instead of spending hours sifting through scattered resources, these courses offer a streamlined path with expert insights and practical tips.
At Chart Monks, for example, our online trading course is designed specifically to help you learn Multiple Charts Pattern analysis in a structured and engaging way. From beginner-level basics to advanced strategies, our course modules guide you through every step of the journey with clarity and confidence.
Real-World Application of Multiple Chart Patterns
Consider a situation where a head and shoulders pattern develops on the daily chart, while a bullish flag takes shape on the 15-minute timeframe. A trader who understands both patterns can make a more informed decision—perhaps waiting for the intraday breakout to align with the longer-term trend reversal before entering a trade.
This kind of multi-pattern, multi-timeframe approach allows for:
Stronger confirmation before trade execution
Precision in entry and exit points
Reduced risk due to enhanced clarity
Such insights are only possible when you've committed the time to learn Multiple Charts Pattern analysis thoroughly.
Final Thoughts
To keep up with the ever-changing markets, your trading game must keep improving. Limiting yourself to a handful of patterns may provide short-term success, but if you're aiming for long-term consistency, mastering Multiple Charts Pattern Analysis is crucial.
With the right online trading course, dedication, and practice, any trader can develop this vital skill. So if you’re serious about leveling up your trading game, it’s time to learn Multiple Charts Pattern analysis and turn uncertainty into opportunity.
Ready to start your journey? Take the next step in your trading journey by visiting Chart Monks and exploring our expert-led online courses. Learn at your own pace, sharpen your skills, and become a more confident and consistent trader.
#Learn Multiple Charts Pattern#Multiple Charts Pattern Analysis#Learn Trading Online#Online Trading Course#Trading Courses Online#Chart Monk
0 notes
Text
How to Trade Using Cup and Handle Chart Pattern
The cup and handle pattern is a decades-old chart pattern that was popularised by William J. O'Neil, a well-known investor and the founder of Investor's Business Daily. He introduced this concept in his book How to Make Money in Stocks, published in the 1980s. O'Neil observed that this pattern often appears in stocks before they make significant upward moves, especially when supported by strong trading volume during the breakout.
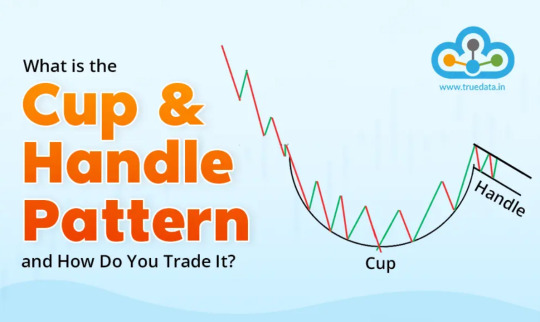
This pattern is used to identify potential bullish trends in stocks, commodities, or other financial instruments. The pattern gets its name due to its distinct resemblance to a cup with a handle when viewed on a price chart. The pattern begins with a rounded, U-shaped decline and recovery, forming the ‘cup’. After the cup is formed, there is a smaller, sideways or slightly downward consolidation phase, creating the ‘handle’. This handle typically represents a brief pause before the price breaks out in an upward direction.
Read More: https://www.truedata.in/blog/what-is-cup-and-handle-pattern-and-how-to-trade-it
#What is Cup and Handle Chart Pattern#How to Trade Using Cup and Handle Chart Pattern#Pros and Cons of using the Cup and Handle Pattern for Trading
0 notes