#data pipeline
Explore tagged Tumblr posts
Visit Tumblr Blog
Explore Tumblr blogs with no restrictions, modern design and the best experience.
Last Seen Tumblr Blogs


Fun Fact
Celebrities use Tumblr as well.
Text
Numbers in free verse?
This piece recasts data pipelines as unstoppable storytellers.
Your views on data will shift.
Read more here:
#machinelearning#artificialintelligence#art#digitalart#mlart#datascience#ai#algorithm#bigdata#pipeline#data pipeline#storytelling
3 notes
·
View notes
Text
Data Workflow Automation: Tools, Strategies, and Real-World Use Cases

Data workflow automation transforms how businesses handle data, making processes faster and more reliable. It’s like setting your data on autopilot, freeing you to focus on insights. This blog dives into what data workflow automation is, top tools, strategies, and real-world applications.
What Is Data Workflow Automation?
Data workflow automation uses tools to streamline data tasks like extraction, transformation, and loading (ETL). It eliminates manual work, moving data smoothly from sources like databases or APIs to analytics platforms. Automation saves time, reduces errors, and powers real-time decision-making.
Why It Matters
Businesses deal with massive data daily. Manual processing is slow and prone to mistakes. Automated workflows speed up data delivery, ensuring accuracy and scalability. They let teams focus on strategy, not repetitive tasks, making them vital for industries like retail and healthcare.
Top Tools for Data Workflow Automation
Choosing the right tool is key. Here are some popular options:
Apache Airflow: Schedules and manages complex workflows with ease.
AWS Glue: A serverless ETL tool for cloud-based automation.
Apache NiFi: Excels in real-time data processing and integration.
Google Cloud Dataflow: Scales for large datasets with minimal setup.
Pick tools based on your needs, like scalability or real-time capabilities.
Strategies for Effective Automation
To succeed, follow these strategies:
Define Goals: Know what you want—faster analytics or cost savings—to guide your setup.
Ensure Data Quality: Validate and clean data to avoid errors in automated flows.
Monitor Workflows: Use alerts and metrics to catch issues early.
Prioritize Security: Encrypt data and limit access to ensure compliance.
Start Small: Test with a pilot project before scaling up.
These steps keep your workflows efficient and reliable.
Real-World Use Cases
Automation shines across industries:
Retail: Automates customer data analysis for personalized marketing.
Finance: Processes transactions in real-time for fraud detection.
Healthcare: Streamlines patient data for faster diagnostics.
Marketing: Tracks campaign performance instantly for optimization.
For example, a retailer might automate data from online sales to tailor promotions, boosting revenue.
Getting Started
Ready to automate? Follow these steps:
Identify manual bottlenecks in your data processes.
Choose a tool that fits your infrastructure.
Test a small workflow to ensure reliability.
Scale up with confidence.
Conclusion
Data workflow automation boosts efficiency, accuracy, and scalability. By using tools like Apache Airflow and strategies like monitoring and security, businesses can transform data operations. Explore automation to unlock faster insights and stay ahead.
"Curious about data pipeline automation? Dive into the blog to explore Types of Data Pipelines and Key Components for smarter, faster data workflows!"
0 notes
Text
The concerted effort of maintaining application resilience
New Post has been published on https://thedigitalinsider.com/the-concerted-effort-of-maintaining-application-resilience/
The concerted effort of maintaining application resilience
Back when most business applications were monolithic, ensuring their resilience was by no means easy. But given the way apps run in 2025 and what’s expected of them, maintaining monolithic apps was arguably simpler.
Back then, IT staff had a finite set of criteria on which to improve an application’s resilience, and the rate of change to the application and its infrastructure was a great deal slower. Today, the demands we place on apps are different, more numerous, and subject to a faster rate of change.
There are also just more applications. According to IDC, there are likely to be a billion more in production by 2028 – and many of these will be running on cloud-native code and mixed infrastructure. With technological complexity and higher service expectations of responsiveness and quality, ensuring resilience has grown into being a massively more complex ask.
Multi-dimensional elements determine app resilience, dimensions that fall into different areas of responsibility in the modern enterprise: Code quality falls to development teams; infrastructure might be down to systems administrators or DevOps; compliance and data governance officers have their own needs and stipulations, as do cybersecurity professionals, storage engineers, database administrators, and a dozen more besides.
With multiple tools designed to ensure the resilience of an app – with definitions of what constitutes resilience depending on who’s asking – it’s small wonder that there are typically dozens of tools that work to improve and maintain resilience in play at any one time in the modern enterprise.
Determining resilience across the whole enterprise’s portfolio, therefore, is near-impossible. Monitoring software is silo-ed, and there’s no single pane of reference.
IBM’s Concert Resilience Posture simplifies the complexities of multiple dashboards, normalizes the different quality judgments, breaks down data from different silos, and unifies the disparate purposes of monitoring and remediation tools in play.
Speaking ahead of TechEx North America (4-5 June, Santa Clara Convention Center), Jennifer Fitzgerald, Product Management Director, Observability, at IBM, took us through the Concert Resilience Posture solution, its aims, and its ethos. On the latter, she differentiates it from other tools:
“Everything we’re doing is grounded in applications – the health and performance of the applications and reducing risk factors for the application.”
The app-centric approach means the bringing together of the different metrics in the context of desired business outcomes, answering questions that matter to an organization’s stakeholders, like:
Will every application scale?
What effects have code changes had?
Are we over- or under-resourcing any element of any application?
Is infrastructure supporting or hindering application deployment?
Are we safe and in line with data governance policies?
What experience are we giving our customers?
Jennifer says IBM Concert Resilience Posture is, “a new way to think about resilience – to move it from a manual stitching [of other tools] or a ton of different dashboards.” Although the definition of resilience can be ephemeral, according to which criteria are in play, Jennifer says it’s comprised, at its core, of eight non-functional requirements (NFRs):
Observability
Availability
Maintainability
Recoverability
Scalability
Usability
Integrity
Security
NFRs are important everywhere in the organization, and there are perhaps only two or three that are the sole remit of one department – security falls to the CISO, for example. But ensuring the best quality of resilience in all of the above is critically important right across the enterprise. It’s a shared responsibility for maintaining excellence in performance, potential, and safety.
What IBM Concert Resilience Posture gives organizations, different from what’s offered by a collection of disparate tools and beyond the single-pane-of-glass paradigm, is proactivity. Proactive resilience comes from its ability to give a resilience score, based on multiple metrics, with a score determined by the many dozens of data points in each NFR. Companies can see their overall or per-app scores drift as changes are made – to the infrastructure, to code, to the portfolio of applications in production, and so on.
“The thought around resilience is that we as humans aren’t perfect. We’re going to make mistakes. But how do you come back? You want your applications to be fully, highly performant, always optimal, with the required uptime. But issues are going to happen. A code change is introduced that breaks something, or there’s more demand on a certain area that slows down performance. And so the application resilience we’re looking at is all around the ability of systems to withstand and recover quickly from disruptions, failures, spikes in demand, [and] unexpected events,” she says.
IBM’s acquisition history points to some of the complimentary elements of the Concert Resilience Posture solution – Instana for full-stack observability, Turbonomic for resource optimization, for example. But the whole is greater than the sum of the parts. There’s an AI-powered continuous assessment of all elements that make up an organization’s resilience, so there’s one place where decision-makers and IT teams can assess, manage, and configure the full-stack’s resilience profile.
The IBM portfolio of resilience-focused solutions helps teams see when and why loads change and therefore where resources are wasted. It’s possible to ensure that necessary resources are allocated only when needed, and systems automatically scale back when they’re not. That sort of business- and cost-centric capability is at the heart of app-centric resilience, and means that a company is always optimizing its resources.
Overarching all aspects of app performance and resilience is the element of cost. Throwing extra resources at an under-performing application (or its supporting infrastructure) isn’t a viable solution in most organizations. With IBM, organizations get the ability to scale and grow, to add or iterate apps safely, without necessarily having to invest in new provisioning, either in the cloud or on-premise. Plus, they can see how any changes impact resilience. It’s making best use of what’s available, and winning back capacity – all while getting the best performance, responsiveness, reliability, and uptime across the enterprise’s application portfolio.
Jennifer says, “There’s a lot of different things that can impact resilience and that’s why it’s been so difficult to measure. An application has so many different layers underneath, even in just its resources and how it’s built. But then there’s the spider web of downstream impacts. A code change could impact multiple apps, or it could impact one piece of an app. What is the downstream impact of something going wrong? And that’s a big piece of what our tools are helping organizations with.”
You can read more about IBM’s work to make today and tomorrow’s applications resilient.
#2025#acquisition#ADD#ai#AI-powered#America#app#application deployment#application resilience#applications#approach#apps#assessment#billion#Business#business applications#change#CISO#Cloud#Cloud-Native#code#Companies#complexity#compliance#continuous#convention#cybersecurity#data#Data Governance#data pipeline
0 notes
Text
Data pipeline| Match Data Pro LLC
Maximize efficiency with Match Data Pro LLC's automated data pipeline solutions. Seamlessly configure and execute end-to-end workflows for profiling, cleansing, entity resolution, and fuzzy matching. Trigger jobs manually, via API, or on a schedule with real-time notifications and email confirmations.

Data pipeline
0 notes
Text
0 notes
Text
Flexible Hiring for the Role of Data Engineer in Singapore | Applify
A Role of Data Engineer is a crucial part of any data-driven organization. In this role, you will be responsible for designing, building, and maintaining the architecture and systems that allow for the collection, Role of Data Engineer, transformation, and storage of data. You will collaborate with Data Scientists, Analysts, and other stakeholders to ensure that clean, high-quality data is available to drive business decisions and innovations.
#Data Engineer#Cloud Data Engineer#ETL Developer#Data Pipeline#Data Integration#SQL Engineer#Data Infrastructure
0 notes
Text
Hire DevOps Engineers for CI CD & Cloud Automation
Looking to Hire DevOps engineers for cloud automation? Reach out to professionals like Spiral Mantra leveraging services like DevOps pipeline management, DevOps configuration management, and managed DevOps services for enterprises. Whether you need AWS DevOps consulting or Azure DevOps consulting services, we provide tailored solutions to enhance your DevOps tools & platform efficiency.
0 notes
Text

Explore the blog to learn how to develop a data pipeline for effective data management. Discover the key components, best practices, applications, hurdles, and solutions to streamline processes.
0 notes
Text

AWS Data Pipeline vs. Amazon Kinesis: Choosing the Right Tool for Your Data Needs
Struggling to decide between AWS Data Pipeline and Amazon Kinesis for your data processing needs? Dive into this quick comparison to understand how each service stacks up. AWS Data Pipeline offers a progressive, precise scheduling approach for batch jobs and reporting, while Amazon Kinesis excels at streaming real-time data for immediate insights Whether you’re looking to consume quick implementation, cost optimization, or real-time analytics, this guide will help you find the right one for your business .
0 notes
Text
Building Robust Data Pipelines: Best Practices for Seamless Integration
Learn the best practices for building and managing scalable data pipelines. Ensure seamless data flow, real-time analytics, and better decision-making with optimized pipelines.
0 notes
Text
Stages of the Data Pipeline Development Process

Data pipeline development is a complex and challenging process that requires a systematic approach. Read the blog to understand what are the steps you should follow to build a successful data pipeline.
1 note
·
View note
Text
How to Build a Scalable Data Pipeline for Your Product
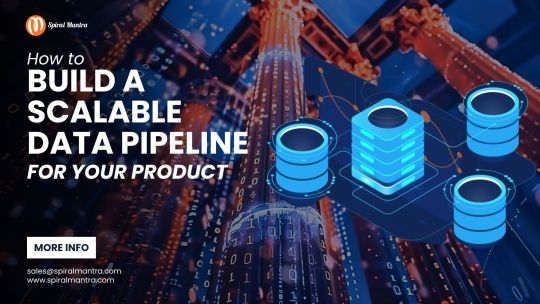
If your business is product-driven, a scalable data pipeline is essential for making informed decisions and driving innovation. A data pipeline ensures the smooth flow of unstructured data from its raw source to actionable insights, though it involves more than just simple data transfer. This article will guide you through the key steps in building a scalable data pipeline and highlight the services offered by Spiral Mantra in data engineering and analysis. Stick around to get the full picture!
Latest Tech Trends in Data Pipelines
Generative AI is transforming machine learning, especially in content creation across formats like audio, images, videos, and text. It can also streamline data pipeline management, improving efficiency. Spiral Mantra stands out as a leader in this area, offering precision data pipeline services across sub-domains such as big data and cloud orchestration.
1. Understanding the Need for a Scalable Data Pipeline
A scalable data pipeline is key to managing raw information as your business grows. Most companies collect vast amounts of data that they may not fully realize. The data pipeline follows an ETL (Extract, Transform, Load) process, which extracts raw data, processes it, and stores it for further analysis. Scalability ensures that as your business grows and data becomes more complex, the system can handle the increased workload efficiently.
2. Key Components of a Scalable Data Pipeline
Data Ingestion
The first step in the data pipeline is collecting data from multiple sources, including APIs, databases, and third-party integrations. Scalable systems must be able to handle both batch and real-time data ingestion.
Data Processing and Transformation
Raw data is often unstructured and requires cleaning, formatting, and transforming into usable formats. This step must be efficient and scalable to maintain data quality while processing larger volumes.
Data Analysis
Once your data is processed, it's time to analyze it. Whether you’re using cloud storage or custom servers, your system should scale to accommodate current and future data analysis needs. This is especially crucial for AI applications that rely on large datasets.
Data Orchestration
Data orchestration involves automating the scheduling, management, and monitoring of data pipelines. This ensures that as your system grows, everything continues to run smoothly without manual intervention.
3. Building a Scalable Data Pipeline (ETL Process)
a) Define Your Business Requirements
The first step in building a scalable pipeline is to clearly define your business needs. What kind of data do you collect? How often does it need to be processed? Defining these requirements upfront will help you design a system that meets your specific needs.
b) Choose the Right Technology Stack
Selecting the right tools is crucial for scalability. For real-time ingestion, you might opt for Apache Kafka or Nifi. For processing large datasets, Apache Spark or Flink are excellent choices. For scalable storage solutions, consider Amazon S3, Google BigQuery, or Apache Cassandra. These tools will ensure your pipeline grows with your business.
c) Build for Automation
A scalable data pipeline should run 24/7 without requiring human intervention. Automation is critical in ensuring this. Tools like Apache Airflow can help automate, monitor, and scale your data pipelines seamlessly.
d) Optimize for Real-Time Processing
Real-time processing enables quicker decision-making. Adding tools like Apache Storm or Kafka Streams can allow your system to process data as it arrives, giving you up-to-the-minute insights.
e) Ensure Data Quality and Security
Data quality is vital for a scalable pipeline. There must be rules for verifying, cleansing, and de-duplicating incoming data. Additionally, security measures should be built into every step of the process to protect sensitive business information from potential breaches.
4. Challenges in Building a Scalable Data Pipeline
Volume of Data
As the volume of data grows, your system might struggle to process or store it efficiently, potentially causing bottlenecks. Proper resource allocation, such as memory or disk space, is essential.
Cost Management
Scalability often comes with higher costs, especially when using cloud services. Balancing scalability and cost efficiency can be challenging, but it’s critical to managing your budget effectively.
Complexity
Building a scalable pipeline involves multiple components and technologies. Mastering the necessary skills in data engineering, cloud computing, and DevOps can be a hurdle, but Spiral Mantra offers end-to-end solutions to minimize complexity.
Conclusion
Building a scalable data pipeline is essential for any product-focused business. It ensures that your data infrastructure can grow alongside your business, allowing you to process more data, support more users, and make better decisions. Whether you need help with a specific part of the data lifecycle or require assistance with the entire system, Spiral Mantra’s team of experts can provide the support you need. From app development to full-scale digital transformation, we have the tools and expertise to help your business succeed.
FAQs
1. What is a scalable data pipeline?
A scalable data pipeline is a system designed to handle increasing volumes of data as your business grows, ensuring smooth data processing and storage.
2. Why is automation important in a data pipeline?
Automation allows the pipeline to run continuously without manual intervention, ensuring efficiency and scalability.
3. What tools are used for real-time data processing?
Tools like Apache Storm and Kafka Streams are commonly used for real-time data processing in a scalable pipeline.
4. How can I ensure data security in my pipeline?
Implementing security measures at every step of the pipeline, including data encryption and regular audits, is essential for protecting sensitive information.
5. What challenges should I expect when scaling a data pipeline?
Challenges include managing large volumes of data, balancing costs, and mastering the complexities of different technologies and tools.
#data pipeline#data pipeline tools#data pipeline services#data engineering#data engineering services
0 notes
Text
How Walled Gardens in Public Safety Are Exposing America’s Data Privacy Crisis
New Post has been published on https://thedigitalinsider.com/how-walled-gardens-in-public-safety-are-exposing-americas-data-privacy-crisis/
How Walled Gardens in Public Safety Are Exposing America’s Data Privacy Crisis

The Expanding Frontier of AI and the Data It Demands
Artificial intelligence is rapidly changing how we live, work and govern. In public health and public services, AI tools promise more efficiency and faster decision-making. But beneath the surface of this transformation is a growing imbalance: our ability to collect data has outpaced our ability to govern it responsibly.
This goes beyond just a tech challenge to be a privacy crisis. From predictive policing software to surveillance tools and automated license plate readers, data about individuals is being amassed, analyzed and acted upon at unprecedented speed. And yet, most citizens have no idea who owns their data, how it’s used or whether it’s being safeguarded.
I’ve seen this up close. As a former FBI Cyber Special Agent and now the CEO of a leading public safety tech company, I’ve worked across both the government and private sector. One thing is clear: if we don’t fix the way we handle data privacy now, AI will only make existing problems worse. And one of the biggest problems? Walled gardens.
What Are Walled Gardens And Why Are They Dangerous in Public Safety?
Walled gardens are closed systems where one company controls the access, flow and usage of data. They’re common in advertising and social media (think platforms Facebook, Google and Amazon) but increasingly, they’re showing up in public safety too.
Public safety companies play a key role in modern policing infrastructure, however, the proprietary nature of some of these systems means they aren’t always designed to interact fluidly with tools from other vendors.
These walled gardens may offer powerful functionality like cloud-based bodycam footage or automated license plate readers, but they also create a monopoly over how data is stored, accessed and analyzed. Law enforcement agencies often find themselves locked into long-term contracts with proprietary systems that don’t talk to each other. The result? Fragmentation, siloed insights and an inability to effectively respond in the community when it matters most.
The Public Doesn’t Know, and That’s a Problem
Most people don’t realize just how much of their personal information is flowing into these systems. In many cities, your location, vehicle, online activity and even emotional state can be inferred and tracked through a patchwork of AI-driven tools. These tools can be marketed as crime-fighting upgrades, but in the absence of transparency and regulation, they can easily be misused.
And it’s not just that the data exists, but that it exists in walled ecosystems that are controlled by private companies with minimal oversight. For example, tools like license plate readers are now in thousands of communities across the U.S., collecting data and feeding it into their proprietary network. Police departments often don’t even own the hardware, they rent it, meaning the data pipeline, analysis and alerts are dictated by a vendor and not by public consensus.
Why This Should Raise Red Flags
AI needs data to function. But when data is locked inside walled gardens, it can’t be cross-referenced, validated or challenged. This means decisions about who is pulled over, where resources go or who is flagged as a threat are being made based on partial, sometimes inaccurate information.
The risk? Poor decisions, potential civil liberties violations and a growing gap between police departments and the communities they serve. Transparency erodes. Trust evaporates. And innovation is stifled, because new tools can’t enter the market unless they conform to the constraints of these walled systems.
In a scenario where a license plate recognition system incorrectly flags a stolen vehicle based on outdated or shared data, without the ability to verify that information across platforms or audit how that decision was made, officers may act on false positives. We’ve already seen incidents where flawed technology led to wrongful arrests or escalated confrontations. These outcomes aren’t hypothetical, they’re happening in communities across the country.
What Law Enforcement Actually Needs
Instead of locking data away, we need open ecosystems that support secure, standardized and interoperable data sharing. That doesn’t mean sacrificing privacy. On the contrary, it’s the only way to ensure privacy protections are enforced.
Some platforms are working toward this. For example, FirstTwo offers real-time situational awareness tools that emphasize responsible integration of publically-available data. Others, like ForceMetrics, are focused on combining disparate datasets such as 911 calls, behavioral health records and prior incident history to give officers better context in the field. But crucially, these systems are built with public safety needs and community respect as a priority, not an afterthought.
Building a Privacy-First Infrastructure
A privacy-first approach means more than redacting sensitive information. It means limiting access to data unless there is a clear, lawful need. It means documenting how decisions are made and enabling third-party audits. It means partnering with community stakeholders and civil rights groups to shape policy and implementation. These steps result in strengthened security and overall legitimacy.
Despite the technological advances, we’re still operating in a legal vacuum. The U.S. lacks comprehensive federal data privacy legislation, leaving agencies and vendors to make up the rules as they go. Europe has GDPR, which offers a roadmap for consent-based data usage and accountability. The U.S., by contrast, has a fragmented patchwork of state-level policies that don’t adequately address the complexities of AI in public systems.
That needs to change. We need clear, enforceable standards around how law enforcement and public safety organizations collect, store and share data. And we need to include community stakeholders in the conversation. Consent, transparency and accountability must be baked into every level of the system, from procurement to implementation to daily use.
The Bottom Line: Without Interoperability, Privacy Suffers
In public safety, lives are on the line. The idea that one vendor could control access to mission-critical data and restrict how and when it’s used is not just inefficient. It’s unethical.
We need to move beyond the myth that innovation and privacy are at odds. Responsible AI means more equitable, effective and accountable systems. It means rejecting vendor lock-in, prioritizing interoperability and demanding open standards. Because in a democracy, no single company should control the data that decides who gets help, who gets stopped or who gets left behind.
#advertising#agent#ai#ai tools#alerts#Amazon#America#Analysis#approach#artificial#Artificial Intelligence#audit#awareness#Building#CEO#challenge#change#cities#civil rights#Cloud#Community#Companies#comprehensive#crime#cyber#data#data pipeline#data privacy#data sharing#data usage
0 notes
Text
Optimizing Data Workflows with Automation, Deduplication, and RESTful APIs
In the fast-paced world of data management, businesses are constantly looking for ways to streamline workflows, reduce redundancy, and gain real-time insights. Whether you're handling customer information, sales transactions, or backend system logs, managing your data efficiently is key to staying competitive.
Data pipeline
0 notes
Text
On-Demand Data Engineer Jobs Talent in Singapore | Applify
At Applify, we’re on a mission to empower businesses with cutting-edge, data-driven solutions. We’re looking for a skilled and motivated Data Engineer Job to join our team in Singapore. You’ll work with modern data stacks, build scalable ETL pipelines, and collaborate with cross-functional teams to transform raw data into actionable intelligence.
0 notes