#find column SQL
Explore tagged Tumblr posts
Visit Tumblr Blog
Explore Tumblr blogs with no restrictions, modern design and the best experience.
Last Seen Tumblr Blogs


Fun Fact
Celebrities use Tumblr as well.
Text
Searching for a Specific Table Column Across All Databases in SQL Server
To find all tables that contain a column with a specified name in a SQL Server database, you can use the INFORMATION_SCHEMA.COLUMNS view. This view contains information about each column in the database, including the table name and the column name. Here’s a SQL query that searches for all tables containing a column named YourColumnName: SELECT TABLE_SCHEMA, TABLE_NAME FROM…
View On WordPress
#cross-database query#database schema exploration#Dynamic SQL execution#find column SQL#Results#SQL Server column search
0 notes
Text
SQL Fundamentals #1: SQL Data Definition
Last year in college , I had the opportunity to dive deep into SQL. The course was made even more exciting by an amazing instructor . Fast forward to today, and I regularly use SQL in my backend development work with PHP. Today, I felt the need to refresh my SQL knowledge a bit, and that's why I've put together three posts aimed at helping beginners grasp the fundamentals of SQL.
Understanding Relational Databases
Let's Begin with the Basics: What Is a Database?
Simply put, a database is like a digital warehouse where you store large amounts of data. When you work on projects that involve data, you need a place to keep that data organized and accessible, and that's where databases come into play.
Exploring Different Types of Databases
When it comes to databases, there are two primary types to consider: relational and non-relational.
Relational Databases: Structured Like Tables
Think of a relational database as a collection of neatly organized tables, somewhat like rows and columns in an Excel spreadsheet. Each table represents a specific type of information, and these tables are interconnected through shared attributes. It's similar to a well-organized library catalog where you can find books by author, title, or genre.
Key Points:
Tables with rows and columns.
Data is neatly structured, much like a library catalog.
You use a structured query language (SQL) to interact with it.
Ideal for handling structured data with complex relationships.
Non-Relational Databases: Flexibility in Containers
Now, imagine a non-relational database as a collection of flexible containers, more like bins or boxes. Each container holds data, but they don't have to adhere to a fixed format. It's like managing a diverse collection of items in various boxes without strict rules. This flexibility is incredibly useful when dealing with unstructured or rapidly changing data, like social media posts or sensor readings.
Key Points:
Data can be stored in diverse formats.
There's no rigid structure; adaptability is the name of the game.
Non-relational databases (often called NoSQL databases) are commonly used.
Ideal for handling unstructured or dynamic data.
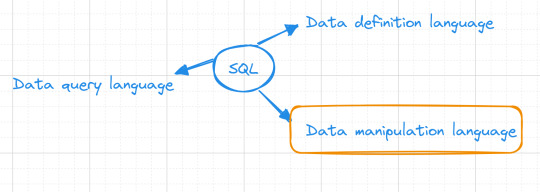
Now, Let's Dive into SQL:

SQL is a :
Data Definition language ( what todays post is all about )
Data Manipulation language
Data Query language
Task: Building and Interacting with a Bookstore Database
Setting Up the Database
Our first step in creating a bookstore database is to establish it. You can achieve this with a straightforward SQL command:
CREATE DATABASE bookstoreDB;
SQL Data Definition
As the name suggests, this step is all about defining your tables. By the end of this phase, your database and the tables within it are created and ready for action.

1 - Introducing the 'Books' Table
A bookstore is all about its collection of books, so our 'bookstoreDB' needs a place to store them. We'll call this place the 'books' table. Here's how you create it:
CREATE TABLE books ( -- Don't worry, we'll fill this in soon! );
Now, each book has its own set of unique details, including titles, authors, genres, publication years, and prices. These details will become the columns in our 'books' table, ensuring that every book can be fully described.
Now that we have the plan, let's create our 'books' table with all these attributes:
CREATE TABLE books ( title VARCHAR(40), author VARCHAR(40), genre VARCHAR(40), publishedYear DATE, price INT(10) );
With this structure in place, our bookstore database is ready to house a world of books.
2 - Making Changes to the Table
Sometimes, you might need to modify a table you've created in your database. Whether it's correcting an error during table creation, renaming the table, or adding/removing columns, these changes are made using the 'ALTER TABLE' command.
For instance, if you want to rename your 'books' table:
ALTER TABLE books RENAME TO books_table;
If you want to add a new column:
ALTER TABLE books ADD COLUMN description VARCHAR(100);
Or, if you need to delete a column:
ALTER TABLE books DROP COLUMN title;
3 - Dropping the Table
Finally, if you ever want to remove a table you've created in your database, you can do so using the 'DROP TABLE' command:
DROP TABLE books;
To keep this post concise, our next post will delve into the second step, which involves data manipulation. Once our bookstore database is up and running with its tables, we'll explore how to modify and enrich it with new information and data. Stay tuned ...
Part2
#code#codeblr#java development company#python#studyblr#progblr#programming#comp sci#web design#web developers#web development#website design#webdev#website#tech#learn to code#sql#sqlserver#sql course#data#datascience#backend
112 notes
·
View notes
Text

Wielding Big Data Using PySpark
Introduction to PySpark
PySpark is the Python API for Apache Spark, a distributed computing framework designed to process large-scale data efficiently. It enables parallel data processing across multiple nodes, making it a powerful tool for handling massive datasets.
Why Use PySpark for Big Data?
Scalability: Works across clusters to process petabytes of data.
Speed: Uses in-memory computation to enhance performance.
Flexibility: Supports various data formats and integrates with other big data tools.
Ease of Use: Provides SQL-like querying and DataFrame operations for intuitive data handling.
Setting Up PySpark
To use PySpark, you need to install it and set up a Spark session. Once initialized, Spark allows users to read, process, and analyze large datasets.
Processing Data with PySpark
PySpark can handle different types of data sources such as CSV, JSON, Parquet, and databases. Once data is loaded, users can explore it by checking the schema, summary statistics, and unique values.
Common Data Processing Tasks
Viewing and summarizing datasets.
Handling missing values by dropping or replacing them.
Removing duplicate records.
Filtering, grouping, and sorting data for meaningful insights.
Transforming Data with PySpark
Data can be transformed using SQL-like queries or DataFrame operations. Users can:
Select specific columns for analysis.
Apply conditions to filter out unwanted records.
Group data to find patterns and trends.
Add new calculated columns based on existing data.
Optimizing Performance in PySpark
When working with big data, optimizing performance is crucial. Some strategies include:
Partitioning: Distributing data across multiple partitions for parallel processing.
Caching: Storing intermediate results in memory to speed up repeated computations.
Broadcast Joins: Optimizing joins by broadcasting smaller datasets to all nodes.
Machine Learning with PySpark
PySpark includes MLlib, a machine learning library for big data. It allows users to prepare data, apply machine learning models, and generate predictions. This is useful for tasks such as regression, classification, clustering, and recommendation systems.
Running PySpark on a Cluster
PySpark can run on a single machine or be deployed on a cluster using a distributed computing system like Hadoop YARN. This enables large-scale data processing with improved efficiency.
Conclusion
PySpark provides a powerful platform for handling big data efficiently. With its distributed computing capabilities, it allows users to clean, transform, and analyze large datasets while optimizing performance for scalability.
For Free Tutorials for Programming Languages Visit-https://www.tpointtech.com/
2 notes
·
View notes
Text
Top 5 Selling Odoo Modules.
In the dynamic world of business, having the right tools can make all the difference. For Odoo users, certain modules stand out for their ability to enhance data management and operations. To optimize your Odoo implementation and leverage its full potential.
That's where Odoo ERP can be a life savior for your business. This comprehensive solution integrates various functions into one centralized platform, tailor-made for the digital economy.
Let’s drive into 5 top selling module that can revolutionize your Odoo experience:
Dashboard Ninja with AI, Odoo Power BI connector, Looker studio connector, Google sheets connector, and Odoo data model.
1. Dashboard Ninja with AI:
Using this module, Create amazing reports with the powerful and smart Odoo Dashboard ninja app for Odoo. See your business from a 360-degree angle with an interactive, and beautiful dashboard.
Some Key Features:
Real-time streaming Dashboard
Advanced data filter
Create charts from Excel and CSV file
Fluid and flexible layout
Download Dashboards items
This module gives you AI suggestions for improving your operational efficiencies.
2. Odoo Power BI Connector:
This module provides a direct connection between Odoo and Power BI Desktop, a Powerful data visualization tool.
Some Key features:
Secure token-based connection.
Proper schema and data type handling.
Fetch custom tables from Odoo.
Real-time data updates.
With Power BI, you can make informed decisions based on real-time data analysis and visualization.
3. Odoo Data Model:
The Odoo Data Model is the backbone of the entire system. It defines how your data is stored, structured, and related within the application.
Key Features:
Relations & fields: Developers can easily find relations ( one-to-many, many-to-many and many-to-one) and defining fields (columns) between data tables.
Object Relational mapping: Odoo ORM allows developers to define models (classes) that map to database tables.
The module allows you to use SQL query extensions and download data in Excel Sheets.
4. Google Sheet Connector:
This connector bridges the gap between Odoo and Google Sheets.
Some Key features:
Real-time data synchronization and transfer between Odoo and Spreadsheet.
One-time setup, No need to wrestle with API’s.
Transfer multiple tables swiftly.
Helped your team’s workflow by making Odoo data accessible in a sheet format.
5. Odoo Looker Studio Connector:
Looker studio connector by Techfinna easily integrates Odoo data with Looker, a powerful data analytics and visualization platform.
Some Key Features:
Directly integrate Odoo data to Looker Studio with just a few clicks.
The connector automatically retrieves and maps Odoo table schemas in their native data types.
Manual and scheduled data refresh.
Execute custom SQL queries for selective data fetching.
The Module helped you build detailed reports, and provide deeper business intelligence.
These Modules will improve analytics, customization, and reporting. Module setup can significantly enhance your operational efficiency. Let’s embrace these modules and take your Odoo experience to the next level.
Need Help?
I hope you find the blog helpful. Please share your feedback and suggestions.
For flawless Odoo Connectors, implementation, and services contact us at
[email protected] Or www.techneith.com
#odoo#powerbi#connector#looker#studio#google#microsoft#techfinna#ksolves#odooerp#developer#web developers#integration#odooimplementation#crm#odoointegration#odooconnector
4 notes
·
View notes
Text
Optimizing Business Operations with Advanced Machine Learning Services
Machine learning has gained popularity in recent years thanks to the adoption of the technology. On the other hand, traditional machine learning necessitates managing data pipelines, robust server maintenance, and the creation of a model for machine learning from scratch, among other technical infrastructure management tasks. Many of these processes are automated by machine learning service which enables businesses to use a platform much more quickly.
What do you understand of Machine learning?
Deep learning and neural networks applied to data are examples of machine learning, a branch of artificial intelligence focused on data-driven learning. It begins with a dataset and gains the ability to extract relevant data from it.
Machine learning technologies facilitate computer vision, speech recognition, face identification, predictive analytics, and more. They also make regression more accurate.
For what purpose is it used?
Many use cases, such as churn avoidance and support ticket categorization make use of MLaaS. The vital thing about MLaaS is it makes it possible to delegate machine learning's laborious tasks. This implies that you won't need to install software, configure servers, maintain infrastructure, and other related tasks. All you have to do is choose the column to be predicted, connect the pertinent training data, and let the software do its magic.
Natural Language Interpretation
By examining social media postings and the tone of consumer reviews, natural language processing aids businesses in better understanding their clientele. the ml services enable them to make more informed choices about selling their goods and services, including providing automated help or highlighting superior substitutes. Machine learning can categorize incoming customer inquiries into distinct groups, enabling businesses to allocate their resources and time.
Predicting
Another use of machine learning is forecasting, which allows businesses to project future occurrences based on existing data. For example, businesses that need to estimate the costs of their goods, services, or clients might utilize MLaaS for cost modelling.
Data Investigation
Investigating variables, examining correlations between variables, and displaying associations are all part of data exploration. Businesses may generate informed suggestions and contextualize vital data using machine learning.
Data Inconsistency
Another crucial component of machine learning is anomaly detection, which finds anomalous occurrences like fraud. This technology is especially helpful for businesses that lack the means or know-how to create their own systems for identifying anomalies.
Examining And Comprehending Datasets
Machine learning provides an alternative to manual dataset searching and comprehension by converting text searches into SQL queries using algorithms trained on millions of samples. Regression analysis use to determine the correlations between variables, such as those affecting sales and customer satisfaction from various product attributes or advertising channels.
Recognition Of Images
One area of machine learning that is very useful for mobile apps, security, and healthcare is image recognition. Businesses utilize recommendation engines to promote music or goods to consumers. While some companies have used picture recognition to create lucrative mobile applications.
Your understanding of AI will drastically shift. They used to believe that AI was only beyond the financial reach of large corporations. However, thanks to services anyone may now use this technology.
2 notes
·
View notes
Text
Data Analyst Interview Questions: A Comprehensive Guide
Preparing for an interview as a Data Analyst is difficult, given the broad skills needed. Technical skill, business knowledge, and problem-solving abilities are assessed by interviewers in a variety of ways. This guide will assist you in grasping the kind of questions that will be asked and how to answer them.

By mohammed hassan on Pixabay
General Data Analyst Interview Questions
These questions help interviewers assess your understanding of the role and your basic approach to data analysis.
Can you describe what a Data Analyst does? A Data Analyst collects, processes, and analyzes data to help businesses make data-driven decisions and identify trends or patterns.
What are the key responsibilities of a Data Analyst? Responsibilities include data collection, data cleaning, exploratory data analysis, reporting insights, and collaborating with stakeholders.
What tools are you most familiar with? Say tools like Excel, SQL, Python, Tableau, Power BI, and describe how you have used them in past projects.
What types of data? Describe structured, semi-structured, and unstructured data using examples such as databases, JSON files, and pictures or videos.
Technical Data Analyst Interview Questions
Technical questions evaluate your tool knowledge, techniques, and your ability to manipulate and interpret data.
What is the difference between SQL's inner join and left join? The inner join gives only the common rows between tables, whereas a left join gives all rows of the left table as well as corresponding ones of the right.
How do you deal with missing data in a dataset? Methods are either removing rows, mean/median imputation, or forward-fill/backward-fill depending on context and proportion of missing data.
Can you describe normalization and why it's significant? Normalization minimizes data redundancy and enhances data integrity by structuring data effectively between relational tables.
What are some Python libraries that are frequently used for data analysis? Libraries consist of Pandas for data manipulation, NumPy for numerical computations, Matplotlib/Seaborn for data plotting, and SciPy for scientific computing.
How would you construct a query to discover duplicate values within a table? Use a GROUP BY clause with a HAVING COUNT(*) > 1 to find duplicate records according to one or more columns.
Behavioral and Situational Data Analyst Interview Questions
These assess your soft skills, work values, and how you deal with actual situations.
Describe an instance where you managed a challenging stakeholder. Describe how you actively listened, recognized their requirements, and provided insights that supported business objectives despite issues with communication.
Tell us about a project in which you needed to analyze large datasets. Describe how you broke the dataset down into manageable pieces, what tools you used, and what you learned from the analysis.
Read More....
0 notes
Text
Big Data Analytics: Tools & Career Paths

In this digital era, data is being generated at an unimaginable speed. Social media interactions, online transactions, sensor readings, scientific inquiries-all contribute to an extremely high volume, velocity, and variety of information, synonymously referred to as Big Data. Impossible is a term that does not exist; then, how can we say that we have immense data that remains useless? It is where Big Data Analytics transforms huge volumes of unstructured and semi-structured data into actionable insights that spur decision-making processes, innovation, and growth.
It is roughly implied that Big Data Analytics should remain within the triangle of skills as a widely considered niche; in contrast, nowadays, it amounts to a must-have capability for any working professional across tech and business landscapes, leading to numerous career opportunities.
What Exactly Is Big Data Analytics?
This is the process of examining huge, varied data sets to uncover hidden patterns, customer preferences, market trends, and other useful information. The aim is to enable organizations to make better business decisions. It is different from regular data processing because it uses special tools and techniques that Big Data requires to confront the three Vs:
Volume: Masses of data.
Velocity: Data at high speed of generation and processing.
Variety: From diverse sources and in varying formats (!structured, semi-structured, unstructured).
Key Tools in Big Data Analytics
Having the skills to work with the right tools becomes imperative in mastering Big Data. Here are some of the most famous ones:
Hadoop Ecosystem: The core layer is an open-source framework for storing and processing large datasets across clusters of computers. Key components include:
HDFS (Hadoop Distributed File System): For storing data.
MapReduce: For processing data.
YARN: For resource-management purposes.
Hive, Pig, Sqoop: Higher-level data warehousing and transfer.
Apache Spark: Quite powerful and flexible open-source analytics engine for big data processing. It is much faster than MapReduce, especially for iterative algorithms, hence its popularity in real-time analytics, machine learning, and stream processing. Languages: Scala, Python (PySpark), Java, R.
NoSQL Databases: In contrast to traditional relational databases, NoSQL (Not only SQL) databases are structured to maintain unstructured and semic-structured data at scale. Examples include:
MongoDB: Document-oriented (e.g., for JSON-like data).
Cassandra: Column-oriented (e.g., for high-volume writes).
Neo4j: Graph DB (e.g., for data heavy with relationships).
Data Warehousing & ETL Tools: Tools for extracting, transforming, and loading (ETL) data from various sources into a data warehouse for analysis. Examples: Talend, Informatica. Cloud-based solutions such as AWS Redshift, Google BigQuery, and Azure Synapse Analytics are also greatly used.
Data Visualization Tools: Essential for presenting complex Big Data insights in an understandable and actionable format. Tools like Tableau, Power BI, and Qlik Sense are widely used for creating dashboards and reports.
Programming Languages: Python and R are the dominant languages for data manipulation, statistical analysis, and integrating with Big Data tools. Python's extensive libraries (Pandas, NumPy, Scikit-learn) make it particularly versatile.
Promising Career Paths in Big Data Analytics
As Big Data professionals in India was fast evolving, there were diverse professional roles that were offered with handsome perks:
Big Data Engineer: Designs, builds, and maintains the large-scale data processing systems and infrastructure.
Big Data Analyst: Work on big datasets, finding trends, patterns, and insights that big decisions can be made on.
Data Scientist: Utilize statistics, programming, and domain expertise to create predictive models and glean deep insights from data.
Machine Learning Engineer: Concentrates on the deployment and development of machine learning models on Big Data platforms.
Data Architect: Designs the entire data environment and strategy of an organization.
Launch Your Big Data Analytics Career
Some more Specialized Big Data Analytics course should be taken if you feel very much attracted to data and what it can do. Hence, many computer training institutes in Ahmedabad offer comprehensive courses covering these tools and concepts of Big Data Analytics, usually as a part of Data Science with Python or special training in AI and Machine Learning. Try to find those courses that offer real-time experience and projects along with industry mentoring, so as to help you compete for these much-demanded jobs.
When you are thoroughly trained in the Big Data Analytics tools and concepts, you can manipulate information for innovation and can be highly paid in the working future.
At TCCI, we don't just teach computers — we build careers. Join us and take the first step toward a brighter future.
Location: Bopal & Iskcon-Ambli in Ahmedabad, Gujarat
Call now on +91 9825618292
Visit Our Website: http://tccicomputercoaching.com/
0 notes
Text
Top 10 Power BI terms Every New User should know

If you are just getting started with Power BI, understanding the key terms will help you navigate the platform more effectively. Here are the top 10 Power BI terms every new user should know:
1) Dataset
A dataset in Power BI refers to information that has been imported from Excel, SQL or cloud services. Reports and dashboards can only be created by first having the necessary datasets. They save everything, including the raw data and the designs, relationships, measures and calculated columns we’ve built in Power BI. Creating, handling and updating datasets are basic skills needed because data push in analytics, give instant business insights and bind different data sources.
2) Report
A Power BI report is made up of charts, graphs and tables, all built from data in a dataset. With reports, we have an interactive tool to explore your notes, click deeper and review additional information. Every report page is designed to communicate a certain story or point out a specific part of your data. To ensure your organization makes good decisions, it helps to know how to create and customize reports.
3) Dashboard
The dashboard in Power BI are a grouping of visual components and metrics. It gives a general and joined-up look at important observations, unlike reports that just provide a detailed view of each report or group of data. They offer business leaders an easy way to monitor and check business KPIs at any time. Managers and executives benefit from dashboards, since they can get the needed performance updates without going through many detailed reports.
4) Visualization
A visualization in Power BI presents the data using images. It is sometimes known as a visual or chart. Bar charts, pie charts, line graphs, maps, tables and similar options are part of visualizations. They change difficult-to-read information into clear graphics that can show trends, unusual values and details quickly. With Power BI, users have many ways to change how the visualizations look for their organization. To make exciting reports and dashboards, we should learn to use visualizations well.
5) Measure
In Power BI, measures are calculations designed to study data, and we can build them using DAX (Data Analysis Expressions). Unlike regular columns, measures can refresh their values at any time based on reports or what a user selects. It is easy to find the total, average, ratio, percentage and complex groups with measures. Working on efficient measures helps we turn your data into useful insights and boosts your analytical skills within Power BI.
6) Calculated Column
To create a calculated column, we add a DAX formula to some input fields in your data. We can add new information to your data using calculated columns such as grouping, marking special items or defining values for ourselves. Unlike measures, these columns are evaluated when the data refreshes rather than at query time. Having calculated columns in our data model ensures that your reports become richer and better fit your company’s specific needs.
7) Filter
We can narrow the data in your charts and graphs using filters in Power BI. They can be used at the report, page or graphical levels. Using filters, we can narrow down your analysis to a particular time, type or area of the business. Additional options available include slicers, filters for dates and filters for moving down to the next page. Adding the right filters makes your reports more relevant, so stakeholders can easily spot the main insights.
8) Data Model
Any Power BI project depends on a solid data model as its core structure. It shows the connections between data tables by using relationships, Primary Keys and Foreign Keys. In addition, the data model has calculated columns, measures and hierarchies to organize your data for use properly.
With a proper data model in place, our analysis results are correct, queries are fast, and your visualizations are easy to interact with. To create stable and scalable Power BI projects, one must learn about modelling.
9) DAX is Data Analysis Expressions
Power BI provides DAX as a language for creating your calculations in measures, calculated columns and tables. DAX has functions, operators and values that make it possible to create advanced rules for a business.
When we master DAX, we can use analytics for many purposes, including complex grouping, analyzing time and transforming the data. Knowing the basics of DAX will help new Power BI users make the most of the product’s reporting capabilities.
10) Power Query
The purpose of Power Query is to prepare your data for use in Power BI. The platform enables users to bring data from various locations, clean it, format it and transform it before it enters the data model. An easy-to-use interface and the M language in Power Query make it simple to merge, filter duplicates, organize columns and fill out repetitive tasks on the table. By using Power Query, it becomes smoother to ETL your data and it is always accurate and easy to analyze.
Conclusion
Understanding the core terminology of Power BI is essential for anyone new to the platform. These top 10 terms, like datasets, reports, dashboards, DAX, and visualizations—form the building blocks of how Power BI works and how data is transformed into meaningful insights. I suggest you learn Power BI from the Tpoint Tech website. It provides a Power BI tutorial, interview questions that helps you to learn Power BI features and tools in easier way.
0 notes
Text
Smart Adaptive Filtering Improves AlloyDB AI Vector Search

A detailed look at AlloyDB's vector search improvements
Intelligent Adaptive Filtering Improves Vector Search Performance in AlloyDB AI
Google Cloud Next 2025: Google Cloud announced new ScaNN index upgrades for AlloyDB AI to improve structured and unstructured data search quality and performance. The Google Cloud Next 2025 advancements meet the increased demand for developers to create generative AI apps and AI agents that explore many data kinds.
Modern relational databases like AlloyDB for PostgreSQL now manage unstructured data with vector search. Combining vector searches with SQL filters on structured data requires careful optimisation for high performance and quality.
Filtered Vector Search issues
Filtered vector search allows specified criteria to refine vector similarity searches. An online store managing a product catalogue with over 100,000 items in an AlloyDB table may need to search for certain items using structured information (like colour or size) and unstructured language descriptors (like “puffer jacket”). Standard queries look like this:
Selected items: * WHERE text_embedding <-> Color=maroon, text-embedding-005, puff jacket, google_ml.embedding LIMIT 100
In the second section, the vector-indexed text_embedding column is vector searched, while the B-tree-indexed colour column is treated to the structured filter color='maroon'.
This query's efficiency depends on the database's vector search and SQL filter sequence. The AlloyDB query planner optimises this ordering based on workload. The filter's selectivity heavily influences this decision. Selectivity measures how often a criterion appears in the dataset.
Optimising with Pre-, Post-, and Inline Filters
AlloyDB's query planner intelligently chooses techniques using filter selectivity:
High Selectivity: The planner often employs a pre-filter when a filter is exceedingly selective, such as 0.2% of items being "maroon." Only a small part of data meets the criterion. After applying the filter (e.g., WHERE color='maroon'), the computationally intensive vector search begins. Using a B-tree index, this shrinks the candidate set from 100,000 to 200 products. Only this smaller set is vector searched (also known as a K-Nearest Neighbours or KNN search), assuring 100% recall in the filtered results.
Low Selectivity: A pre-filter that doesn't narrow the search field (e.g., 90% of products are “blue”) is unsuccessful. Planners use post-filter methods in these cases. First, an Approximate Nearest Neighbours (ANN) vector search using indexes like ScaNN quickly identifies the top 100 candidates based on vector similarity. After retrieving candidates, the filter condition (e.g., WHERE color='blue') is applied. This strategy works effectively for filters with low selectivity because many initial candidates fit the criteria.
Medium Selectivity: AlloyDB provides inline filtering (in-filtering) for filters with medium selectivity (0.5–10%, like “purple”). This method uses vector search and filter criteria. A bitmap from a B-tree index helps AlloyDB find approximate neighbours and candidates that match the filter in one run. Pre-filtering narrows the search field, but post-filtering on a highly selective filter does not produce too few results.
Learn at query time with adaptive filtering
Complex real-world workloads and filter selectivities can change over time, causing the query planner to make inappropriate selectivity decisions based on outdated facts. Poor execution tactics and results may result.
AlloyDB ScaNN solves this using adaptive filtration. This latest update lets AlloyDB use real-time information to determine filter selectivity. This real-time data allows the database to change its execution schedule for better filter and vector search ranking. Adaptive filtering reduces planner miscalculations.
Get Started
These innovations, driven by an intelligent database engine, aim to provide outstanding search results as data evolves.
In preview, adaptive filtering is available. With AlloyDB's ScaNN index, vector search may begin immediately. New Google Cloud users get $300 in free credits and a 30-day AlloyDB trial.
#AdaptiveFiltering#AlloyDBAI#AlloyDBScaNNindex#vectorsearch#AlloyDBAIVectorSearch#AlloyDBqueryplanner#technology#technews#technologynews#news#govindhtech
0 notes
Text
How to Crack Interviews After a Data Analytics Course in Delhi

Data Analytics is one of the most in-demand career paths today. With the rise of digital businesses, data is everywhere. Companies need skilled professionals to analyze that data and make smart decisions. If you’ve just completed a Data Analytics Course in Delhi from Uncodemy, congratulations! You’re now ready to take the next big step—cracking job interviews.
In this article, we will guide you through everything you need to know to prepare, practice, and confidently face data analytics interviews. Whether you're a fresher or someone switching careers, this guide is for you.
1. Understand What Interviewers Are Looking For
Before you sit for an interview, it’s important to know what the employer wants. In a data analytics role, most companies look for candidates who have:
Good problem-solving skills
Strong knowledge of Excel, SQL, Python, or R
Understanding of data visualization tools like Power BI or Tableau
Clear thinking and logical reasoning
Communication skills to explain data findings in simple terms
Employers want someone who can take raw data and turn it into useful insights. That means they need you to not just be good with tools but also think like a business person.
2. Build a Strong Resume
Your resume is the first thing an interviewer will see. A good resume increases your chances of getting shortlisted. Here’s how to make your resume stand out:
Keep it simple and clear:
Use bullet points
Highlight your skills, tools you know, and projects you’ve done
Focus on your data analytics skills:
Mention your knowledge in Excel, SQL, Python, Tableau, etc.
Add details about real projects or case studies you completed during the course
Include a summary at the top:
Example: “Certified Data Analytics Professional from Uncodemy with hands-on experience in SQL, Excel, and Tableau. Strong analytical skills with a passion for solving business problems using data.”
3. Practice Common Data Analytics Interview Questions
Here are some common questions you might be asked:
a. Technical Questions:
What is data cleaning?
How would you handle missing data?
What is the difference between clustered and non-clustered indexes in SQL?
How do you join two tables in SQL?
What is the difference between inner join and left join?
b. Scenario-Based Questions:
How would you help a sales team improve performance using data?
Imagine your dataset has 10% missing values. What will you do?
You found outliers in the data—what steps would you take?
c. Tools-Based Questions:
Show how to use a pivot table in Excel.
How would you create a dashboard in Tableau?
Write a Python code to find the average value of a column.
d. HR Questions:
Tell me about yourself.
Why did you choose data analytics?
Where do you see yourself in 5 years?
Practice these questions with a friend or in front of a mirror. Be confident, calm, and clear with your answers.
4. Work on Real-Time Projects
Employers love candidates who have done practical work. At Uncodemy, you may have worked on some real-time projects during your course. Be ready to talk about them in detail:
What was the project about?
What tools did you use?
What challenges did you face, and how did you solve them?
What insights did you discover?
Make sure you can explain your project like you’re telling a simple story. Use plain words—avoid too much technical jargon unless the interviewer asks.
5. Improve Your Communication Skills
Data analytics is not just about coding. You need to explain your findings in simple terms to people who don’t understand data—like managers, marketers, or sales teams.
Practice explaining:
What a graph shows
What a number means
Why a pattern in data is important
You can practice by explaining your projects to friends or family members who don’t come from a tech background.
6. Create a Portfolio
A portfolio is a great way to show your skills. It’s like an online resume that includes:
A short bio about you
Tools and skills you know
Links to your projects
Screenshots of dashboards or charts you’ve made
GitHub link (if you have code)
You can create a free portfolio using websites like GitHub, WordPress, or even a simple PDF.
7. Learn About the Company
Before your interview, always research the company. Visit their website, read about their products, services, and recent news. Try to understand what kind of data they might use.
If it's an e-commerce company, think about sales, customer data, and inventory. If it’s a finance company, think about transactions, risk analysis, and customer behavior.
Knowing about the company helps you give better answers and shows that you’re serious about the job.
8. Ask Smart Questions
At the end of most interviews, the interviewer will ask, “Do you have any questions for us?”
Always say yes!
Here are some good questions you can ask:
What kind of data projects does the team work on?
What tools do you use most often?
What are the biggest challenges your data team is facing?
How do you measure success in this role?
These questions show that you are curious, thoughtful, and serious about the role.
9. Stay Updated with Trends
Data analytics is a fast-changing field. New tools, techniques, and trends come up regularly.
Follow blogs, LinkedIn pages, YouTube channels, and news related to data analytics. Stay updated on topics like:
Artificial Intelligence (AI) and Machine Learning (ML)
Big Data
Data privacy laws
Business Intelligence trends
Being aware of current trends shows that you're passionate and committed to learning.
10. Join Communities and Networking Events
Sometimes, jobs don’t come from job portals—they come from people you know.
Join LinkedIn groups, attend webinars, career fairs, and workshops in Delhi. Connect with other data analysts. You might get job referrals, interview tips, or mentorship.
Uncodemy often conducts webinars and alumni meetups—don’t miss those events!
11. Practice Mock Interviews
Doing a few mock interviews will make a big difference. Ask a friend, mentor, or trainer from Uncodemy to help you with mock sessions.
You can also record yourself and check:
Are you speaking clearly?
Are you too fast or too slow?
Do you use filler words like “umm” or “like” too much?
The more you practice, the better you get.
12. Keep Learning
Even after finishing your course, continue to build your skills. Learn new tools, do mini-projects, and take free online courses on platforms like:
Coursera
edX
Kaggle
YouTube tutorials
Your learning journey doesn’t stop with a course. Keep growing.
Final Words from Uncodemy
Cracking a data analytics interview is not just about technical skills—it’s about being confident, clear, and curious. At Uncodemy, we aim to not just teach you the tools but also prepare you for the real world.
If you’ve taken our Data Analytics course in delhi, remember:
Practice interview questions
Build your resume and portfolio
Work on projects
Stay updated and keep learning
Don’t worry if you don’t get selected in your first few interviews. Every interview is a learning experience. Stay motivated, stay focused, and success will follow.
Good luck! Your dream data analytics job is waiting for you.
0 notes
Text
SQL Fundamentals #2: SQL Data Manipulation
In our previous database exploration journey, SQL Fundamentals #1: SQL Data Definition, we set the stage by introducing the "books" table nestled within our bookstore database. Currently, our table is empty, Looking like :
books
| title | author | genre | publishedYear | price |
Data manipulation
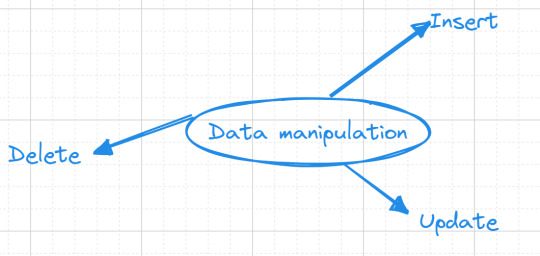
Now, let's embark on database interaction—data manipulation. This is where the magic happens, where our "books" table comes to life, and we finish our mission of data storage.
Inserting Data
Our initial task revolves around adding a collection of books into our "books" table. we want to add the book "The Great Gatsby" to our collection, authored F. Scott Fitzgerald. Here's how we express this in SQL:
INSERT INTO books(title, author, genre, publishedYear, price) VALUES('The Great Gatsby', 'F. Scott Fitzgerald', 'Classic', 1925, 10.99);
Alternatively, you can use a shorter form for inserting values, but be cautious as it relies on the order of columns in your table:
INSERT INTO books VALUES('The Great Gatsby', 'F. Scott Fitzgerald', 'Classic', 1925, 10.99);
Updating data
As time goes on, you might find the need to modify existing data in our "books" table. To accomplish this, we use the UPDATE command.For example :
UPDATE books SET price = 12.99 WHERE title = 'The Great Gatsby';
This SQL statement will locate the row with the title "The Great Gatsby" and modify its price to $12.99.
We'll discuss the where clause in (SQL fundamentals #3)
Deleting data
Sometimes, data becomes obsolete or irrelevant, and it's essential to remove it from our table. The DELETE FROM command allows us to delete entire rows from our table.For example :
DELETE FROM books WHERE title = 'Moby-Dick';
This SQL statement will find the row with the title "Moby-Dick" and remove it entirely from your "books" table.
To maintain a reader-friendly and approachable tone, I'll save the discussion on the third part of SQL, which focuses on data querying, for the upcoming post. Stay tuned ...
#studyblr#code#codeblr#javascript#java development company#study#progblr#programming#studying#comp sci#web design#web developers#web development#website design#webdev#website#tech#sql#sql course#mysql#datascience#data#backend
45 notes
·
View notes
Text
A Beginner’s Guide to NVH Testing in India’s Automotive Industry

In today’s fast-paced world of data analytics, staying relevant means knowing how to turn raw data into smart decisions—and fast. Sure, tools like Python, SQL, and Power BI are gaining popularity, but if there’s one tool that still stands strong in 2025, it’s Microsoft Excel.
Whether you’re just starting out or you’ve been crunching numbers for years, Excel for data analyst roles remains one of the most practical and in-demand skills. It strikes that perfect balance between simplicity and capability, making it the go-to for countless data tasks.
In this post, we’ll look at why Excel isn’t going anywhere, the most valuable Excel job skills right now, and how you can sharpen your expertise to keep up with the latest demands in data analytics.
The Modern-Day Data Analyst: More Than Just a Number Cruncher
Back in the day, data analysts were mostly behind the scenes—collecting numbers, making charts, and maybe sending the occasional report. Fast forward to 2025, and their role is far more central. Today’s analysts are storytellers, business advisors, and problem solvers.
Here’s what a typical day might include:
Pulling raw data from different platforms (think CRMs, ERPs, databases, web analytics tools)
Cleaning and organizing that data so it actually makes sense
Analyzing trends to help forecast what’s coming next
Creating reports and dashboards that communicate findings clearly
Presenting insights to decision-makers in a way that drives action
And you guessed it—Excel shows up in almost every one of these steps.
Why Excel Still Matters (a Lot)
Some might argue that Excel is “old-school,” but here’s the reality: it’s still everywhere. And for good reason.
1. It’s Familiar to Everyone
From finance teams to marketing departments, most professionals have at least a basic grasp of Excel. That makes collaboration easy—no need to explain a tool everyone’s already using.
2. Quick Results, No Coding Required
Need to filter a dataset or run a few calculations? You can do it in Excel in minutes. It’s great for ad-hoc analysis where speed matters and there’s no time to build complex code.
3. Plays Nice with Other Tools
Excel isn’t an island. It connects smoothly with SQL databases, Google Analytics, Power BI, and even Python. Power Query is especially useful when pulling in and reshaping data from different sources.
4. It’s on Every Work Computer
You don’t need to install anything or get IT involved. Excel is ready to go on pretty much every company laptop, which makes it incredibly convenient.
Top Excel Skills Every Data Analyst Needs in 2025
To really stand out, you’ll want to move past the basics. Employers today expect you to do more than just sum a column or build a pie chart. Here’s where to focus your energy:
1. Data Cleaning and Transformation
Use functions like CLEAN(), TRIM(), and Text to Columns to fix messy data.
Power Query is a game-changer—it lets you clean, merge, and reshape large datasets without writing a line of code.
2. Advanced Formulas
Learn how to use INDEX, MATCH, XLOOKUP, IFERROR, and dynamic arrays. These help you build smarter, more flexible spreadsheets.
Nesting formulas (formulas within formulas) is super helpful for building logic into your models.
3. PivotTables and PivotCharts
Still one of the fastest ways to analyze large data sets.
Great for grouping, summarizing, and drilling into data—all without writing any SQL.
4. Power Query and Power Pivot
These tools turn Excel into a mini-BI platform.
You can pull in data from multiple tables, define relationships, and use DAX for more advanced calculations.
5. Interactive Dashboards
Combine charts, slicers, and conditional formatting to build dashboards that update as data changes.
Form controls (like drop-downs or sliders) add a professional touch.
6. Automation with Macros and VBA
Automate tasks like data formatting, report generation, and file creation.
Even basic VBA scripts can save hours each week on repetitive tasks.
Real-World Excel Use Cases That Still Matter
Let’s get practical. Here’s how Excel is still making an impact across industries:
Sales & Marketing: Track campaign performance, customer engagement, and conversion rates—all in a single dashboard.
Finance: Build cash flow models, scenario forecasts, and budget reports that help CFOs make data-driven calls.
Healthcare: Monitor key performance indicators like patient wait times or readmission rates.
Logistics: Analyze delivery times, shipping costs, and supplier performance to streamline operations.
These aren’t theoretical use cases—they’re actual day-to-day tasks being done in Excel right now.
Excel vs. Other Tools
Let’s be real: no single tool does it all. Excel fits into a broader ecosystem of data tools. Here’s a quick breakdown:TaskBest ToolHow Excel ContributesQuick AnalysisExcelFast and easy to useDashboardsPower BI / TableauExcel dashboards are perfect for internal or lightweight reportsData CleaningSQL / Power QueryExcel connects and transforms with Power QueryBig DataPython / RUse Excel for summary views and visualizations of Python output
Excel’s strength lies in how easily it fits into your workflow—even when you’re working with more advanced tools.
How to Get Better at Excel in 2025
If you’re serious about leveling up, here’s how to grow your skills:
1. Take a Course That Focuses on Analytics
Pick one that emphasizes real business problems and gives you projects to work on. Case studies are gold.
2. Practice on Real Data
Websites like Kaggle, data.gov, or even your company’s historical data (with permission, of course) are great places to start.
3. Learn Keyboard Shortcuts
You’ll work faster and feel more confident. Start with common ones like Ctrl + Shift + L for filters or Alt + = for autosum.
4. Dive into Power Query and Power Pivot
Once you get the hang of them, you’ll wonder how you ever worked without them.
5. Build Mini Projects
Create dashboards or models that solve specific business problems—like tracking customer churn or sales performance. These can become portfolio pieces for your next job interview.
Conclusion
Excel isn’t going anywhere. It’s deeply woven into how businesses run, and in 2025, it’s still one of the best tools in a data analyst’s toolkit. It might not be as flashy as Python or as powerful as Tableau, but it gets the job done—and done well.
If you’re aiming to future-proof your career, investing in advanced Excel job skills is a smart move. From dashboards to data modeling, the possibilities are endless. And when paired with other tools, Excel helps you deliver even more value to your team.
So keep practicing, keep building, and remember—being great at Excel can set you apart in the data world.
FAQs
Is Excel still worth learning for data analysis in 2025?Yes! Excel remains one of the top skills hiring managers look for in data analyst roles. It’s everywhere—from startups to large enterprises.
What are the most useful Excel features for analysts? Advanced formulas, PivotTables, Power Query, Power Pivot, and dashboard design are the big ones. Knowing VBA is a bonus.
Can Excel handle big datasets?To an extent. While Excel has limits, features like Power Query and Power Pivot help it manage more data than it could in the past. For really massive data, combine it with tools like SQL or Power BI.
Should I learn Excel or Python?Both. Excel is great for quick analysis and reporting. Python is better for automation, data science, and machine learning. Together, they’re a powerful combo.
How can I show off my Excel skills to employers? Create dashboards or reports based on real data and include them in a portfolio. Show how you used Excel to solve actual business problems on your resume.
0 notes
Text
Power Apps: Latest Features and Updates 2025
Power Apps: Latest Features and Updates 2025
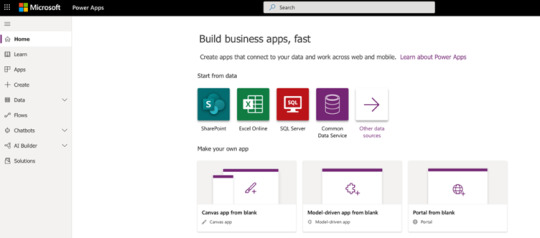
In today’s rapidly evolving digital landscape, organizations are constantly seeking agile solutions to streamline operations and enhance productivity. Power Apps, Microsoft’s powerful low-code platform, empowers users to build custom applications with minimal coding effort. From automating tasks to integrating with diverse data sources, Power Apps enables both technical and non-technical users to innovate and deliver impactful business solutions.
With each release wave, Microsoft introduces new features and enhancements to help users create smarter, faster, and more scalable applications. This blog highlights the most exciting new and planned features for Power Apps, scheduled for release between April and September 2025.
For businesses looking to stay ahead of the curve—especially those exploring affordable Power Apps solutions in Noida—these updates offer valuable insights into what’s coming next in the Power Platform ecosystem.
It’s important to note that Microsoft’s release timelines are flexible—features listed in this blog may evolve, and some functionalities may be released later than expected. For the latest updates and rollout schedules, Microsoft’s official release plan should be consulted.
2. Building Modern Apps

Feature
Enabled for
Public preview
Early access*
General availability
Select columns downloaded on mobile devices
Admins, makers, marketers, or analysts, automatically
-
-
Aug 2025
Use Entra auth for external Tenants in Power Apps
Users, automatically
-
-
Apr 2025
Use the SQL Decimal Type in Power Apps
Users, automatically
-
-
May 2025
Re-edit data sources with stored procedures
Users, automatically
-
-
Apr 2025
In today’s mobile-first world, businesses demand applications that are not only powerful but also responsive and capable of functioning offline. Power Apps continues to evolve by introducing features that help developers and businesses build modern, efficient, and user-friendly applications across devices.
a. Responsive and Offline-Capable Apps
Modern apps need to adapt seamlessly to various screen sizes, devices, and connectivity scenarios. With this in mind, Microsoft is rolling out a set of features aimed at improving mobile usability, boosting app performance, and providing greater design flexibility. These enhancements are especially beneficial for organizations seeking Hire Power Apps developer India that cater to on-the-go business needs.
🔑 Key Features:
Select Columns Downloaded on Mobile Devices (General Availability: August 2025) → This feature improves mobile performance by allowing apps to download only the necessary data columns. It reduces data load and speeds up access on mobile devices, making apps more efficient in low-bandwidth environments.
Use Entra Auth for External Tenants (GA: April 2025) → Now, users from external organizations can securely access apps using Microsoft Entra ID. This improves collaboration and extends app usability beyond your internal team without compromising on security.
SQL Decimal Type Support (GA: May 2025) → With the addition of support for SQL’s decimal data type, Power Apps now allows more accurate calculations and data entry, especially important for financial and data-intensive applications.
Re-edit Data Sources with Stored Procedures (GA: April 2025) → This feature brings greater flexibility to developers by enabling them to reconfigure or modify data sources that use stored procedures, making app updates easier and more dynamic.
These updates mark a significant step forward in empowering developers to build high-performance, cross-platform apps that are tailored to the specific needs of modern businesses.
3. Copilot for Power Apps Makers and Users
Feature
Enabled for
Public preview
Early access*
General availability
Find records and filter views using natural language
Users by admins, makers, or analysts

-
Apr 2025
Fill forms faster with smart paste
Users by admins, makers, or analysts
-
Apr 2025
Copilot helps you plan out solutions to business problems
Admins, makers, marketers, or analysts, automatically
-
May 2025
Enhanced experience for form filling with Copilot
Users by admins, makers, or analysts
Feb 2, 2025
-
Apr 2025
a. AI-Enhanced App Development
Artificial Intelligence is transforming the way applications are built and used, and Power Apps is leading the charge with its growing suite of Copilot features. Designed to boost productivity and simplify app creation, Copilot enables makers and end-users to interact with apps more intuitively—using natural language and smart automation.
Whether you're a developer building solutions or an end-user entering data, AI is making the experience smarter, faster, and more efficient. These advancements are particularly useful for businesses looking for Top Power Apps consultants in Delhi NCR, as they reduce development time and enhance user engagement with minimal effort.
🔑 Key Features:
Find Records & Filter Views Using Natural Language (General Availability: April 2025) → Users can now simply type what they’re looking for—like "show all orders from last month"—and Power Apps will automatically apply the correct filters. No complex queries required.
Smart Paste for Faster Form Filling (GA: April 2025) → This feature intelligently pastes and maps copied data into the right fields, saving time and reducing manual entry errors—perfect for repetitive form tasks.
Copilot Solution Planner (GA: May 2025) → App makers can describe a business problem in natural language, and Copilot will suggest logical components, data structures, and flows to help kickstart the app-building process.
Enhanced Form Filling with Copilot (GA: April 2025) → Copilot now offers an improved, guided experience when filling out complex forms, helping users complete them more accurately and quickly.
These AI-powered features aren't just enhancements—they're game-changers for app usability and productivity. Copilot brings the vision of intelligent, self-building applications one step closer to reality.
4. Enable Enterprise Scale
Feature
Enabled for
Public preview
Early access*
General availability
Enhanced testing for Power Apps
Users by admins, makers, or analysts
Mar 2025
-
May 2025
Be aware of authentication change in RSAT
Users, automatically
-
Mar 2025
May 2025
Manage your source code for canvas apps
Admins, makers, marketers, or analysts, automatically
May 2025
-
Jun 2025
a. Features for Building Large, Complex Apps
As businesses grow, so do their application needs. Power Apps is not only about building small, isolated applications—it’s also about empowering organizations to scale their solutions enterprise-wide. For larger companies with more complex requirements, these upcoming features will enable the creation of robust, scalable apps that meet both current and future needs.
Power Apps’ new features focus on streamlining the development process, enhancing testing capabilities, and providing the necessary tools for managing and maintaining enterprise-grade apps. These updates are critical for businesses seeking Power Apps service providers in Noida that are capable of supporting large teams and complex workflows.
🔑 Key Features:
Enhanced Testing for Power Apps (General Availability: May 2025) → Microsoft is introducing improved testing tools that allow for more thorough testing and validation of apps before they go live. This will help ensure higher-quality releases with fewer bugs and better performance across various environments.
Authentication Change Awareness (RSAT) (GA: May 2025) → With this update, regression testing automation tool users will be alerted to changes in authentication protocols. This ensures that apps built with Power Apps continue to operate smoothly despite changes in authentication settings, preventing potential disruptions in critical business workflows.
Source Code Management for Canvas Apps (GA: June 2025) → Power Apps is introducing source code management for canvas apps, allowing developers to implement version control and collaborate more efficiently on app development. This feature is essential for teams working on large-scale projects, as it helps track changes, manage app versions, and ensure consistency across teams.
These updates bring Power Apps closer to becoming a robust solution for enterprise-level applications, providing the tools needed to manage large projects, improve testing processes, and collaborate effectively across teams.
5. Early Access and Availability Notes
Understanding Release Stages: Public Preview, Early Access, and General Availability
Microsoft Power Apps follows a structured release process that allows users to explore new features at different stages of development. Understanding these stages can help businesses make informed decisions about when to adopt new features and how to integrate them into their workflows.
Public Preview: Features in Public Preview are accessible to a wide audience for testing and feedback purposes. While they are generally stable, these features may still undergo changes based on user feedback and further testing. Businesses can start experimenting with these features but should be cautious about using them in production environments.
Early Access: Early Access allows select users to test new features before they are made generally available. This stage provides an opportunity for feedback and testing in real-world environments, though some features might still be refined. Early Access features are often available on a limited basis to specific users, typically developers or businesses that want to stay ahead of the curve.
General Availability (GA): Once a feature reaches General Availability, it is considered fully stable and ready for widespread use. These features are fully supported and available to all Power Apps users, ensuring that businesses can confidently integrate them into their enterprise solutions.
Early Access Starting February 3, 2025
Starting February 3, 2025, Microsoft will offer the option for users to opt into Early Access for several upcoming features. This provides a unique opportunity for businesses to test out features in their development stages and provide valuable feedback. However, users should be aware that features in Early Access may still evolve as Microsoft collects insights from the community.
Explore Microsoft’s Power Platform Release Plan
To stay updated on the latest developments and get an in-depth view of upcoming features, businesses should regularly consult Microsoft’s Power Platform release plan. This resource offers detailed information on what’s coming, timelines, and access levels, ensuring you never miss out on crucial updates that can enhance your Power Apps experience.
6. Conclusion
As we’ve explored in this blog, Power Apps is continuously evolving to meet the growing demands of businesses, enabling them to build smarter, faster, and more scalable applications. The upcoming features set for release between April and September 2025 are designed to enhance the user experience, streamline development processes, and empower businesses to scale their solutions more effectively.
From AI-driven Copilot features that boost productivity and streamline app creation, to enterprise-scale tools that improve testing and collaboration, these updates will significantly enhance both the functionality and usability of Power Apps. Whether you're building responsive and offline-capable apps, or looking to expand your business’s app ecosystem across multiple teams, Power Apps continues to deliver powerful solutions that drive efficiency and innovation.
These updates aren’t just about new features—they’re about unlocking new possibilities for businesses to enhance productivity, improve collaboration, and scale their operations in a way that meets today’s fast-paced business environment.
We encourage businesses to explore the Public Preview and Early Access features available through Microsoft’s Power Platform release plan. Experimenting with these new capabilities will give you a head start in adopting them, and it’s a great way to provide feedback that can help shape future releases.
If you are looking to implement these features or need expert guidance, consider hiring a Power Apps developer in India. A skilled developer can help you leverage these updates to create tailored solutions that meet your business’s unique needs.
0 notes
Text
Tips for Understanding Computer Databases for Homework Assignments

In today’s digital world, databases play a crucial role in managing and organizing vast amounts of information. Whether you're a student learning database concepts or working on complex assignments, understanding computer databases can be challenging. This blog will guide you through essential tips for mastering computer databases and help you complete your homework efficiently. If you're looking for computer database assistance for homework, All Assignment Experts is here to provide expert support.
What is a Computer Database?
A computer database is a structured collection of data that allows easy access, management, and updating. It is managed using a Database Management System (DBMS), which facilitates storage, retrieval, and manipulation of data. Popular database systems include MySQL, PostgreSQL, MongoDB, and Microsoft SQL Server.
Why is Understanding Databases Important for Students?
Databases are widely used in industries like banking, healthcare, and e-commerce. Students pursuing computer science, information technology, or data science must grasp database concepts to build a strong foundation for future careers. Database knowledge is essential for managing large data sets, developing applications, and performing data analysis.
Tips for Understanding Computer Databases for Homework Assignments
1. Master the Basics First
Before diving into complex queries, ensure you understand basic database concepts like:
Tables and Records: Databases store data in tables, which contain rows (records) and columns (fields).
Primary and Foreign Keys: Primary keys uniquely identify each record, while foreign keys establish relationships between tables.
Normalization: A technique to eliminate redundancy and improve database efficiency.
2. Learn SQL (Structured Query Language)
SQL is the standard language for managing databases. Some essential SQL commands you should learn include:
SELECT – Retrieve data from a database.
INSERT – Add new records to a table.
UPDATE – Modify existing records.
DELETE – Remove records from a table.
JOIN – Combine data from multiple tables.
Using online SQL playgrounds like SQL Fiddle or W3Schools can help you practice these commands effectively.
3. Use Online Resources and Tools
Numerous online platforms provide computer database assistance for homework. Websites like All Assignment Experts offer professional guidance, tutorials, and assignment help to enhance your understanding of databases. Other useful resources include:
W3Schools and TutorialsPoint for database tutorials.
YouTube channels offering step-by-step database lessons.
Interactive coding platforms like Codecademy.
4. Work on Real-Life Database Projects
Practical experience is the best way to solidify your knowledge. Try creating a small database for:
A library management system.
An online store with customer orders.
A student database with courses and grades.
This hands-on approach will help you understand real-world applications and make it easier to complete assignments.
5. Understand Database Relationships
One of the biggest challenges students face is understanding database relationships. The three main types include:
One-to-One: Each record in Table A has only one corresponding record in Table B.
One-to-Many: A record in Table A relates to multiple records in Table B.
Many-to-Many: Multiple records in Table A relate to multiple records in Table B.
Using Entity-Relationship Diagrams (ERDs) can help visualize these relationships.
6. Debug SQL Queries Effectively
If your SQL queries aren’t working as expected, try these debugging techniques:
Break queries into smaller parts and test them individually.
Use EXPLAIN to analyze how queries are executed.
Check for syntax errors and missing table relationships.
7. Seek Expert Assistance When Needed
If you find yourself struggling, don’t hesitate to seek help. All Assignment Experts offers computer database assistance for homework, providing expert solutions to your database-related queries and assignments.
8. Stay Updated with Advanced Database Technologies
The database field is constantly evolving. Explore advanced topics such as:
NoSQL Databases (MongoDB, Firebase): Used for handling unstructured data.
Big Data and Cloud Databases: Learn about databases like AWS RDS and Google BigQuery.
Data Security and Encryption: Understand how databases protect sensitive information.
Conclusion
Understanding computer databases is crucial for students handling homework assignments. By mastering basic concepts, practicing SQL, utilizing online resources, and working on real projects, you can excel in your database coursework. If you need professional guidance, All Assignment Experts provides top-notch computer database assistance for homework, ensuring you grasp key concepts and score better grades.
Start applying these tips today, and you’ll soon develop a solid understanding of databases!
#computer database assistance for homework#computer database assistance#education#homework#do your homework
1 note
·
View note
Text
Explain advanced transformations using Mapping Data Flows.

Advanced Transformations Using Mapping Data Flows in Azure Data Factory
Mapping Data Flows in Azure Data Factory (ADF) provide a powerful way to perform advanced transformations on data at scale. These transformations are executed in Spark-based environments, allowing efficient data processing. Below are some of the key advanced transformations that can be performed using Mapping Data Flows.
1. Aggregate Transformation
This transformation allows you to perform aggregate functions such as SUM, AVG, COUNT, MIN, MAX, etc., on grouped data.
Example Use Case:
Calculate total sales per region.
Find the average transaction amount per customer.
Steps to Implement:
Add an Aggregate transformation to your data flow.
Choose a grouping column (e.g., Region).
Define aggregate functions (e.g., SUM(SalesAmount) AS TotalSales).
2. Pivot and Unpivot Transformations
Pivot Transformation: Converts row values into columns.
Unpivot Transformation: Converts column values into rows.
Example Use Case:
Pivot: Transform sales data by year into separate columns.
Unpivot: Convert multiple product columns into a key-value structure.
Steps to Implement Pivot:
Select a column to pivot on (e.g., Year).
Define aggregate expressions (e.g., SUM(SalesAmount)).
Steps to Implement Unpivot:
Select multiple columns to unpivot.
Define a key-value output structure.
3. Window Transformation
Allows performing operations on a specific window of rows, similar to SQL window functions.
Example Use Case:
Calculate a running total of sales.
Find the rank of customers based on their purchase amount.
Steps to Implement:
Define partitioning (e.g., partition by CustomerID).
Use window functions (ROW_NUMBER(), RANK(), LEAD(), LAG(), etc.).
4. Lookup Transformation
Used to join two datasets based on a matching key.
Example Use Case:
Enrich customer data by looking up additional details from another dataset.
Steps to Implement:
Define the lookup source dataset.
Specify the matching key (e.g., CustomerID).
Choose the columns to retrieve.
5. Join Transformation
Allows joining two datasets using various join types (Inner, Outer, Left, Right, Cross).
Example Use Case:
Combine customer and order data.
Steps to Implement:
Select the join type.
Define join conditions (e.g., CustomerID = CustomerID).
6. Derived Column Transformation
Allows adding new computed columns to the dataset.
Example Use Case:
Convert date format.
Compute tax amount based on sales.
Steps to Implement:
Define expressions using the expression builder.
7. Conditional Split Transformation
Splits data into multiple outputs based on conditions.
Example Use Case:
Separate high-value and low-value orders.
Steps to Implement:
Define conditional rules (e.g., SalesAmount > 1000).
8. Exists Transformation
Checks if records exist in another dataset.
Example Use Case:
Identify customers who have made a purchase.
Steps to Implement:
Select the reference dataset.
Define the existence condition.
9. Surrogate Key Transformation
Generates unique IDs for records.
Example Use Case:
Assign unique customer IDs.
Steps to Implement:
Define the start value and increment.
10. Rank Transformation
Assigns ranking based on a specified column.
Example Use Case:
Rank products by sales.
Steps to Implement:
Define partitioning and sorting logic.
Conclusion
Azure Data Factory’s Mapping Data Flows provide a variety of advanced transformations that help in complex ETL scenarios. By leveraging these transformations, organizations can efficiently clean, enrich, and prepare data for analytics and reporting.
WEBSITE: https://www.ficusoft.in/azure-data-factory-training-in-chennai/
0 notes
Text
Exploring the Key Facets of Data in Data Science

Data is at the heart of everything in data science. But it’s not just about having a lot of data; it’s about knowing how to handle it, process it, and extract meaningful insights from it. In data science, we work with data in many different forms, and each form has its own unique characteristics. In this article, we’re going to take a closer look at the important aspects of data that data scientists must understand to unlock its full potential.
1. Types of Data: Understanding the Basics
When you dive into data science, one of the first things you’ll encounter is understanding the different types of data. Not all data is created equal, and recognizing the type you’re working with helps you figure out the best tools and techniques to use.
Structured Data: This is the kind of data that fits neatly into rows and columns, like what you'd find in a spreadsheet or a relational database. Structured data is easy to analyze, and tools like SQL are perfect for working with it. Examples include sales data, employee records, or product inventories.
Unstructured Data: Unstructured data is a bit trickier. It’s not organized in any set format. Think about things like social media posts, emails, or videos. This type of data often requires advanced techniques like natural language processing (NLP) or computer vision to make sense of it.
Semi-structured Data: This type of data is somewhere in the middle. It has some structure but isn’t as organized as structured data. Examples include XML or JSON files. You’ll often encounter semi-structured data when pulling information from websites or APIs.
Knowing the type of data you’re dealing with is crucial. It will guide you in selecting the right tools and methods for analysis, which is the foundation of any data science project.
2. Data Quality: The Foundation of Reliable Insights
Good data is essential to good results. Data quality is a huge factor in determining how reliable your analysis will be. Without high-quality data, the insights you generate could be inaccurate or misleading.
Accuracy: Data needs to be accurate. Even small errors can distort your analysis. If the numbers you're working with are wrong, the conclusions you draw won’t be reliable. This could be something like a typo in a database entry or an incorrect sensor reading.
Consistency: Consistency means the data is uniform across different sources. For example, you don't want to have "NY" and "New York" both used to describe the same location in different parts of your dataset. Consistency makes it easier to work with the data without having to constantly fix small discrepancies.
Completeness: Missing data is a common issue, but it can be a real problem. If you’re working with a dataset that has missing values, your model or analysis might not be as effective. Sometimes you can fill in missing data or remove incomplete rows, but it’s important to be mindful of how these missing pieces affect your overall results.
Data scientists spend a lot of time cleaning and validating data because, at the end of the day, your conclusions are only as good as the data you work with.
3. Transforming and Preprocessing Data
Once you’ve got your data, it often needs some work before you can start drawing insights from it. Raw data usually isn’t in the best form for analysis, so transforming and preprocessing it is an essential step.
Normalization and Scaling: When different features of your data are on different scales, it can cause problems with some machine learning algorithms. For example, if one feature is measured in thousands and another is measured in ones, the algorithm might give more importance to the larger values. Normalizing or scaling your data ensures that everything is on a comparable scale.
Feature Engineering: This involves creating new features from the data you already have. It’s a way to make your data more useful for predictive modeling. For example, if you have a timestamp, you could extract features like day of the week, month, or season to see if they have any impact on your target variable.
Handling Missing Data: Missing data happens. Sometimes it’s due to errors in data collection, and sometimes it’s just unavoidable. You might choose to fill in missing values based on the mean or median, or, in some cases, remove rows or columns that have too many missing values.
These steps ensure that your data is clean, consistent, and ready for the next stage of analysis.
4. Integrating and Aggregating Data
In real-world projects, you rarely get all your data in one place. More often than not, data comes from multiple sources: databases, APIs, spreadsheets, or even data from sensors. This is where data integration comes in.
Data Integration: This process involves bringing all your data together into one cohesive dataset. Sometimes, this means matching up similar records from different sources, and other times it means transforming data into a common format. Integration helps you work with a unified dataset that tells a full story.
Data Aggregation: Sometimes you don’t need all the data. Instead, you might want to summarize it. Aggregation involves combining data points into a summary form. For example, if you're analyzing sales, you might aggregate the data by region or time period (like daily or monthly sales). This helps make large datasets more manageable and reveals high-level insights.
When you're dealing with large datasets, integration and aggregation help you zoom out and see the bigger picture.
5. The Importance of Data Visualization
Data visualization is all about telling the story of your data. It’s one thing to find trends and patterns, but it’s another to be able to communicate those findings in a way that others can understand. Visualization is a powerful tool for data scientists because it makes complex information more accessible.
Spotting Trends: Graphs and charts can help you quickly see patterns over time, like a rise in sales during the holiday season or a dip in customer satisfaction after a product launch.
Identifying Outliers: Visualizations also help you identify anomalies in the data. For instance, a bar chart might highlight an unusually high spike in sales that warrants further investigation.
Making Sense of Complex Data: Some datasets are just too large to process without visualization. A heatmap or scatter plot can distill complex datasets into something much easier to digest.
Effective data visualization turns raw data into insights that are easier to communicate, which is a critical skill for any data scientist.
6. Data Security and Privacy: Ethical Considerations
In today’s data-driven world, privacy and security are huge concerns. As a data scientist, it’s your responsibility to ensure that the data you’re working with is handled ethically and securely.
Data Anonymization: If you’re working with sensitive information, it’s crucial to remove personally identifiable information (PII) to protect people's privacy. Anonymizing data ensures that individuals’ identities remain secure.
Secure Data Storage: Data should always be stored securely to prevent unauthorized access. This might mean using encrypted storage solutions or following best practices for data security.
Ethical Use of Data: Finally, data scientists need to be mindful of how the data is being used. For example, if you’re using data to make business decisions or predictions, it’s essential to ensure that your models are not biased in ways that could negatively impact certain groups of people.
Data security and privacy are not just legal requirements—they’re also ethical obligations that should be taken seriously in every data science project.
Conclusion
Data is the foundation of data science, but it's not just about having lots of it. The true power of data comes from understanding its many facets, from its structure and quality to how it’s processed, integrated, and visualized. By mastering these key elements, you can ensure that your data science projects are built on solid ground, leading to reliable insights and effective decision-making.
If you’re ready to dive deeper into data science and learn more about handling data in all its forms, seeking out a data science course nearby might be a great way to gain hands-on experience and expand your skill set.
0 notes