#visual method for algebra
Explore tagged Tumblr posts
Visit Tumblr Blog
Explore Tumblr blogs with no restrictions, modern design and the best experience.
Last Seen Tumblr Blogs


Fun Fact
In 2020, 27% of US Tumblr users had an annual household income of over $100,000.
Text
🎯 Master the Graphical Method to Solve Inequalities for JEE | JEE Series Part-10 | 9nid
📖 Introduction: Solving inequalities is one of the most important concepts in JEE Mathematics, and if you’re preparing seriously, then the Graphical Method is a tool you must master. In Part-10 of the JEE Series by 9nid, we dive deep into the Graphical Approach to Inequalities, explaining how to visualize and solve even the trickiest algebraic inequalities with confidence. This session is…
#9nid maths JEE series#Algebra for JEE#graphical method for inequalities#graphical solution quadratic inequalities#how to solve inequalities JEE#inequality solving for IIT JEE#JEE Advanced maths tricks#JEE inequalities tricks#JEE inequality questions#JEE Main 2025 maths#JEE Main algebra questions#JEE maths shortcuts#JEE Preparation Hinglish#Learn Inequalities JEE#quadratic graph analysis JEE#quadratic inequality graph JEE#sign chart method JEE#solve inequalities using graphs#visual method for algebra
0 notes
Text
.𖥔 ݁ ˖ How to study: A note-taking and analytical reading guide ✦ ‧₊˚ ⋅
To preface,
One of the most important things to understand when it comes to learning, is the two styles of memory rehearsal.
Style 1: Elaborative Rehearsal
The act of understanding a concept so deeply it connects to your worldview, past experiences, and this piece of knowledge becomes yours.
Style 2: Maintained Rehearsal
Reviewing a piece of information to memorize a fact, but not the concept and the roots of the context.
+ It is important to think for yourself; form your own connections and learn because you want to learn, not just in hopes of getting good marks. Knowledge is beautiful and powerful, and should be utilized in the appropriate way.
Part 1: Reading non-fiction/informative based texts
Technique 1: "The Walden Method"
Step 1: Inspectional reading
Quickly (!!) read the entire chapter
Know exactly what happened
Know exactly what stood out to you
Know what to look for
+ Highlight things that stand out to you (in any way) and/or take small notes in the margins ("interesting!" "what" "love!")
(This forms the backbone of your understanding for this topic)
Step 2: Analytical reading
Gather a general understanding of the material
Create a concise map of your thoughts, and small details of the text
+ Intricate connections begin to take place because pieces of information now make sense with the general backbone you formed in the inspectional reading.
Step 3: Take notes in a flow-like fashion
Write down the backbone ideas/concepts
(What year did the French Revolution take place? What were its important influences? Who were important figures during this time?)
Elaborate on these backbone ideas/concepts to give you a visual representation of the connections you made with your backbone, and to see what still needs to be understood.
Part 2: Taking notes of non-fiction/informative based texts
Technique 2: "The Cal Newport Method" - (for non-technical subjects)
Base your notes around these three points in this order to make your notes as clear and concise as possible:
Q-question
E-evidence
A-answer
+ When/if you are in a lecture, scribble down everything your instructor says of importance, and then revise your notes immediately after.
+ You must group your evidence and conclusion pieces carefully, being sure to link the proper piece of evidence to the correct conclusion.
(EX:
Question: What are Emily's favorite colors?
Evidence #1: Her mother says she likes pink.
Evidence #2: Her father says she likes pink, and yellow.
Evidence #3: Her brother says she likes blue, but only when its December.
Conclusion: Emily's general favorite colors are pink and yellow, as well as blue only when it is December.
^^ It is important to include the bit about it being her favorite color only in December because it would be incorrect to say it is one of her general favorite colors.)
Technique 3: "The Cal Newport Method" - (for technical subjects)
Base your notes around these three points in this order to make your notes as clear and concise as possible:
P-problem
Q-question
A-answer
Step 1: Understand the large, basic concepts first
+ Do not drive head first into math problems or questions concerning the nervous system if you do not understand the large, basic concepts first.
Step 2: Note-taking
Write down practice problems/diagrams/equations, etc.
Write each step to solving/understanding this problem/diagram/equation, etc.
Annotate each step, explaining why this is so
For equations, write down a practice problem for each possible alternative outcome that can happen
(EX:
1. How to solve an algebraic equation.
2. How to solve an algebraic equation with a square root.
3. How to solve an algebraic equation with square roots, etc.
Technique 4: The Feynman Method
You do not fully understand a subject until you can explain it to a child, and reword it yourself without notes
Part 3: Studying non-fiction/informative based texts
Testing yourself with flashcards and quizzes
Forces you to actively retrieve knowledge, which updates, and reinforces memory
Allows you to actively gage what you already know
Making mistakes actually improves knowledge and memory
2. Use flashcards
When using flashcards, it is best to mix the deck with multiple subjects, interweaving the concepts you focus on in a single session, is more effective than practicing a single skill one at a time.
This further strengthens memory because it forces the brain to temporarily forget, then retrieve information.
You may also find connections across the topics, making it more significant to your brain.
3. Rest, review, rest, review
Spacing reviews across multiple days allows for rest, and retention between sessions.
+ Cramming is not effective because while you could remember information from the night previously, it will not stay ingrained in your long term memory, or even just as likely in your memory the next morning...
Part 3: On essay writing
The more complicated your essay is, the dumber it sounds.
When writing a research paper, refine the scope of your research and don't be afraid to narrow it.
When writing a research paper, create a pile of at least 20 academic papers on the same subject.
+ Sift through these papers with your scope in mind
+ This is the breeding ground for new ideas
Give yourself time to process information right after reading.
View the writing process as an exploration
This is a collection of information collected from these sources:
R. C. Walden - Youtube
youtube
youtube
Cal Newport - How to become a straight-A student: The unconventional strategies real college students use to score high while studying less
TED-Ed
youtube
#academic validation#academic weapon#studyblr#literature#student life#classical art#stemblr#books and libraries#dark academia vibes#life tips#student tips#study motivation#studying#art academia#soft academia#study aesthetic#study blog#study hard#study inspiration#study notes#study space#study tips#studyinspo#studystudystudy#Youtube
64 notes
·
View notes
Text
Physics and Mathematics Resources (plus some Chemistry):
I will update this because I know I have more recommend textbooks somewhere in my files, I'm just too tired to look right now. Latest update: 5/13/25
Physics:
The Science Spot--Mostly lesson plans for teaching kids
The Physics Classroom Tutorial--Has interactive online activities and models. Some videos and also some chemistry stuff.
HyperPhysics--Quite possibly the best resource I've ever seen because it shows how all concepts are linked together. The site isn't loading for me but it says it's up. There is a downloadable version on the Internet Archive (though it doesn't look as nice and clean). EDIT: I found a GitHub that lets you clone and download the html so you can click through it offline and it works! If people are interested I can make a tutorial, it was very easy.

PhET--A ton of demonstrations and tutorials. Also has some for mathematics and chemistry.
Paradigms Physics Notes--this was the curriculum that was used in my junior and senior classes. A lot of stuff here. If you are interest about teaching physics using this method, you can read more here.
Quantum Mathamatica Add-on--Useful for calculations.
The Hypertextbook--uhh lots here. Problems, solutions, explanations, etc.
oPhysics--interactive physics software.
MiniPhysics--more demonstrations and interactive software.
Michel van Biezen--really clear work-throughs of many subjects (algebra, calculus, chemistry, physics). He actually has a tumblr but has been active in like a decade @ilectureonline
Mathematics:
Paul's Online Math Notes--Got my whole class through junior and senior year
Calculator Soup--a lot of different kinds of calculators
3Blue1Brown--Very interesting youtube channel that shows a lot of calculus and linear algebraic principals visually or in intuitive ways.
Mathologer--more interesting advanced mathematical concepts.
General:
OpenStax--Free textbooks, legally
#physicsgoblinthoughts#resources#physics#math#mathematics#chemistry#learning resources#textbooks#school
29 notes
·
View notes
Text
Sir Roger Penrose
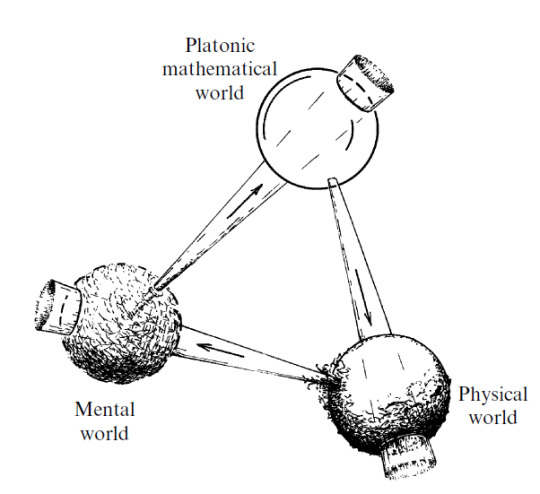
To me, the world of perfect forms is primary (as was Plato’s own belief) — its existence being almost a logical necessity — and both the other two worlds are its shadows.
Sir Roger Penrose, born on August 8, 1931, in Colchester, Essex, England, is a luminary in the realm of mathematical physics. His journey began with a Ph.D. in algebraic geometry from the University of Cambridge in 1957, and his career has spanned numerous prestigious posts at universities in both England and the United States. His work in the 1960s on the fundamental features of black holes, celestial bodies of such immense gravity that nothing, not even light, can escape, earned him the 2020 Nobel Prize for Physics.
Penrose’s work on black holes, in collaboration with Stephen Hawking, led to the ground-breaking discovery that all matter within a black hole collapses to a singularity, a point in space where mass is compressed to infinite density and zero volume. This revelation illuminated our understanding of these enigmatic cosmic entities.
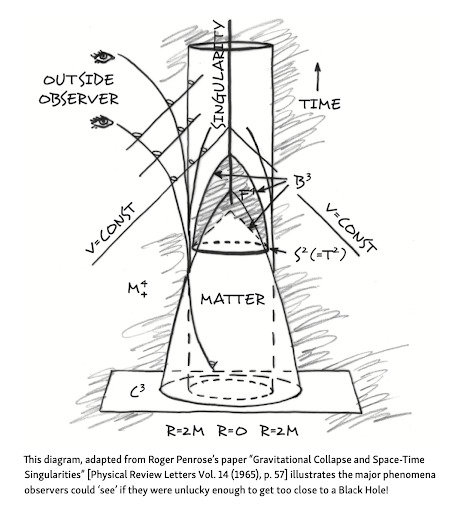
His work did not stop at the theoretical; he also developed a method of mapping the regions of space-time surrounding a black hole, known as a Penrose diagram. This tool allows us to visualize the effects of gravitation upon an entity approaching a black hole, providing a window into the heart of these celestial mysteries.
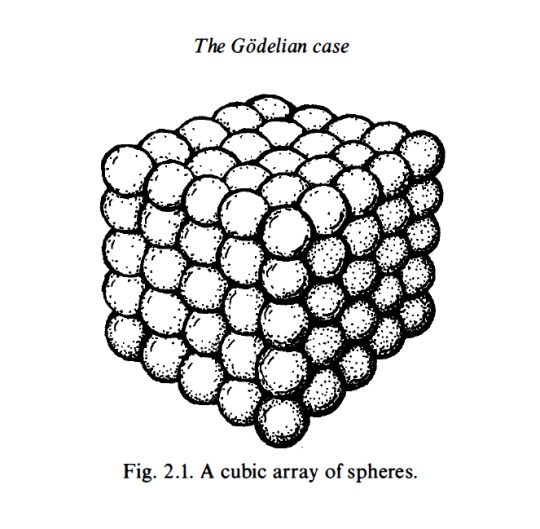
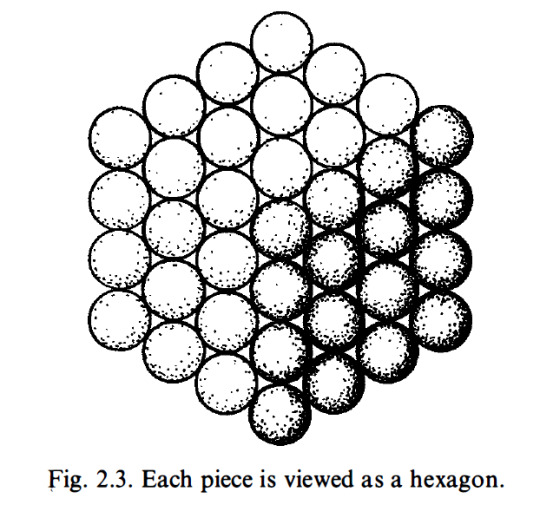
Within Penrose’s chapter, “The Godelian Case” (from “The Road to Reality”) the profound implications of Kurt Gödel’s incompleteness theorems are examined in relation to the connection between mathematics and geometry. Specifically, Penrose’s attention centers on the model depicted in Figure 2.1, which portrays a cubic array of spheres. Through this visual representation, Penrose explores the intricate relationship between geometry and mathematical understanding.
By introducing the model of a cubic array of spheres, Penrose highlights the fundamental role of spatial arrangements in mathematical cognition. This geometrical structure serves as a metaphorical embodiment of mathematical concepts, illustrating how spatial configurations can stimulate cognitive processes and facilitate intuitive comprehension of mathematical truths. The intricate interplay between the arrangement of spheres within the model and the underlying principles of mathematics encourages contemplation on the deep-rooted connections between geometry, spatial reasoning, and abstract mathematical thought.
Penrose’s utilization of the cubic array of spheres underscores his broader philosophical framework, which challenges reductionist accounts of human cognition that rely solely on formal systems or computational models. Through this geometrical representation, he advocates for a more holistic understanding of mathematical insight, one that recognizes the essential role of geometric intuition in shaping human understanding.
By looking at the intricate connection between mathematics and geometry, Penrose prompts a re-evaluation of the mechanistic view of cognition, emphasizing the need to incorporate spatial reasoning and intuitive geometrical understanding into comprehensive models of human thought.
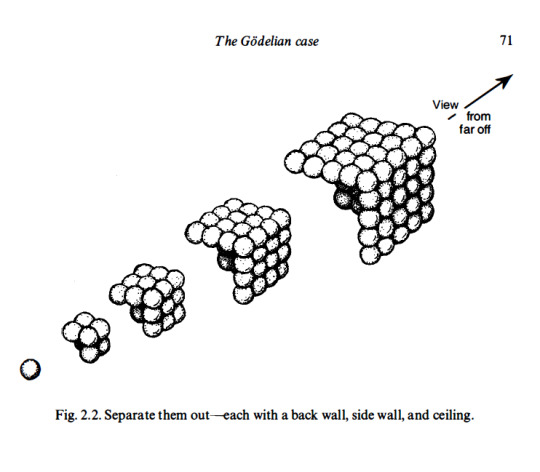
(E) Find a sum of successive hexagonal numbers, starting from 1 , that is not a cube. I am going to try to convince you that this computation will indeed continue for ever without stopping. First of all, a cube is called a cube because it is a number that can be represented as a cubic array of points as depicted in Fig. 2. 1 . I want you to try to think of such an array as built up successively, starting at one corner and then adding a succession of three-faced arrangements each consisting of a back wall, side wall, and ceiling, as depicted in Fig. 2.2. Now view this three-faced arrangement from a long way out, along the direction of the corner common to all three faces. What do we see? A hexagon as in Fig. 2.3. The marks that constitute these hexagons, successively increasing in size, when taken together, correspond to the marks that constitute the entire cube. This, then, establishes the fact that adding together successive hexagonal numbers, starting with 1 , will always give a cube. Accordingly, we have indeed ascertained that (E) will never stop.
Penrose’s work is characterized by a profound appreciation for geometry. His father, a biologist with a passion for mathematics, introduced him to the beauty of geometric shapes and patterns at a young age. This early exposure to geometry shaped Penrose’s unique approach to scientific problems, leading him to develop new mathematical notations and diagrams that have become indispensable tools in the field. His creation of the Penrose tiling, a method of covering a plane with a set of shapes without using a repeating pattern, is a testament to his innovative thinking and his deep understanding of geometric principles.
His fascination with geometry extended beyond the realm of mathematics and into the world of art. He was deeply influenced by the work of Dutch artist M.C. Escher, whose intricate drawings of impossible structures and infinite patterns captivated Penrose’s imagination. This encounter with Escher’s art led Penrose to explore the interplay between geometry and art, culminating in his own contributions to the field of mathematical art. His work in this area, like his scientific research, is characterized by a deep appreciation for the beauty and complexity of geometric forms.
In geometric cognition, Penrose’s work has the potential to make significant contributions. His unique perspective on the role of geometry in understanding the physical world, the mind, and even art, offers a fresh approach to this emerging field. His belief in the power of geometric thinking, as evidenced by his own ground-breaking work, suggests that a geometric approach to cognition could yield valuable insights into the nature of thought and consciousness.
Objective mathematical notions must be thought of as timeless entities and are not to be regarded as being conjured into existence at the moment that they are first humanly perceived.

I argue that the phenomenon of consciousness cannot be accommodated within the framework of present-day physical theory.
His Orch OR theory posits that consciousness arises from quantum computations within the brain’s neurons. This bold hypothesis, bridging the gap between the physical and the mental, has sparked intense debate and research in the scientific community.
Penrose’s work on twistor theory, a geometric framework that seeks to unify quantum mechanics and general relativity, is a testament to his belief in the primacy of geometric structures. This theory, which represents particles and fields in a way that emphasizes their geometric and topological properties, can be seen as a metaphor for his views on cognition. Just as twistor theory seeks to represent complex physical phenomena in terms of simpler geometric structures, Penrose suggests that human cognition may also be understood in terms of fundamental geometric and topological structures.
This perspective has significant implications for the field of cognitive geometry, which studies how humans and other animals understand and navigate the geometric properties of their environment. If Penrose’s ideas are correct, our ability to understand and manipulate geometric structures may be a fundamental aspect of consciousness, rooted in the quantum geometry of the brain itself.
The final conclusion of all this is rather alarming. For it suggests that we must seek a non-computable physical theory that reaches beyond every computable level of oracle machines (and perhaps beyond). — Roger Penrose, Shadows of the Mind: A Search for the Missing Science of Consciousness
#geometrymatters#roger penrose#geometric cognition#cognitive geometry#consciousness#science#research#math#geometry
78 notes
·
View notes
Text
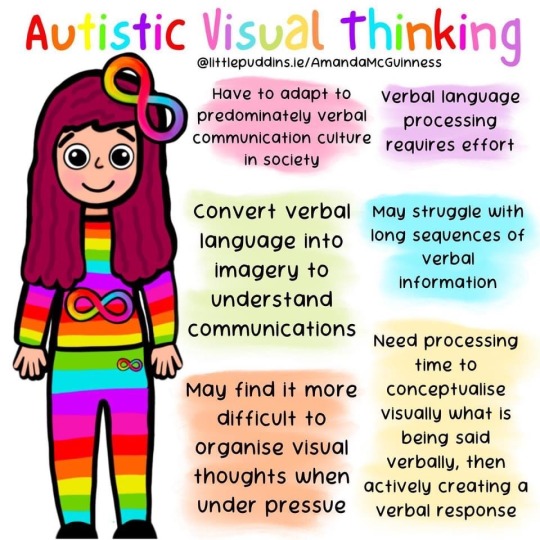
Autistic Visual Thinking

Have to adapt to predominantly verbal communication culture in society
Convert verbal language into imagery to understand communication
May find it more difficult to organize visual thoughts when under pressure
Verbal language processing requires effort
May struggle with long sequences of verbal information
Need processing time to conceptualize visually what is being said verbally, then actively creating a verbal response

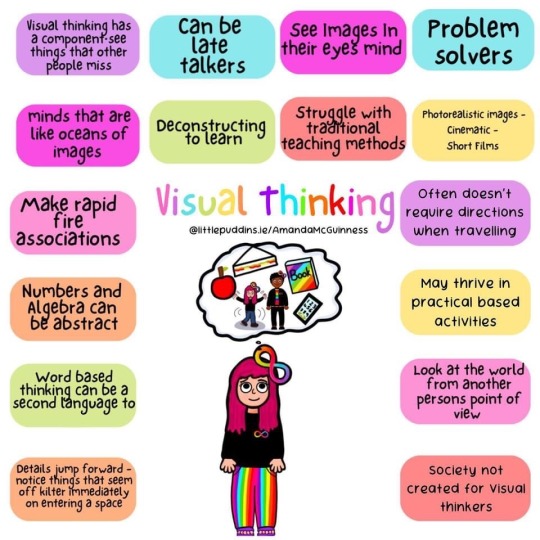
Visual thinking has a component-see things that others miss
Minds that are like oceans of images
Make rapid fire associations
Numbers and algebra can be abstract
Word based thinking can be a second language too
Details jump forward-notice things that seem off kilter immediately on entering a space
Can be late talkers
Deconstructing to learn
See images in their eyes mind
Struggle with traditional teaching method
Problem solvers
Photorealistic images - Cinematic - Short Films
Often doesn't require directions when traveling
May thrive in practical based activities
Look at the world from another persons point of view
Society not created for Visual thinkers
LilPuddins.ie
#autism#actually autistic#autism and visual thinking#we view the world differently#I like to learn visually#verbal processing#converting language to imagery#neurodivergence#neurodiversity#actually neurodivergent#feel free to reblog/share#LilPuddins.ie (facebook)
233 notes
·
View notes
Text
𝗛𝗔𝗣𝗣𝗬 𝗕𝗜𝗥𝗧𝗛𝗗𝗔𝗬, 𝗟𝗢𝗨𝗜𝗦 𝗕𝗥𝗔𝗜𝗟𝗟𝗘! 📖

A French teacher and inventor, Louis created the Braille system — a tactile code of raised dots that unlocked the world of reading and writing for the visually impaired, including himself.
Today, his groundbreaking invention empowers millions to chase their dreams and shape a brighter future.
At just three years old, Louis Braille suffered an eye injury in his father’s workshop. The wound became infected, leading to total blindness.
During his era, blind individuals relied on tracing raised print letters to read — a method that was slow and rarely mastered.
As a student at the National Institute for Blind Youth in Paris in 1825, Braille sought a better system.
Outside of class, he experimented with punching holes in paper to create a more efficient reading and writing system.
His breakthrough came after meeting Charles Barbier, a former artillery officer who demonstrated a system of embossed dots representing sounds, designed for soldiers to share messages silently in the dark.
Inspired, Braille adapted and refined the idea, spending three years perfecting a code of embossed dots to represent letters and numbers.
By 1824, Braille had developed his revolutionary system and published "Procedure for Writing Words, Music, and Plainsong in Dots."
Although initially supported at his institute, a new director banned its use in 1840, fearing it might render teachers obsolete.
Despite this, Braille continued teaching subjects like history and algebra until he died in 1852.
Recognition came posthumously, with France officially adopting his system in 1854 and its global spread by the 1870s.
—
REFERENCES:
[1] Braille World (n.d.). History of Braille.
Source: brailleworks.com
[2] Britannica, T. Editors of Encyclopaedia (2025). Louis Braille. Encyclopedia Britannica.
Source: britannica.com
[3] Musée Louis Braille (n.d.). Braille the inventor.
Source: museelouisbraille.com
[4] Roth, G. A., & Fee, E. (2011). The invention of Braille. American journal of public health, 101(3), 454.
Source: doi.org
#Louis Braille#Braille system#visually impaired#Charles Barbier#embossed dots#letters#numbers#france#paris#National Institute for Blind Youth#invention#on this day#born on this day#science#birthday
19 notes
·
View notes
Text
“Functions” of Various Areas in Mathematics
I recently took an interest in category theory… well not really. I have no business or background to explore that topic yet, although I look forward to doing so in the future.
I primarily took an interest in understanding what category theory seems to answer: what is the fundamental structure of common mathematical areas (algebra, analysis, combinatorics, etc.)
Following my summer research project, I began to notice the somewhat “interdisciplinary” approach many great mathematicians employ, regardless of highly specialized pure mathematics has become. My favorite memory from July is as follows:
“Hey, could I walk you through this question I’ve been working on, I think a representation theorist’s approach could be useful here.”
“Yeah let’s grab that chalkboard over there, I’ll let you know if I have trouble with any of the analysis terms, but I’m curious!”
They talked for hours at length. I all honesty, witnessing these interactions every day made me fall in love with the field even more than I knew possible.
Once I returned to my primary institution in the fall, I began interdisciplinary research in two (non-math) fields to financially support myself (if I had to work, why not do something I love?)
I was the theorist on the team, and quickly realized how applicable the extremely abstract concepts I’d learned were… and also how I needed to learn the “language of their field,” to collaborate effectively.
I noticed patterns in the the concepts/areas of math that helped with certain “functional needs,” and have (loosely) tried to categorize them for myself.
Linear Algebra: the language of “dependence,” between objects, and how to handle it effectively.
Algebra (generally): the language of similarity and variance, and consequences of each form.
Analysis (generally): language of processes, and how they might develop over up to infinite amounts of time.
Combinatorics: the language of predictability, patterns, and in many ways, of relation.
Geometry: the language of visual intuition, of structural behavior.
This list and each description will certainly change as I advance in my studies, and in truth, many ideas here overlap. Yet, I find these classifications quite helpful in research…
I am recently curious in proofs and methods that combine seemingly unrelated areas of math.
How does one effectively bridge transitions between ideas? What are some ideas that simply make no sense to connect… if any? Why haven’t many tried?
9 notes
·
View notes
Text
Unnonexistence's Notecard Method for Learning Mathematics
Hello! This is the study method I developed after flunking out of first-year university algebra and having to retake it! It may or may not be particularly innovative and it may or may not help you, but I did (eventually) graduate with a Bachelor's degree in math despite having unmedicated ADHD, so, y'know, there's that. I owe it mostly to the notecards.
DISCLAIMER that any example cards are my actual real notes & I am not fact-checking them. They lean towards intuitive rather than strictly correct & were only ever intended to be for personal reference. I did pass these courses, and I think most of the cards are pretty good, but like... use at your own risk.

You Will Need:
A pack of index cards. I like the 3" x 5" ones that are lined on the front and blank on the back.
Some pens you like. I use fine-tip markers in about 4 colours, plus a white gel pen for fixing mistakes. Pencil can get smudgy over time, so it's not ideal.
Any course materials you have (notes, textbook, etc.)
Optionally, a nice box for your index cards. (You can also just use a rubber band or something. Whatever).
General Approach
We're making reference cards. One concept per card. You probably have an intuitive sense of how big A Concept is for you - it should be an amount of information that can comfortably fit in your brain at one time. If it doesn't fit on one or maaaybe two cards, it's probably too big.

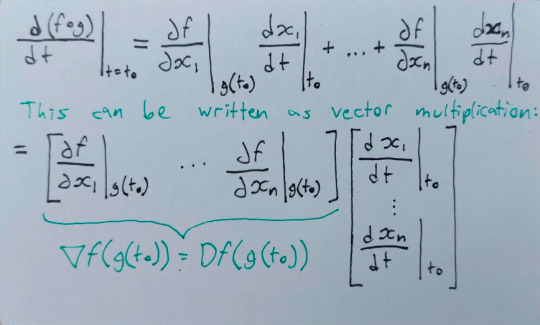

Here's a topic I broke up into two cards - Chain Rule and Extension of Chain Rule. One IS an extension of the other, but the information is a lot easier to remember in two chunks. (3 pictures, here, because the first card is double-sided).
You are NOT trying to cram as much information as you can onto each card. You are trying to create an easy reference for yourself, which means making the cards as clear and legible as you can. When it's 5 minutes before your calculus exam and you're having a panic attack because you forgot how the chain rule works, you want to be able to flip through, find that Chain Rule card, and be able to absorb the information on there.
For math courses, A Concept is often a definition, a theorem, a formula, or a problem-solving approach. As much as possible, you want to write it down in a way that makes sense to you. Add any helpful tips or intuitive explanations or things you keep forgetting. If your cards are blank on the back, that's a great place to draw diagrams.

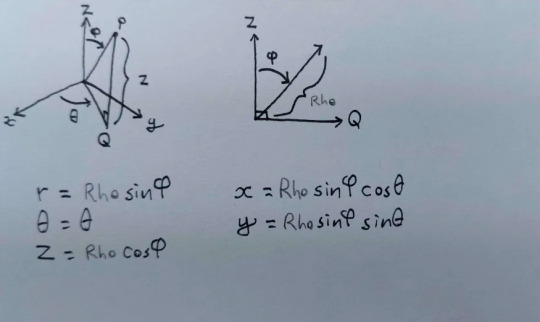
(On the back of this card you can see where I wrote "Rho" in pencil and never bothered to replace it with the symbol, lol. My prof had bad handwriting & I wasn't sure how it was supposed to look.)
Proofs are often too long to fit on a card, but if you have a theorem where the proof is important, it's a good idea to write out a little summary of how the proof works/how to do it.

Ideally, you do the work of Understanding The Concept when you're making the card, and then you can just refer back to it in future. I forget definitions a lot, and this saved me so much time that I would have spent reading one confusing page of the textbook over and over or trying to find stuff in my notes.
I try to keep my formatting mostly consistent. Clear title. Card numbers in the top right corner so I know if anything's missing. Definitions in black ink with important words underlined in colour. I tend to use coloured ink for things like examples and personal commentary. I also use it to create a visual distinction when I do need to cram something on there (not ideal, but sometimes necessary).


The Method
Sit down with your class notes or your textbook. Your goal is to get all the important concepts you're supposed to have learned in this course so far onto notecards. (Probably not all in one go.)
The ideal time to do this is right after each lecture (most math lectures are around 2-5 cards worth of material), but that's easier said than done. I always had a hard time keeping up & all my card decks, as a result, get spottier towards the end of the term. It's fine. Do your best.
I mostly went through the course material in order. I kept checklists of which lectures I had already made cards for, and which ones still needed doing.
If you don't really get something, but you know you need a card for it, at least put the definition down. You can make a better version or add more notes later. I sometimes make placeholder cards with just a title so I'll remember to come back to something.
If you write down a definition, and you're like "this refers to another thing, and idk what it is but it's come up a few times now," you probably need to make a notecard for that other thing.
How I Use The Cards
When you're doing assignments, it's really useful to have your stack of cards there to refer to. If something comes up that you don't remember the definition for, you can look it up. If you're doing proofs, having all the theorems from the course handy is a great way of getting ideas for where to start. If you're doing calculations, it's helpful to have the techniques you need written out step by step.


I spent a lot of my exam prep time making cards and going through the ones I'd made. It gave me a sense of what I already knew and what I needed to spend more time on. Having things broken up into small chunks also made it a lot easier for my brain to hang onto them.
After making cards like this for a few terms, I also found them really helpful for reviewing concepts from previous courses. Sometimes you just need to refresh your memory on something from the prereq so you're not totally lost. I've graduated now & I still refer back to my cards sometimes.
Conclusion
Well, that's my (somewhat rambly) explanation of my main study method! I hope it's helpful for at least a few people out there. I wish you the best of luck learning math & whatever else you might be studying. You've got this!!
#studyblr#mathblr#long post#idk the study tags. whatever#this is me writing without trying to hide the adhd much. hi#it's verbose. words fall out of brain and there are a lot of them. you know how it goes#also tumblr kept EATING MY DRAFT EDITS fuck u tumblr#r.i.p the slightly better version of this post that DIED#mine#numbers do not lie#also. apologies for the barebones image descriptions. idk how to transcribe the math properly and i don't really have the spoons to try#i did try to put the info that's relevant to this guide. theyre just examples of cards so the specific math isnt really important#math
7 notes
·
View notes
Note
You probably already know this, but for stoichiometry, instead of trying to solve Rv_1 = Pv_2, where R is the matrix of reactants and P the matrix of products, you can simply solve [R; -P] v = 0, which is cleaner, because you can just mechanically apply Gaussian elimination, instead of trying to guess and check. The visual intuition is simply that of finding some null-subspace within molecule-space (because within the null-space total atom/element count is constant)
:3 mhm, mhm; once someone pointed me at the linear algebra methods, I actually tried solving the problem sets I was given with Gaussian elimination, but I ended up going around in circles and giving myself headaches because I was shite at the recognized notation and I was using techniques I didn't really understand the implications of.
I ended up basically rebuilding similar ideas up out of geometric intuition wrt those vectors in moleculespace-
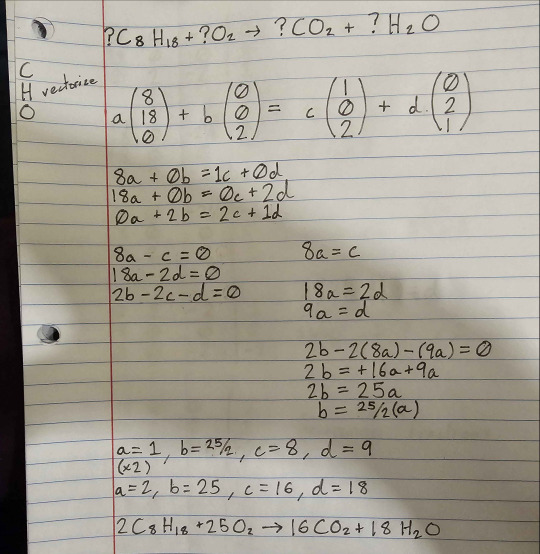
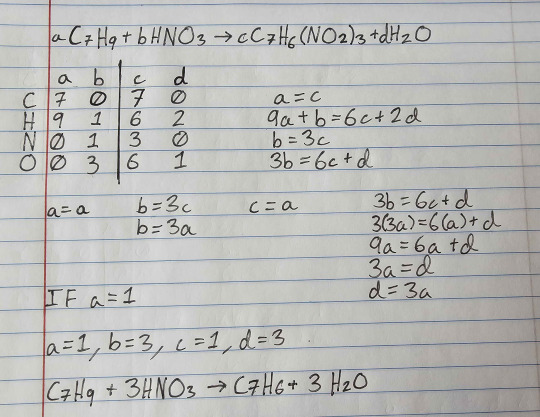
-using the matrix grids of numbers solely as writing shorthands and visual aids to extract linear equations, and cranking out elementary algebra on the linear equations.
my vague impression from independent research (i.e. stackexchange) is that all of this is totally babytier & direly insufficient for real srsbzns chemistry, b/c the ordering relationship between reactants and products in each equation is non-fundamental - that atomic species are conserved at this level (not accounting for nuclear reactions), but the recombinations of those species are determined by stochastic hops over gradients in the energy landscape, and can therefore somehow generate more pathologically complex balanced reactions than I'm prepared to understand with these techniques.
well, in the absence of a rationale to convince my chemistry department that I'm ready to sit in on higher-level lectures and get credits for it, that's why I'm self-studying more pure math in the mean time (i.e. watching 3blue1brown and very slowly working through the exercises in Linear Algebra Done Right, lol)
#i'm surprised you knew I was struggling with stoichiometry#if I've posted about it on tumblr I completely forgot about it lol
5 notes
·
View notes
Text
🧠 Master Graphical Applications of Quadratic Equations – Part 2 | JEE Series Part-15 | By 9nid
🎯 Introduction Quadratic Equations are one of the most tested and important topics in JEE Mathematics, and understanding their graphical behavior can make even the toughest questions feel easy! In Part-15 of the JEE Series by @9nid, we dive deeper into the Graphical Application of Quadratic Equations (Part-2) — focused on visualizing inequalities and interpreting expressions using…
#graph-based JEE questions#graphical application of quadratic equations#JEE Advanced quadratic graphs#JEE algebra in Hinglish#JEE Main 2025 maths#JEE maths graph method#JEE with 9nid#parabola graph JEE#quadratic equations visual method#quadratic expressions JEE#quadratic graph JEE#quadratic MCQs JEE#sign of quadratic expression#solve quadratic inequalities using graph
0 notes
Text
LOG TIME
Here’s some attempts I made to reteach myself how to graph logs and finding equations.
Graph—> equation

The idea was using the nearest whole number to the asymptote as the “key point” and then graphing from there.
If you’re a visual person when it comes to graphs, I’m sure it works great.
For me, I cannot for the life of me feel at ease around a graph. Something about visualizing it extremely hard and I usually prefer moving it via algebra — but only for logs lol.
. . . . . . . .
Equation —> graph
#1

This was my next idea. Idk why I thought less words would help. It made it harder to remember things since I wanted to make things simple in preparation for reflections (my mortal enemy).
. . . . .
#2

I’m using my old method! Logs are like magical unicorns and while I do understand when I concentrate how they work most of the time they’re unicorns. So I use exponential functions to figure out inputs and outputs since you just swap x & y and then you got a log to graph.
Thing is while I got a good method down I still couldn’t figure out how to put reflections in.
. . . .
#4 — Finalized method
Presenting: my method~
YAY! I CAN GRAPH LOGS AGAIN.

Interpreting graphs is so much easier folks. I get why my some profs just skip complicated reflections, so easy to forget or fuck it up if you don’t have a solid method.
. . .
Also this took me a solid 2 hours to figure out. I forgot about writing my story, reading, EVERYTHING. I was a math solving fanatic. I had a hunger, and it was for logs.
A hunger that would NOT be satiated until I could break a log and put it back together.
Omfg my brain is so fried 🥱😴
The hard part about logs is that my old method I use to crack the puzzle of most functions doesn’t work as well. Part of why linear, rational, exponential, and power functions are easier for me is because I can remember a few coordinate points or its easy af to figure out the math.
If I want to plot the points for a log graph, I got to use the change of base formula since my calculator only does logs with a base of ten TvT
My graphing calculator’s stuck in Test mode for the last 10 years. Never gave a shit to figure out how to get it out
Now that I got a new method, it’ll be interesting learning other methods so I can help tutor the kiddos. Cuz like I can try to do the more common method but I’ll have to pre-prep the problems or make sure to solve the base log with a change of base for the y-coordinate or I’m soooooo gonna fuck up. Lol.
I honestly do love math but math fuge is like my writing fuge.
So fun but exhausting af.
.
TIME TO FUCK UP THE REST OF PRECALC!!!
FUCK YEAAAAAAH!
6 notes
·
View notes
Text
7 Mathematics Problem Solving Strategies With Solutions Boost Your Learning
Mathematics Problem Solving Strategies With Solutions isn't merely approximately solving problems but growing a systematic approach to address numerous demanding situations. Here, we'll discover some effective problem-solving techniques that can useful resource students and specialists alike in their mathematical endeavors.

Understand the Problem
Mathematics Problem Solving Strategies For Students the first and most essential step is to very well recognize the hassle. Read the problem cautiously and pick out what is being asked. Break it down into simpler components if necessary. This might contain:
Restating the Problem
Rephrase the hassle on your own words to ensure comprehension.
Identifying Given Information
Note down what facts is supplied and what desires to be found.
Visualizing the Problem
Draw diagrams or graphs if the hassle is geometric or involves spatial reasoning.
Devise a Plan
Once you recognize the hassle, formulate a approach to remedy it. There are diverse strategies you may take:
Choose a Strategy:
Select the best strategy primarily based on the sort of problem. Common techniques include:
Direct Computation
Use formulas or algorithms to solve the trouble at once.
Backtracking:
Start from the solution and paintings backward.
Working Backwards
Begin with the preferred outcome and determine the stairs had to reach it.
Divide and Conquer
Break the problem into smaller, extra workable components and clear up each part one at a time.
Pattern Recognition
Look for patterns or sequences which could simplify the problem.
Use Analogies:
Relate the trouble to a comparable one you have solved before.
Develop a Step-through-Step Plan:
Outline the steps you will take to solve the hassle, making sure each step logically follows from the previous one.
Carry Out the Plan
Implement your preferred strategy and paintings through the hassle methodically. This section involves:
Executing Steps:
Follow the stairs mentioned on your plan. Be meticulous and double-check your calculations.
Keeping Track of Progress
Regularly assess whether or not you're transferring within the proper course. If you locate that the strategy isn’t running, be organized to revisit and revise your plan.
Review and Reflect
After attaining an answer, take the time to review your work:
Verify the Solution:
Check the outcomes to make sure they may be correct. Substitute your solution again into the original trouble if applicable.
Analyze the Process
Reflect on the approach you used. Consider if there has been a extra efficient way to remedy the trouble.
Learn from Mistakes
If the answer is incorrect, pick out where the mistake happened and understand why. Learning from mistakes allows in improving problem-fixing talents.
Common Strategies for Different Types of Problems
Here’s the way to follow the above techniques to extraordinary forms of mathematical issues:
Algebraic Problems
Simplify the Expression:
Combine like terms and simplify expressions as tons as possible.
Isolate Variables
Solve for the variable via isolating it on one aspect of the equation.
Check Solutions:
Substitute again into the unique equation to verify the solution.
Geometric Problems
Use Formulas
Apply appropriate geometric formulas for area, quantity, and perimeter.
Apply Theorems:
Utilize geometric theorems like Pythagorean theorem, residences of comparable triangles, etc.
Draw Diagrams:
Accurate diagrams can offer insights and assist in visualizing the problem.
Calculus Problems
Understand the Functions
Know the function’s behavior, inclusive of continuity and differentiability.
Apply Calculus Rules:
Use differentiation and integration rules as it should be.
Check Limits
Verify limits and asymptotic behavior for more complicated troubles.
Combinatorial Problems
Use Counting Principles:
Apply essential counting principles like diversifications and mixtures.
Inclusion-Exclusion Principle:
Use this principle for problems regarding overlapping units.
Generate Functions:
Use generating features for complex counting troubles.
Number Theory Problems
Use Divisibility Rules:
Apply regulations for divisibility to simplify the problem.
Explore Modular Arithmetic:
Use modular mathematics for troubles involving remainders.
Use Theorems:
Apply number concept theorems like Fermat’s Little Theorem or Euler’s Theorem.
Practice and Persistence
Consistent exercise is prime to becoming proficient in problem-solving. Regularly have interaction with numerous issues to build and strengthen your talents. Additionally:
Study Different Approaches
Explore various strategies and answers to apprehend a couple of approaches to resolve a hassle.
Work on Real-World Problems
Apply mathematical standards to actual-world scenarios to enhance realistic understanding.
Collaborate with Others
Discussing problems with peers or mentors can provide new insights and techniques.
Tools and Resources
Utilize various equipment and sources to aid in trouble-solving:
Mathematical Software
Tools like MATLAB, Mathematica, or maybe on line calculators can help in performing complicated calculations and visualizing facts.
Books and Journals
Refer to mathematical textbooks and research journals for in-intensity factors and superior strategies.
Online Forums and Communities
Mathematics Problem Solving Strategies For High School engage with online math communities for aid and collaborative problem-solving.

#Mathematics Problem Solving Strategies For High School#Mathematics Problem Solving Strategies For Students#Mathematics Problem Solving Strategies With Solutions
2 notes
·
View notes
Text
My Personal Reflection on GeoGebra
Hey everyone! Today, I want to share my thoughts on using GeoGebra, the amazing simulation software that has been a game-changer in my math studies. 📚✨
The Good Stuff 🌟
GeoGebra is seriously awesome for visualizing complex math concepts. Whether it’s geometry, algebra, or calculus, this tool makes everything so much easier to understand. You can see graphs, manipulate shapes, and perform calculations with just a few clicks. It’s like having a math playground right at your fingertips! 🖥️📊
The Flip Side 😕
But here’s where things get tricky. While GeoGebra is fantastic for learning, it has its downsides too. The biggest issue is that standardized tests and many classroom assessments don’t allow the use of such software. 📝🚫
This means we need to be good at manual calculations and understand the concepts deeply, without relying on technology. If we get too used to letting GeoGebra do all the work, we might find ourselves struggling during these tests. 📏🤔
Finding the Balance ⚖️
It’s all about balance, really. GeoGebra is a powerful tool that can enhance our learning, but we shouldn’t let it become a crutch. We need to make sure we’re equally comfortable doing math the old-fashioned way, with a pencil and paper. 🖊️📐
Final Thoughts 💭
In conclusion, GeoGebra is like a double-edged sword. It can boost our understanding and make learning math fun, but it also has the potential to make us reliant on technology. Let’s use it wisely and ensure we’re always prepared for those tech-free tests! 💪📘
Have any of you used GeoGebra? What are your thoughts on balancing tech and traditional learning methods? Drop your comments below! ⬇️💬
3 notes
·
View notes
Text
Visual Thinking
Have to adapt to Predominantly verbal communication culture in society
verbal processing communication culture requires effort
Convert verbal language into imagery to verbal understand communications
May struggle with long sequences of verbal information
May find it more difficult +o organise visual thoughts when under pressue
Need processing time to conceptualize visually what is being said verbally, then actively creating a verbal response
—————
Visual thinking has a component-are things that others miss
minds that are like oceans of images
Make rapid fire associations
Numbers and Algebra can be abstract
Word based thinking can be a second language to
Details jump forward - notice things that seem off kilter immediately on entering a space
can be late talkers
Deconstructing to learn
See Images In their eyes mind
Struggle with traditional teaching methods
Problem solvers
Photorealistic images-Cinematic-Short Films
Often doesn't require directions when traveling
May thrive in practical based activities
Look at the world from another persons point of view
society not created for Visual thinkers
Littlepuddins.ie
#visual thinking#information processing#communication#Littlepuddins.ie (facebook)#feel free to reblog/share#I hope many of you find this helpful/interesting#tw bright colors#tw eye strain
101 notes
·
View notes