#visualized math
Explore tagged Tumblr posts
Visit Tumblr Blog
Explore Tumblr blogs with no restrictions, modern design and the best experience.
Last Seen Tumblr Blogs


Fun Fact
Users from the US are the majority of Tumblr visitors.
Text
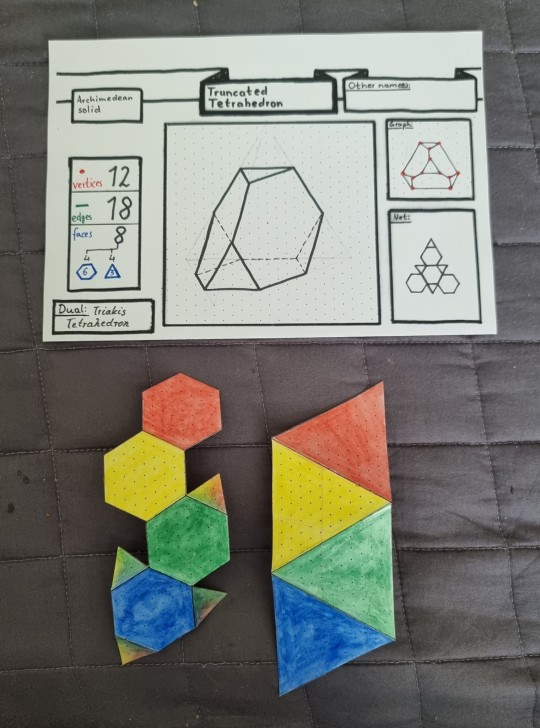
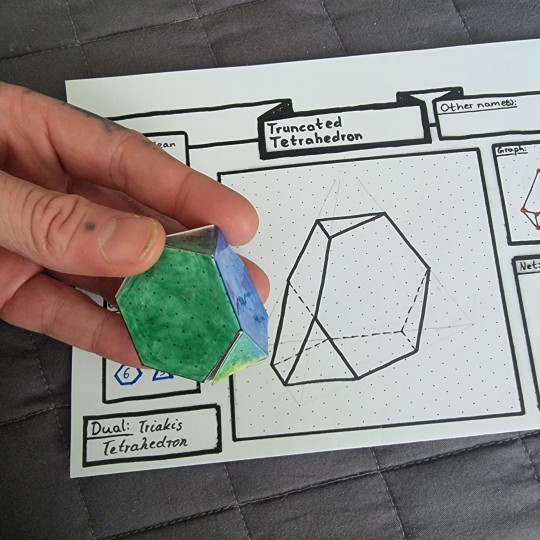
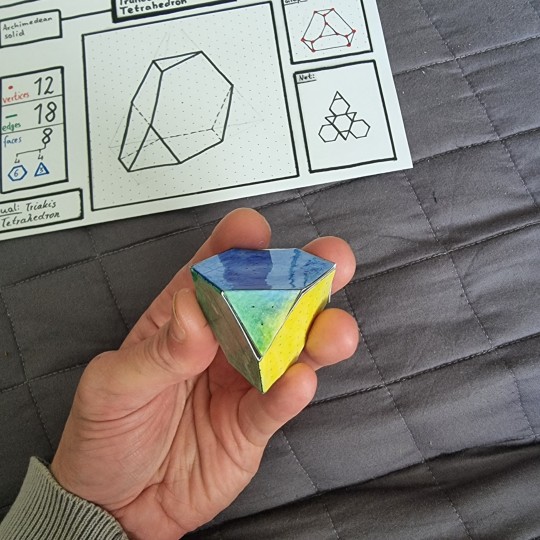
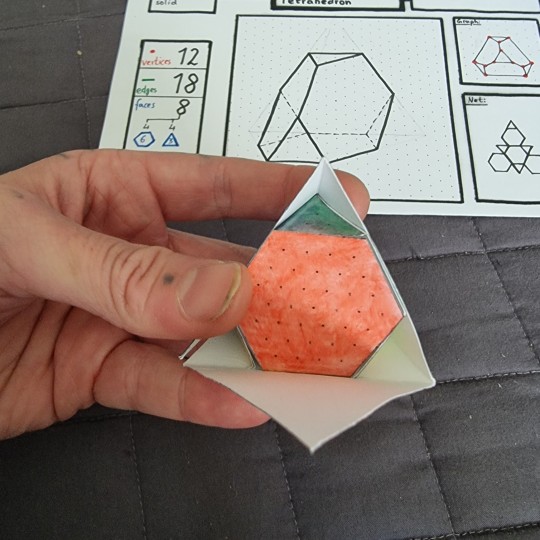
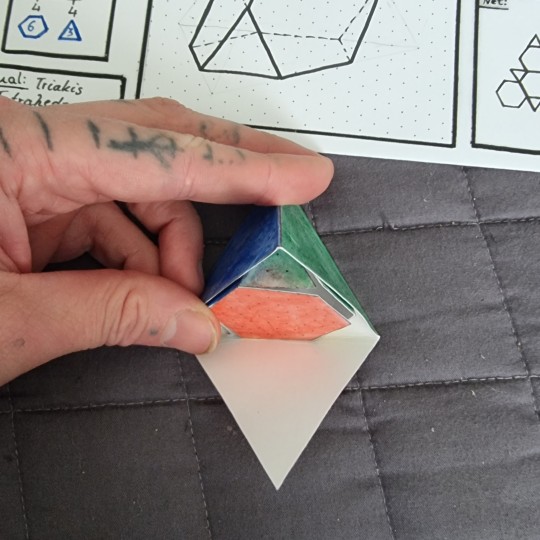
Colorful nets of Truncated Tetrahedron and Tetrahedron
#truncated tetrahedron#tetrahedron#polyhedron#polyhedron net#polyhedra#geometry#visualized math#math#mathematics#knottys math#archimedean solid#shapes and colors#shapes#shape soup
26 notes
·
View notes
Text

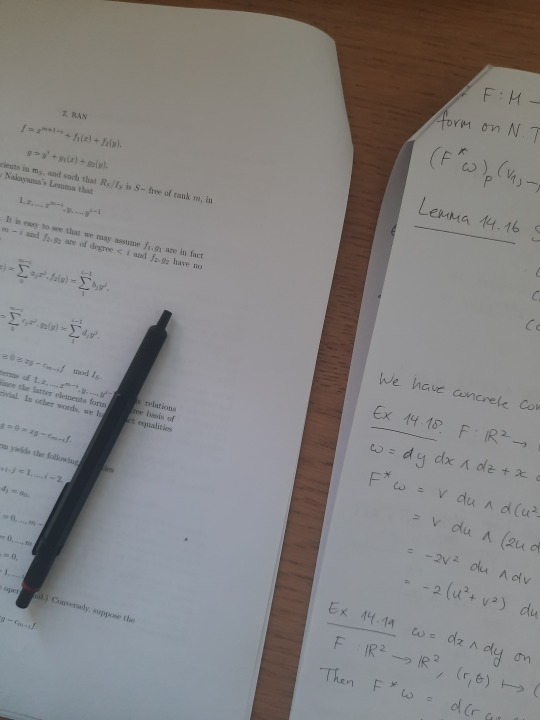
2025.05.05
A mess of notebooks and papers. I've taken to organizing them in multiple piles across my floor. Somewhere slowly functionality over aesthetics has taken over life. My various fragile and beautiful fountain pens swapped for a sturdy indestructible rotring 600 ballpoint. Beautifully kept notebooks exchanged for loose sheets of paper flouncing around. To some extent, I do miss the enforced slowness of the other tools. At the same time, I've always had an aesthetic obsession which has often been suffocating. It has been nice to let go.
#study#studyblr#studyspo#dark academia#studyinspo#mathblr#math student#stem student#stemblr#fountain pen#fountain pens#dark academia aesthetic#academia#handwriting#studystudystudy#uniblr#study aesthetic#uni student#stem#math#mathematics#langblr#da#da aesthetic#This actually ties into a reason I've been somewhat hesitant to return to tumblr. Though I'm aware textposts exist#I generally wonder what exactly this blog is without the associated imagery.#I don't feel much more for aesthetic studying visuals#whatever that may be exactly. But I don't know whether I care enough to really espouse my opinions continously#and I enjoy a very private life which inherently clashes with most of the content I would be interested in making#either way
96 notes
·
View notes
Text

The Painted Lady turned around slowly, deliberately, and stared right through each ghost present in the room. Then, she raised her hands in a graceful arc, pointed loosely at the ceiling, and chanted, “Well, off you go.” She made a shoo, go away gesture, the spirits disappeared, and—wait. The spirits disappeared.
Izumi comes back in For the Spirits Chapter VI: Dream of You. Zuko has a mild panic attack and her upbeat attitude does not help him (or does it?).
Just what is she up to? And what is the meaning behind the blue eyes from Zuko's dream?
#zutara#atla#zuko#avatar the last airbender#atla fanart#prince zuko#zutara au#atla art#for the spirits#Chapter VI: Dream of You#the painted lady#painted lady#atla izumi#izumi#Izumi of Jang Hui#atla zuko#zuko art#zuko fanart#spirit touched zuko#new gods au#atla fanfic#atla fic#zuko fanfic#book one zuko#The Painted Lady's outfit design changes every time I draw her lol. Let's chalk it up to spirit shenanigans and leave it there.#I'm so excited about this chapter! It's most probably one of the most visual chapters I've written so far.#I couldn't decide between drawing this particular scene or two more... So I did all three *insert evil cackle*#Izumi is in a good mood for the entire chapter. Zuko has a panic attack for the entire chapter. Do the math.#This particular interaction is a Big Moment for him. You'll see why soon enough (*cough* next chapter *cough*)#For all the Lu Ten fans out there. I have an announcement! Our dearest boy Ten Ten is coming back in the next chapter. Keep your eyes open!
372 notes
·
View notes
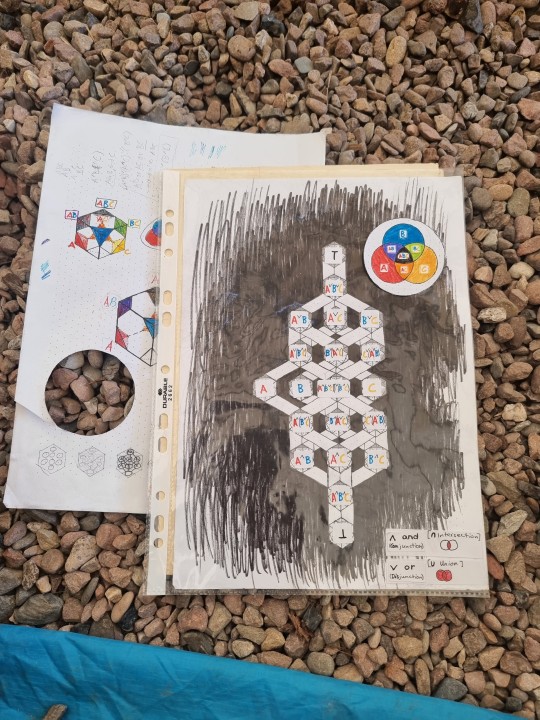
Text

I know I have drawn this shape so often already, but the process of drawing it is so soothing.
And for that, I have drawn a kind of step-by-step guide how to draw that shape in the top of this drawing:

(from left to right: ) [sorry in advance if I make it sound more complicated than it actually is. If you want to draw it, I would advice you to focus more on these illustrations rather than on my gibberish-text.]
1. draw a 2-dimensional Cartesian plane - or, in other words: just draw a cross like depicted
1.1. mark 2 points on the y-axis/vertical line with same distance to the coordinate origin, then mark 2 points on the x-axis/horizontal line with the same distance to the coordinate origin. (The markings on the y-axis need to be farther away from the origin than the markings of the x-axis)
2. connect the 4 marked points like depicted above. This is a function plot of a tractrix. (it has two mirror symmetry axes. )
3. draw an ellipse and connect the two markings on the x-axis. This becomes a kind of "belt" for the pseudosphere (4th picture)
4. part the ellipse into whatever-amount-you-want of partings (like you would cut a cake) and slightly mark these.
5. now imagine you cut that shape horizontally on the outer surface. (In the 5th picture I depicted that with red-ish pen across the pseudosphere. ) -
6. then the cut shape needs to be "(shape) shifted". For that we use a set of marked points we did in step 4). Furtherly, we "cut" the ellipse open, and push one end of it to the top, and the other end to the bottom. (depicted in picture 6 )
7. Then we connect the rest to get that shape:

#math#mathematics#art#math art#geometry#my art#dini surface#dini#curvature#constant negative curvature#pseudosphere#geometric visualization#visualization#visualisation#geometric#space#shapes#shape#shapeshifting#math drawing#geometry drawing#geometric drawing#mathy
165 notes
·
View notes
Text
the more time passes the more upset i am at the culmination of seasons 1 and 2 of arcane, like asdfghjkl what was even the point of any of the first season if that is how it all adds up????
#vasira rambles#i guess in the end arcane was still a league of legends adaptation (derogatory)#devastating#ily season 1 you will always be famous#and season 2 you had a lot of things going for you#mainly your visual presentation#pure excellence and a treat for the senses#but it's not adding up for me the math is not mathing
140 notes
·
View notes
Photo

#red#orange#colors#gif#art#peaceful#aes#colorful#color#math art#visual#aesthetic#colours#satisfying#beautiful#digital art#designs#colour#artists on tumblr#couleur#RGB#*d14#*pfn 0845 e0 sp1 r94#*c188.253.39.196.28.217#*mp9940.0017.0004#*tp6820.0004.0002
43 notes
·
View notes
Note
Hello, could you make a graham burns stimboard please? (If not it's ok)
Graham Burns [RB] Themed Stimboard 👓 ๋࣭⭑ with engineering / math / tech themes and green colored gifs


💾|👓|💾 📝| ★ |📝 💾|👓|💾 ★: divider center gif made by me :3 source: transformers rescue bots season 3 episode 7 graham is my favorite of the burns family :D
#bensboards#stimboard#visual stim#stim gifs#gifs#gif#maccadam#transformers#transformers rescue bots#rescue bots#tfrb#graham burns#tech#tech stim#math#math stim#pen#pen stim#glasses#glasses stim#green#green stim#stim
57 notes
·
View notes
Text
Making weekly progress graphs
All it took was one (1) person asking about it and I decided to make a post for how to make my progress graphs. Maybe I've done this before. I don't know. I'm doing it now.
For what I do, I use a spreadsheet. It's google docs right now, but I assume you can use anything because I'm not using anything unique to google docs.
You need at least 2 tabs. I have more than that, but let's start here.
Tab 1: Wordcounts
My first tab is called "WIP Progress". Here's what it looks like:

That's one line per WIP per day, if I work on it.
Month and Week are columns derived from the Date column using formulas.
Want the actual formulas? Month is "=concatenate(year(C2), ", ", month(C2))" and Week is "=concatenate(year(C2),", ", text(weeknum(C2-1), "00"))", at least in row 2.
Date column is the day you worked on it, hand entered.
Fic is a title per WIP. You should keep the title the same for each WIP because this will be used to track progress in graphs.
Detail is a note column, doesn't have to be unique. I use it to figure out working ideas and track parts of things. Like, parts 1 and 2 of the Prophetic D&D game are under the same Fic name with the actual title in the Detail column
Start wc is the number of words on that WIP at the start of the day
End wc is the number of words on that WIP at the end of the day
Total is a math formula that does the difference between Start wc and End wc. Literally just "=G2-F2"
And then every day, I add as many lines as things I'm working on and copy the formulas from a previous row and adjust them. So, for today, it looks like this:

Insert rows, copy, paste, change the dates, copy End wc to Start wc, and I'm ready to go.
How long have I been doing this? ...

A while.
More formula and some graphs behind the cut.
Tab 4: Last Week Progress
Let's skip to tab 4 because that's where my graphs come from. Tab 2 is "Progress by Day" and Tab 3 is "Progress by Week" but we'll come back to those if anyone is interested.

Okay, so the general idea is that it looks back 7 days and does a count of how many words, the average (ignoring 0s), and the counts per work per day. Then it graphs them. So how does this work?
Well, the top row is my constants:
Formula in F2: "=averageif($D3:$N10,"<>0")"
Formula in H2: "=MINIFs($D3:$N10, $D3:$N10, "<>0")"
Formula in J2: "=MAXIFS($D3:$N10, $D3:$N10, "<>0")"
The words "Word Documents" is in L2 because I use it in my unique filter. I used to keep track of my work writing but I didn't want it in this graph, so it's filtered out.
Rows 2 through 10 are my data rows. Here's what they look like:
A3: "=TODAY()", A4: "=A3-1", A5: "=A4-1". Follow that pattern as far back as you want to look.
B3: "=sumif('WIP Progress'!C:C,A3,'WIP Progress'!H:H)". Copy that down the column as far as you put down dates. That's give you your daily wordcount.
C3-C10: "=$F$1". Literally that's it. Just inserting the calculated average so that I can graph it nicey.
Tricky bit! D2 is a complicated formula. It looks like: "=transpose(sort(unique(filter('WIP Progress'!D:D, 'WIP Progress'!C:C>=today()-8,ARRAYFORMULA(if(not(exact('WIP Progress'!D:D, 'WIP Progress'!$D$1))*not(exact('WIP Progress'!D:D, $L$1)), True, false))))))"
EDIT! There's a better way that doesn't use ARRAYFORMULA. It's still a monster, but ARRAYFORMULA only works in google sheets. See my reblog of this post for an update:
... Yeah, that's a monster. What it's doing is taking the rows in my WIP Progress tab and filtering out anything that's not within the last 8 days. If you go back more than a week, change the number in the part that says ">=today()-8" to something higher. Then it also removed anything that matches my header row in WIP Progress, and also anything that matches my filter field ("Work Documents"). And then it takes all the unique values of what it finds, sorts them into alphabetical order, and transposes them so that they go in as column headers. This means the column headers change if I add more things to my daily wordcounts, and they stick around for the week.
Anyway, that's what determines the column headers for columns D through M. I've never written on more than 10 WIP in a week, so I've never needed more than that.
For cell D3, I have this formula: "=sumifs('WIP Progress'!$H$1:$H, 'WIP Progress'!$D$1:$D, D$2, 'WIP Progress'!$C$1:$C, $A3)". That is then copied and pasted into the rectangle of numbers there. Everything that needs to change will change, and everything that doesn't won't.
What's it do? Well, it matches the header of the column (D$2, E$2, F$2...) to the date on the lefthand side ($A3, $A4, $A5...) and then does a sum of the values for wordcount that match that column and that date. So if for some reason I have two entries for a WIP on the same date, it'll add them up.
Why would I have this? Sometimes I move stuff to a different document and start a new line with new start wc and end wc. It happens.
Okay, all the formulas are in! Now I have a bunch of numbers. How do I make a graph? This is easier through screenshots:

Go to Edit chart. Again, this is the googs, so if you're in Excel you'll have to look up how to do it differently.

In Setup, this is a Smooth line chart. The data range has the columns from my table above, with a little extra because I think maybe I started with 2 weeks worth. Whatever, extra is fine.
X-axis is Days, which is the first column. Then the series that get plotted are basically one of each column, except for Words because it threw things off.
Series view:

All the blank ones are on here because they don't show up if they've got no data. Well, technically they do but they're all at the 0 line so it just looks darker.
Also helpful:

Next, Customize the chart:

Mostly boring defaults, but here's the place to set the title.
And that's how the chart gets made. I have more charts than this, though...


So many more charts...
I'm willing to write more about them or help with formulas if anyone wants to know more.
#my writing#data visualization#someday i'll actually read that data viz book#i'm an amateur at this#charts and graphs#math
25 notes
·
View notes
Text
Third Dedekind number illustration/visualization - WIP
#dedekind number#math art#mathy art#wip#numbers#math#maths#mathematics#color#colors#knottys art#visualization#math visualization#visualized math#mathy stuffy
89 notes
·
View notes
Text


---
Gunthrie "Gunnie" Miggles-Rashbax Stimboard
The ball is stratospheric at this point.
Credits: x x x | x x x | x x x

#gilear's creations#stimblr#stimboard#visual stim#stimmy#stim#gif#gifs#gif warning#gunnie miggles rashbax#gunthrie miggles rashbax#a starstruck odyssey#d20 starstruck#dimension 20 starstruck#starstruck odyssey#maths#physics#calculator#calculations#tech#orange#white#green#black#steel#metal#computer#engineer#dimension 20#d20
21 notes
·
View notes
Text

Seamless Semi Turbulent Outlined Voronoi Cell Extrusions Monochrome Pattern ( Follow me on X )
#loop#seamless#visuals#trapcode#mir#after effects#motion#geometry#daily#artists on tumblr#grayscale#voronoi#math art#abstract#pattern#background#bright#black and white
22 notes
·
View notes
Text

1 art but no doodles! this is insanity! doodles are coming when i get back from the eye doctor
#🌐jack art#kevin spencer#art#digital art#this looks like ass but#actually nvm im tired of putting myself down im an amazing artist#lately i feel like my art style is making it more obvious that i started getting better at art after i started drawing family guy fanart#eh who cares i love family guy#also im almost done with my schoolwork! what a joyous occasion!#just gotta get my math done and my visual arts project... i hate visual arts. id rather fail that class than do the last project for it
30 notes
·
View notes
Text
"Visual proofs", more commonly known as "examples",
109 notes
·
View notes
Photo

#dark#design#abstract#gifs#gradient#aes#arte#art#aesthetics#color#colorful#colors#aesthetic#gif#digital art#cool#backgrounds#artists on tumblr#visual art#math art#HSL#*d53#*pfn 0665 e-e20 sp1 r50#*c28.181.0.43.163.255#*mp0003.0020.2000#*tp0000.0010.0000
46 notes
·
View notes
Note
I’m really impressed with your cat poses (especially action ones, like the fire moon) — they all look so natural! Do you have any advice for someone trying to better understand cat anatomy/how to draw without directly using a reference?
Thank you so much! I do try had to make the poses look good, so that means a lot :D
I unfortunately don't really have much advice besides the usual 'study how cats move' and 'practice practice practice' :') My only tip is to really try to envision the weight and momentum of the character, kind of like you would if you were animating. Imagine how your character would be moving one second before and after the pose you're going for. In general, I find animation tips really help you learn how to illustrate more fluid and dynamic poses! It's a bit abstract, but I hope that at least helps a little :'D

AWH haha, I love that :'D Puddle very much splits the room, it's so fun to see everyone's reactions to him. Personally I just find him so charming and silly and mysterious, but I may be a little biased too haha
#chitchat#ask#i am so sorry if my advice is a little abstract with this one lol i do all my 'math' in my silly little noggin#and admittedly i visualize things so so vividly in my head so im sorry if this advice isn't all that aphantasia friendly :')
44 notes
·
View notes
Note
hey Goofy Math Soviet, what is calculus?
legit, it wasn't necessary for graduation at my school so i never took the class
Basically, it deals with integrals and derivatives, which is tough to explain but I can try.
Remember in earlier math you learned about slope? You know, y=mx + b? If you don’t recall, a slope is basically how steep a line is. Now if you’re looking at a straight line, then it’s pretty easy to determine the slope. Just look at how steep the line in question is and boom. There ya go.
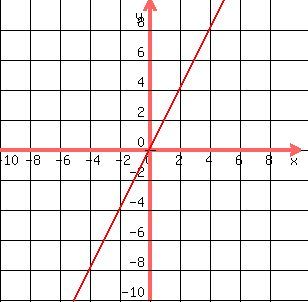
For example take this red line up here. Every time it moves to the right by 1, it moves up 2 and vice versa. So this line has a slope of 2. Simple, right?
But what if we have a line that isn’t as straightforward? Like this curvy boy down here

What’s the slope of this line? A little tougher because how steep the line is different depending on where you are on the line.
That’s where derivatives come in. A Derivative will tell you what the slope of a line is at a given point in time. For example, at the dead center of the graph, the curvy boy has a slope of zero (since it’s flat right there). Once it hits the first square to the right it’s already reached a slope of 2. And at the second square, it’s reached a slope of 4!
How do I know this? Well because I have played you! The red line we looked at earlier is actually a graph of the derivative for the curvy line! So you can use that one to determine how steep the curve is at any given point! So like at -2, the slope is -4, etc.
Integrals are simiar, but in reverse, where you take a look at a derivative and draw out what the original would look like.
I’m being super reductive right now for obvious reasons but thats the bread and butter of calculus. You can do some really really wacky things especially with integrals and as you get further into calculus you use detivatives and integrals to do some dark magic. It’s pretty neat.
Hope this helped!
#math stuff#long post#also most people learn by doing stuff like dy/dx first but#this is tumblr. im not gonna do all that mess#the visual example seems to help a lot#i know it helped me
161 notes
·
View notes