#Data Sequencing
Explore tagged Tumblr posts
Visit Tumblr Blog
Explore Tumblr blogs with no restrictions, modern design and the best experience.
Last Seen Tumblr Blogs


Fun Fact
In 2020, 27% of US Tumblr users had an annual household income of over $100,000.
Text
AI Data learning and Data management:
Learning and Integration of predictive algorithms for information subsequent subsets, data storage and advanced AI learning:
Sure, here are some of the algorithms I am using in my project: Linear regression: This is a statistical method used to model the relationship between a dependent variable and one or more independent variables. The equation for linear regression is as follows: y = β0 + β1x1 + β2x2 + … + βnxn where y is the dependent variable, x1, x2, …, xn are the independent variables, and β0, β1, β2, …, βn are the coefficients of the model.
Support Vector Machines (SVM): SVM is a supervised learning algorithm that can be used for both classification and regression tasks. The algorithm works by finding the hyperplane that best separates the data points in the dataset. The equation for SVM is as follows: y = f(x) = w^T x + b where w is the weight vector, x is the input vector, and b is the bias term.
Decision Trees: Decision trees are a type of supervised learning algorithm that can be used for classification and regression tasks. The algorithm works by splitting the dataset into subsets based on the values of the features, and then it creates a tree-like structure that maps the decisions that need to be made to reach the desired outcome. The equation for decision trees is as follows: y = f(x) = w1x1 + w2x2 + … + wnxn where y is the outcome, w1, w2, …, wn are the weights, and x1, x2, …, xn are the features.
Naive Bayes: Naive Bayes is a probabilistic classification algorithm that is based on Bayes' theorem. The algorithm works by assuming that the features are conditionally independent, which means that the value of one feature does not depend on the value of any other feature. The equation for Naive Bayes is as follows: P(y|x) = P(x|y)P(y)/P(x) where P(y|x) is the probability of y given x, P(x|y) is the probability of x given y, P(y) is the prior probability of y, and P(x) is the marginal probability of x.
K-Nearest Neighbors (KNN): KNN is a non-parametric classification algorithm that works by finding the k closest neighbors of a point in the dataset and using their labels to predict the label of the point. The equation for KNN is as follows: y = f(x) = 1/k * (w1y1 + w2y2 + … + wkyk) where y is the predicted label, k is the number of neighbors, w1, w2, …, wk are the weights, and y1, y2, …, yk are the labels of the k closest neighbors.
Random Forest: Random Forest is an ensemble learning algorithm that combines multiple decision trees to create a more accurate and robust model. The algorithm works by creating multiple decision trees, each with a random subset of the features, and then using the majority vote of the trees to make a prediction. The equation for Random Forest is as follows: y = f(x) = 1/n * (f1(x) + f2(x) + … + fn(x)) where y is the predicted label, n is the number of trees, and f1, f2, …, fn are the individual decision trees.
Neural Networks: Neural networks are a type of artificial intelligence that is inspired by the structure and function of the human brain. The algorithm works by using a network of interconnected nodes, or neurons, to process input data and make predictions. The equation for neural networks is as follows: y = f(x) = w1 * f(w2x1 + w3x2 + … + wnxn) + b where y is the predicted label, w1, w2, …, wn are the weights, x1, x2, …, xn are the input features, and b is the bias term.
#datastorage#DataManagment#Data Sequencing#Data Filing#datascience#Algorithms#playstation7#deardearestbrands#ps7#digitalconsole#framework#python#soundcloud#celestiallink#algorithms suck#youtube#deardearestbrandswordpress#DEARDEARESTBRANDS
0 notes
Text
Looking up the different routes on the deltarune wiki and... yeeaa I would have never discovered the snowgrave route on my own.
#dragon's stupid thoughts#there's soooo much stuff I've missed#and i hate looking such playthroughs up cuz they are spoiling so much for me#i was backtracking so much in chapter 2 but apparently not enough and not correctly#ughhhh so close and yet so far away#i just didn't get the clues#and if i understand the wiki right... there are two ways to fight spamton neo?#gotta have to read into that again#idk how his battle is gonna be but god I'm excited for it#also because it has a banger theme#side fact. NOW'S YOUR CHANCE TO BE A is actually my fav ost from the game. so far. with It's TV Time being a close second. obviously...#i gotta have to be so careful in this run to not make any mistakes and see all the stuff people randomly found but i did not#like. apparently you can battle mike?????#UGH I'M MISSING SO MUCH STUFF#also what I just noticed. in the chapter selection screen there's a little 4x3 field which is either rectangles or triangles#this probably hints to Secrets being found?#because yesterday I only had two and today it were four. Hm#all that aside. something i always thought is that gaster is. like. just a data mined unused/rejected(?) file? like a left over?#but apparently he is in undertale? is he in deltarune too??? never got this guys deal#after my undertale phase i couldn't really like the skeletons anymore. for reason I'd rather keep unknown#and damn man. dr made me dislike sans and toriel so much. ESPECIALLY after chapter 4. god that sequence fucks me up up#augh too much talk#I'll change this into a new dragon is gaming post thread cuz the other is becoming too long. for my taste
21 notes
·
View notes
Text
the mutants i’ve spent 30 hours on in lab were a success !!!!
49 notes
·
View notes
Text
idk it's such a very small thing but "maybe you killed her with renju." "don't be ridiculous!" is very cool very epic i think. credit to both voice actors bc i believe that, their whole past and future entanglements aside, hitomi just fucking despised date for a second there to be honest
#like typed out in plain text its there but its kind of whatever its an interrogation sequence but when ur there everything really sells it#date has a level of empathy that allows him to be very sensitive and kind and intuit what people need from him emotionally.#naturally. on the other hand it gives him an ability to be uniquely aggressive and cruel. sometimes he's just nasty and awful.#similar vibes to him getting up and circling 'iris' like a vulture to intimidate her in that sequence when he's not getting what he wants#Woof creeps me out#im just delighted at hitomi snapping back at him spit in that mans face#im gonna Get You#aitsf#ai the somnium files#aitsf spoilers#hitomi sagan#kaname date#part of the duality with aiba (in ai1 anyway) is she can be inadvertently unkind due to inherent gaps in her logic and reliance on data#date is very good at empathising and guessing at vibes reading cues without even thinking to do it. but he's cruel on purpose
39 notes
·
View notes
Text


Once I had enough high-resolution climate data to work with, the final part of the Climate phase was the creation of maps with discrete climate zones, which I produced in both the Trewartha classification scheme, left, and the Köppen classification scheme, right.

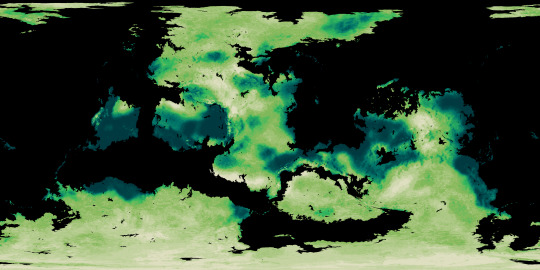

The final phase of the Ayrum mapmaking project was to create realistic satellite style maps, which began with mapping out soil colors and the ground cover of vegetation generally and tree-analogues specifically.
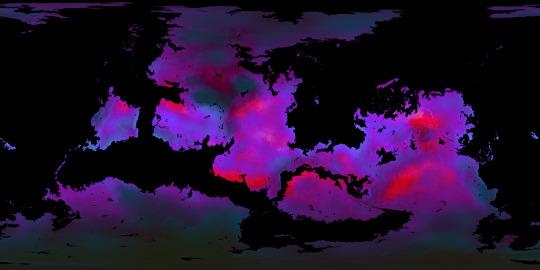
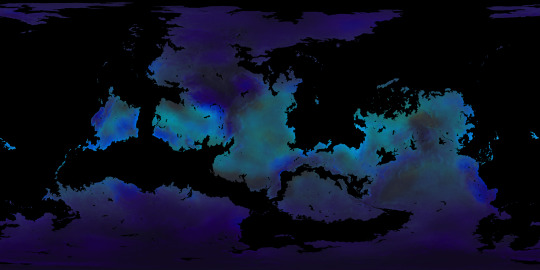
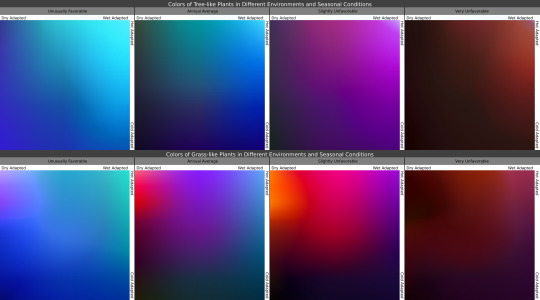
Once I knew where the plants belonged, I then determined what colors they'd be in the conditions they're adapted for, as seen in the maps, and under seasonal variation, with the chart showing how plants with certain adaptations react to seasonal changes in those conditions.

In these gifs we see the ground plants and tree canopies changing colors as the Solstices and Equinoxes expose them to greater or lesser rainfall and harsher or milder temperatures than what they're adapted for. Neither of these gifs provide a true image of what the surface looks like from space, but rather of the in-person appearance of whatever plants may be present.

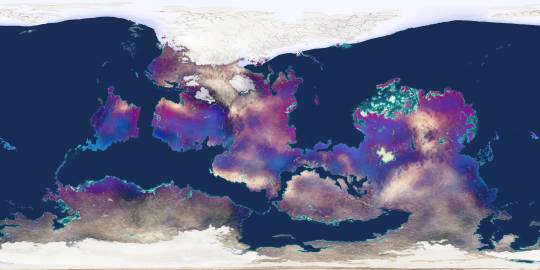
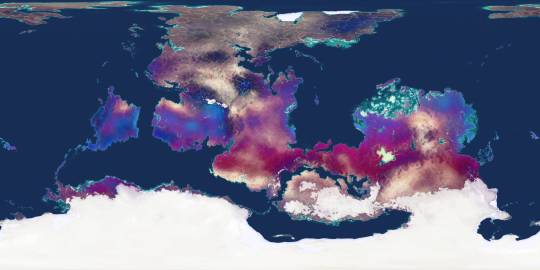
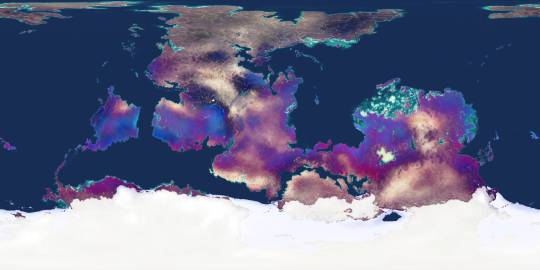
Finally, using the vegetation density maps as raster masks for the seasonal plant color maps, and layering those with the snow-and-ice maps over the soil color map, we now have a much truer image of Ayrum's surface as of its (Northern) Winter, Spring, Summer, and Autumn months.
#Ayrum#mapmaking#digital painting#imaginary maps#imaginary climate zone maps#Trewartha climate scheme#Koppen climage scheme#worldbuilding#commission#major project#seasonal data sequence#imaginary soil color maps#imaginary vegetation maps#vegetation extent#vegetation color#satellite-style maps#Photopea#Christopher Maida Artwork
54 notes
·
View notes
Text
the absolute fucking letdown when youre excited af about something cool you found that pertains to your interests—thats like a gold mine or candy shop for you—and you try to share it with other people so they can enjoy it too, only to be met with disinterest or feeble attempts at feigning interest
#pls i just want someone to be excited about this website i found#i love neuroscience and granted im studying reptiles as the main thing#but i just found the allen institute website last night#and it has everything i could ever want#the brain maps#the cell types#the circuits#the data used for calculations and to create this thing#it has subheadings under the main titles#you can go to the anatomy atlas for humans or mice#learn about the individual cell types#find where those cells are located on the brain map#theres even one about alzheimers#theres gene sequencing#things about autism#dementia#schizophrenia#glioblastoma#tbi#neurotransmitters#microscopy#imaging#pls somebody share my excitement about this
16 notes
·
View notes
Text
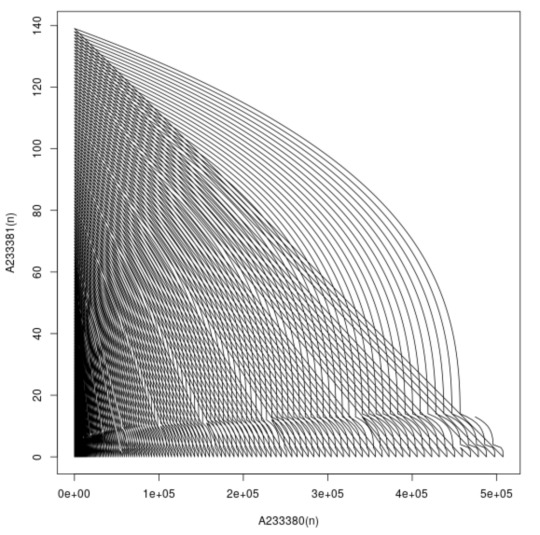
A233380 vs A233381
#math#sequence#numbers#graph#plot#data#data visualization#web#webcore#old web#weirdcore#cybercore#glitchcore#old internet#internetcore
3 notes
·
View notes
Text
man. not me finding out that my finger placement is all wrong even though im capable of touch typing up to 100 wpm
#im suspecting incorrect placement for being the reason that it is difficult for me to do sequences#that alternate between numbers and letters very quickly#yknow. something thats important for data entry#im thinking it may also have to do with how i place my hands on the keyboard.....#the 'correct' placement feels unnatural and like i have to stretch#so i have to assume besides lack of practice that my resting position on the keyboard is also wrong LMAO#i never actually got Taught how to touch type i think. i think i just typed so much that muscle memory told me where everything is
9 notes
·
View notes
Text
THANK YOU NIH BLAST TOOL FOR SAVING MY LIFE???
#incredible website you plug in a dna sequence and it gives you the corresponding ones out of a data library#I THOUGHT I WOULD HAVE TO TRASNCRIBE IT BY HAND#julia.txt
2 notes
·
View notes
Text
star trek generations is. uh. not that good
#cool crash sequence though#but damn what a weird movie#the subplot about Data's emotion chip was so tonally jarring#the way the Enterprise crashed made no sense to me#Lursa and B'Etor were actually pretty superfluous and it's weird that they included them just to kill them off#speaking of superfluous Beverly had nothing to do and neither did several other characters#I think it's weird that both Picard and Kirk were married to random women in the Nexus as opposed to any of their canon love interests#and don't get me started on Kirk's Nexus actually#I have a lot of thoughts about it (mostly concerning Spock's absence) and none of them are good#anyway what a weird movie. truly felt like a mediocre two-parter with some flashy special effects#I guess this is the price we pay for getting such a good series finale in “All Good Things”#anyway#star trek generations spoilers#(in case any of you are still avoiding spoilers for a movie that came out...#*checks notes*#nearly 31 years ago)
2 notes
·
View notes
Text
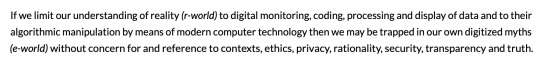
modern day '"we tell ourselves stories in order to live" in the international journal of computer auditing
#'trapped in our own digitized myths' is such a wonderful sequence of words#ref#big data ideology#articles
5 notes
·
View notes
Text
MY SEQUENCES
#god am i a fucking nerd. im excited everytims i get an email notification because it might be my sequencing data#PLEASE PSOMAGEN MY SEQUENCES
2 notes
·
View notes
Text
The next phase of the Ayrum project was climate, which I'll introduce with the resource that made my work possible in the first place: these datasets created by Nikolai Lofving Hersfeldt, who runs WorldBuildingPasta and shared all of this with my client and me via Panoply. These were tremendously helpful and I wouldn't be able to achieve a fraction of the final detail without them.

My own adjustment to this data begins with Surface Temperature, which came down to correcting the coastlines (I mistakenly sent in a version of the elevation map that resulted in continental shelves appearing above sea level), refining the effects of elevation, and adding a color gradient.

I was then able to combine this data into Annual Minimum, Average, and Maximum temperature maps, seen above, which was pretty useful too.
One use for the Annual Average map, for example, was providing a baseline to compare each month's data against, seen in the sequence above.

And from the Annual Minimum and Maximum maps, I was able to create a map that presents the overall range of temperatures throughout the year, which does a good job of showing just how extreme the conditions are in higher latitudes and further inland.
#digital painting#imaginary climate maps#mapmaking#imaginary maps#Ayrum#Photopea#worldbuilding#commission#long term project#Surface Temperature maps#monthly data sequence#WorldBuildingPasta#Panoply#Christopher Maida Artwork
33 notes
·
View notes
Text
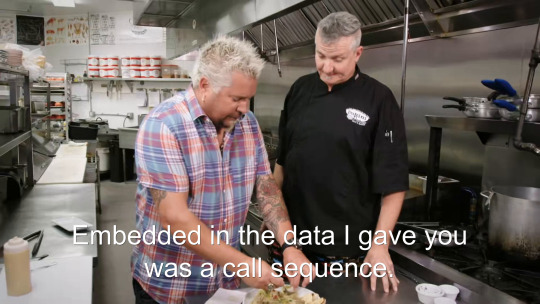
[Embedded in the data I gave you was a call sequence.]
8 notes
·
View notes
Text
i don't even want to take half my classes that im registered for autumn quarter

#this is just me spitballing here -#definitely need to take the security related classes that i want to do and even if i did dogshit at databases i still want to take the next#-class in the series bc i heard its more programming#also maybe the instructor won't suck that was a huge part of it#and im dropping data science im sorry i can't do algos i can't do machine learning. fuck cs theory im not into that.#but the question now is - do systems (which would give me a leg up in the security track) or do animation capstone (which is cool)#downside of systems is that theyre some of the hardest programming classes and i have to do group projects#downside of animation is that i missed the ball on most of the stuff and its a lot of classes in a sequence. also group projects.#(or neither and fuck off and do the global health minor or take english/art/architecture/philosophy classes just for fun idfk)#the stem major's curse#the last humanities option is looking nice rn maybe i can also take a bunch of public health stuff too#i actually kind of want to enjoy college even if im a commuter with no friends#hm ok i will go look for some classes later today#the data science stuff really screwed me over im glad im free of that at least#milk (normal)#i am kind of the ''mid at everything'' guy so no specialization for me or else i get bored and start attacking myself with hammers#and i change my mind about who i am and my personality every few months so thats really fun to deal with.
7 notes
·
View notes
Text
Episode 131: Rick Berman Is Made of Lies
TNG: "Gambit" and "Phantasms"
Season 7 of TNG leaves your hosts cold again this week, tho opinions are divided over what's worse. First up: something we might be seeing more of as Picard tussles with smugglers in "Gambit", parts 1 and 2. After that, more Data dreams may tie into a malfunctioning warp core in "Phantasms".
Also this week: Worf puns, a Voyager tangent, and the tables are turned on Gordo.
Timestamps: Gambit: 3:20; Phantasms: 42:59
#star trek#star trek podcast#podcast#the next generation#star trek tng#gambit#phantasms#jean luc picard#william riker#data#worf#geordi la forge#deanna troi#beverly crusher#vulcans#pirates#dream sequence#dreams#SoundCloud
0 notes