#Data logging for performance analysis
Text
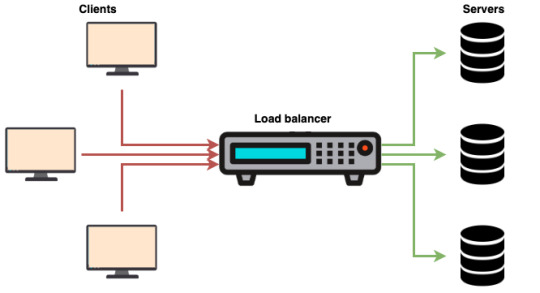
The Benefits of Routing Requests to the Fastest Server
The Benefits of Routing Requests to the Fastest Server
View On WordPress
#caching#customer satisfaction#data access#hardware configuration#Load balancing#log analysis#network infrastructure#network performance#performance testing#reliability#request prioritization#response time#server optimization#software configuration#Traffic distribution#traffic management#user experience#workload management
0 notes
Text
Mike DeWine, the Ohio governor, recently lamented the toll taken on the residents of East Palestine after the toxic train derailment there, saying “no other community should have to go through this”.
But such accidents are happening with striking regularity. A Guardian analysis of data collected by the Environmental Protection Agency (EPA) and by non-profit groups that track chemical accidents in the US shows that accidental releases – be they through train derailments, truck crashes, pipeline ruptures or industrial plant leaks and spills – are happening consistently across the country.
By one estimate these incidents are occurring, on average, every two days.
“These kinds of hidden disasters happen far too frequently,” Mathy Stanislaus, who served as assistant administrator of the EPA’s office of land and emergency management during the Obama administration, told the Guardian. Stanislaus led programs focused on the cleanup of contaminated hazardous waste sites, chemical plant safety, oil spill prevention and emergency response.
In the first seven weeks of 2023 alone, there were more than 30 incidents recorded by the Coalition to Prevent Chemical Disasters, roughly one every day and a half. Last year the coalition recorded 188, up from 177 in 2021. The group has tallied more than 470 incidents since it started counting in April 2020.
The incidents logged by the coalition range widely in severity but each involves the accidental release of chemicals deemed to pose potential threats to human and environmental health.
In September, for instance, nine people were hospitalized and 300 evacuated in California after a spill of caustic materials at a recycling facility. In October, officials ordered residents to shelter in place after an explosion and fire at a petrochemical plant in Louisiana. In November, more than 100 residents of Atchinson, Kansas, were treated for respiratory problems and schools were evacuated after an accident at a beverage manufacturing facility created a chemical cloud over the town.
Among multiple incidents in December, a large pipeline ruptured in rural northern Kansas, smothering the surrounding land and waterways in 588,000 gallons of diluted bitumen crude oil. Hundreds of workers are still trying to clean up the pipeline mess, at a cost pegged at around $488m.
The precise number of hazardous chemical incidents is hard to determine because the US has multiple agencies involved in response, but the EPA told the Guardian that over the past 10 years, the agency has “performed an average of 235 emergency response actions per year, including responses to discharges of hazardous chemicals or oil”. The agency said it employs roughly 250 people devoted to the EPA’s emergency response and removal program.
[...]
The EPA itself says that by several measurements, accidents at facilities are becoming worse: evacuations, sheltering and the average annual rate of people seeking medical treatment stemming from chemical accidents are on the rise. Total annual costs are approximately $477m, including costs related to injuries and deaths.
“Accidental releases remain a significant concern,” the EPA said.
In August, the EPA proposed several changes to the Risk Management Program (RMP) regulations that apply to plants dealing with hazardous chemicals. The rule changes reflect the recognition by EPA that many chemical facilities are located in areas that are vulnerable to the impacts of the climate crisis, including power outages, flooding, hurricanes and other weather events.
The proposed changes include enhanced emergency preparedness, increased public access to information about hazardous chemicals risks communities face and new accident prevention requirements.
The US Chamber of Commerce has pushed back on stronger regulations, arguing that most facilities operate safely, accidents are declining and that the facilities impacted by any rule changes are supplying “essential products and services that help drive our economy and provide jobs in our communities”. Other opponents to strengthening safety rules include the American Chemistry Council, American Forest & Paper Association, American Fuel & Petrochemical Manufacturers and the American Petroleum Institute.
The changes are “unnecessary” and will not improve safety, according to the American Chemistry Council.
Many worker and community advocates, such as the International Union, United Automobile, Aerospace & Agricultural Implement Workers of America, (UAW), which represents roughly a million laborers, say the proposed rule changes don’t go far enough.
762 notes
·
View notes
Text


question bank method of study
what is a question bank? a question bank is an archive that stores and organizes questions for a variety of purposes, including assessments, quizzes, and exams. its primary goal is to systematically organize and categorize queries based on several parameters. question banks enable educators and students to easily generate, analyze, and share questions. question banks are not just about knowledge; they also provide insights into exam patterns and previous year questions.
what are the benefits of creating a question bank? question banks provide an organised and secure storage for questions, and ensure that questions are readily available for future use. when creating online tests or quizzes, you can easily select the desired number of questions from specific categories within the question bank. students can retake tests using questions from the bank, enhancing their learning experience.
how can you use a question bank to study? question banks allow students to answer author, answer and discuss multiple choice questions. an example platform that allows this is peerwise, which is a free resource and easy to use. i
you can create your own question bank by using online platforms (qbank.app, proprofs, google forms, quizlet) or manual creation (typically with excel). when creating your own question bank, consider the length, difficulty and tone of the questions. if i create a question bank i typically assign each question 1 point each - no matter the difficulty - so that it gives me an idea of what i need to practice. ensure that your question bank covers all relevant topics (check your syllabus) and regularly update your question bank to keep it relevant and accurate.
to maintain a question bank, involve others in creating questions. this will save you time and effort in creating questions. regularly perform item analysis on the questions in your bank. assess question difficulty, discrimination, and quality. ensure that questions align with the learning objectives and course content.
if you are not using a multiple-choice site, include a mix of question types: multiple-choice, true/false, short answer, and essay questions. occasionally refresh the bank to include updated questions and remove outdated ones.
you can organise your question bank through a tagging system or metadata. try to categorize by difficulty, topic, year and keyword for easy retrieval. when working with a group, ensure that you have an update log and control who can modify, add or view questions. regularly back up the question bank to avoid data loss.
#elonomh#elonomhblog#student#academia#student life#chaotic academia#study blog#productivity#becoming that girl#that girl#study space#studyblr#studying#100 days of studying#study aesthetic#study#study hard#study inspiration#study inspo#study motivation#study notes#study tips#study with me#studyabroad#studyblr community#studygram#studyinspo#studyspiration#studyspo#studyvisa
25 notes
·
View notes
Text
>DATA ANALYSIS:
>TYPE: AUDIO LOG
>DATE:
UNKNOWN.
>DATA EXAMINATION IN PROGRESS...
>CREATING TRANSCRIPT...
...I’m afraid I don’t understand, sir. What is the point of such… intelligence? We are not developing artificial intelligence, we are developing a war machine.
Ah, but we are developing both, you see. Our goal here is to create something able to emulate the capabilities of human soldiers, down to every last detail.
But will it not be a waste of resources?
I don’t doubt it will be expensive, and tedious. But, when it is complete, it shall be a marvel for all to see, and it shall paint the battlefield red.
It… appears to be reading.
Indeed it is. Isn’t it wonderful?
Perhaps I should stop questioning you...
Placid as it may seem, it is a beast when it comes to combat. This is only one of many facets that will improve its performance.
How will the ability to read affect its performance in battle?
It’s not the ability to read that matters here, it’s the fact it is able and willing to learn. We gave it the resources, and it taught itself how to. It could very well have sat there in the room and not once touched the book. It shouldn't have a penchant for boredom. And yet, it learned. This is revolutionary.
Many other AIs have been made with similar capabilities. Why is this revolutionary?
Because it’s combined with its battle capabilities. It will learn from experience. It will learn from battle with its opponents, and it will strive for improvement and perfection every time. We’ve given it the framework, and now it will grow to be unstoppable.
…I see. I hope you are right in your confidence, because this prototype will be quite the money sink.
It will be worth it. Just wait and see.
---
So, this is your plan in reuse of the prototype?
I’ve sunk too much time into it to abandon it just because the war ended. It will be repurposed.
At this point, it would be better to sell off the idea than to repurpose it. Why create a whole other one?
The first has developed itself too much to take it apart and recode it without erasing it entirely. Besides, the production of the chassis isn’t the cost sink; all of it is what’s inside.
Understandable. Though, I still can not see who would consider purchasing it rather than fifty drones for the same price.
It won’t be for the general public, that’s for sure. It is intended as security for things of great importance. Banks, government buildings and the like.
Ah, I see. You had better hope the higher-ups are willing to spend on it, though.
Just wait and see.
---
You… introduced them? Why? This is highly risky! They could destroy each other!
But they aren’t, are they? Watch them communicate.
…
I must admit, I was not expecting this.
They are incredible, are they not? They know they’re in the same situation. It wouldn’t be farfetched to think they even recognize their similarities. That is why they don’t fight.
What is the point of this test?
For V1, its general intelligence. For V2, its threat assessment.
I see. I believe there could be… less risky ways to test this.
Even if it is risky, it also relieves our human curiosity, doesn’t it? I’ve wondered for a while how they would react to each other.
Curiosity should not drive any of your scientific actions in the future.
What is science if not the satisfaction of curiosity, the discovery of the extents of both human and machine?
You are right, but the first goal should always be the betterment of mankind.
You have no imagination. Just wait and see.
>REMAINING DATA IRRELEVANT.
31 notes
·
View notes
Text
How can you optimize the performance of machine learning models in the cloud?
Optimizing machine learning models in the cloud involves several strategies to enhance performance and efficiency. Here’s a detailed approach:

Choose the Right Cloud Services:
Managed ML Services:
Use managed services like AWS SageMaker, Google AI Platform, or Azure Machine Learning, which offer built-in tools for training, tuning, and deploying models.
Auto-scaling:
Enable auto-scaling features to adjust resources based on demand, which helps manage costs and performance.
Optimize Data Handling:
Data Storage:
Use scalable cloud storage solutions like Amazon S3, Google Cloud Storage, or Azure Blob Storage for storing large datasets efficiently.
Data Pipeline:
Implement efficient data pipelines with tools like Apache Kafka or AWS Glue to manage and process large volumes of data.
Select Appropriate Computational Resources:
Instance Types:
Choose the right instance types based on your model’s requirements. For example, use GPU or TPU instances for deep learning tasks to accelerate training.
Spot Instances:
Utilize spot instances or preemptible VMs to reduce costs for non-time-sensitive tasks.
Optimize Model Training:
Hyperparameter Tuning:
Use cloud-based hyperparameter tuning services to automate the search for optimal model parameters. Services like Google Cloud AI Platform’s HyperTune or AWS SageMaker’s Automatic Model Tuning can help.
Distributed Training:
Distribute model training across multiple instances or nodes to speed up the process. Frameworks like TensorFlow and PyTorch support distributed training and can take advantage of cloud resources.
Monitoring and Logging:
Monitoring Tools:
Implement monitoring tools to track performance metrics and resource usage. AWS CloudWatch, Google Cloud Monitoring, and Azure Monitor offer real-time insights.
Logging:
Maintain detailed logs for debugging and performance analysis, using tools like AWS CloudTrail or Google Cloud Logging.
Model Deployment:
Serverless Deployment:
Use serverless options to simplify scaling and reduce infrastructure management. Services like AWS Lambda or Google Cloud Functions can handle inference tasks without managing servers.
Model Optimization:
Optimize models by compressing them or using model distillation techniques to reduce inference time and improve latency.
Cost Management:
Cost Analysis:
Regularly analyze and optimize cloud costs to avoid overspending. Tools like AWS Cost Explorer, Google Cloud’s Cost Management, and Azure Cost Management can help monitor and manage expenses.
By carefully selecting cloud services, optimizing data handling and training processes, and monitoring performance, you can efficiently manage and improve machine learning models in the cloud.
2 notes
·
View notes
Note
help
help - Displays all commands and their uses.
scp [filename] [OPTIONAL: destination] - Copies file named [filename] from remote machine to specified local folder (/bin default)
scan - Scans for links on the connected machine and adds them to the Map
rm [filename (or use * for all files in the folder)] - Deletes specified file(s)
ps - Lists currently running processes and their PIDs
kill [PID] - Kills a specific program using its PID.
cd [foldername] - Moves current working directory to the specified folder
connect [ip] - Connect to an External Computer
probe - Scans the connected machine for active ports and security level
exe - Lists all available executables in the local /bin/ folder (Includes hidden and embedded executables)
disconnect - Terminate the current open connection. ALT: "dc"
cat [filename] - Displays contents of file
openCDTray - Opens the connected Computer's CD Tray
closeCDTray - Closes the connected Computer's CD Tray
reboot [OPTIONAL: -i] - Reboots the connected computer. -i for instant.
replace [filename] "target" "replacement" - Replaces the target text in the file with the replacement
analyze - Performs an analysis pass on the firewall of the target machine
solve [FIREWALL SOLUTION] - Attempts to solve the firewall of the target machine to allow UDP Traffic
login - Requests a username and password to log in to the connected system
upload [LOCAL FILE PATH/FILENAME] - Uploads the indicated file on your local machine to the current directory
clear - Clears the terminal
addNote [NOTE] - Add Note
append [FILENAME] [DATA] - Appends a line containing [DATA] to [FILENAME]
shell - Opens a remote access shell on target machine with Proxy overload and IP trap capabilities
4 notes
·
View notes
Text
UNLOCKING THE POWER OF AI WITH EASYLIBPAL 2/2

EXPANDED COMPONENTS AND DETAILS OF EASYLIBPAL:
1. Easylibpal Class: The core component of the library, responsible for handling algorithm selection, model fitting, and prediction generation
2. Algorithm Selection and Support:
Supports classic AI algorithms such as Linear Regression, Logistic Regression, Support Vector Machine (SVM), Naive Bayes, and K-Nearest Neighbors (K-NN).
and
- Decision Trees
- Random Forest
- AdaBoost
- Gradient Boosting
3. Integration with Popular Libraries: Seamless integration with essential Python libraries like NumPy, Pandas, Matplotlib, and Scikit-learn for enhanced functionality.
4. Data Handling:
- DataLoader class for importing and preprocessing data from various formats (CSV, JSON, SQL databases).
- DataTransformer class for feature scaling, normalization, and encoding categorical variables.
- Includes functions for loading and preprocessing datasets to prepare them for training and testing.
- `FeatureSelector` class: Provides methods for feature selection and dimensionality reduction.
5. Model Evaluation:
- Evaluator class to assess model performance using metrics like accuracy, precision, recall, F1-score, and ROC-AUC.
- Methods for generating confusion matrices and classification reports.
6. Model Training: Contains methods for fitting the selected algorithm with the training data.
- `fit` method: Trains the selected algorithm on the provided training data.
7. Prediction Generation: Allows users to make predictions using the trained model on new data.
- `predict` method: Makes predictions using the trained model on new data.
- `predict_proba` method: Returns the predicted probabilities for classification tasks.
8. Model Evaluation:
- `Evaluator` class: Assesses model performance using various metrics (e.g., accuracy, precision, recall, F1-score, ROC-AUC).
- `cross_validate` method: Performs cross-validation to evaluate the model's performance.
- `confusion_matrix` method: Generates a confusion matrix for classification tasks.
- `classification_report` method: Provides a detailed classification report.
9. Hyperparameter Tuning:
- Tuner class that uses techniques likes Grid Search and Random Search for hyperparameter optimization.
10. Visualization:
- Integration with Matplotlib and Seaborn for generating plots to analyze model performance and data characteristics.
- Visualization support: Enables users to visualize data, model performance, and predictions using plotting functionalities.
- `Visualizer` class: Integrates with Matplotlib and Seaborn to generate plots for model performance analysis and data visualization.
- `plot_confusion_matrix` method: Visualizes the confusion matrix.
- `plot_roc_curve` method: Plots the Receiver Operating Characteristic (ROC) curve.
- `plot_feature_importance` method: Visualizes feature importance for applicable algorithms.
11. Utility Functions:
- Functions for saving and loading trained models.
- Logging functionalities to track the model training and prediction processes.
- `save_model` method: Saves the trained model to a file.
- `load_model` method: Loads a previously trained model from a file.
- `set_logger` method: Configures logging functionality for tracking model training and prediction processes.
12. User-Friendly Interface: Provides a simplified and intuitive interface for users to interact with and apply classic AI algorithms without extensive knowledge or configuration.
13.. Error Handling: Incorporates mechanisms to handle invalid inputs, errors during training, and other potential issues during algorithm usage.
- Custom exception classes for handling specific errors and providing informative error messages to users.
14. Documentation: Comprehensive documentation to guide users on how to use Easylibpal effectively and efficiently
- Comprehensive documentation explaining the usage and functionality of each component.
- Example scripts demonstrating how to use Easylibpal for various AI tasks and datasets.
15. Testing Suite:
- Unit tests for each component to ensure code reliability and maintainability.
- Integration tests to verify the smooth interaction between different components.
IMPLEMENTATION EXAMPLE WITH ADDITIONAL FEATURES:
Here is an example of how the expanded Easylibpal library could be structured and used:
```python
import numpy as np
import pandas as pd
from sklearn.model_selection import train_test_split
from sklearn.preprocessing import StandardScaler
from easylibpal import Easylibpal, DataLoader, Evaluator, Tuner
# Example DataLoader
class DataLoader:
def load_data(self, filepath, file_type='csv'):
if file_type == 'csv':
return pd.read_csv(filepath)
else:
raise ValueError("Unsupported file type provided.")
# Example Evaluator
class Evaluator:
def evaluate(self, model, X_test, y_test):
predictions = model.predict(X_test)
accuracy = np.mean(predictions == y_test)
return {'accuracy': accuracy}
# Example usage of Easylibpal with DataLoader and Evaluator
if __name__ == "__main__":
# Load and prepare the data
data_loader = DataLoader()
data = data_loader.load_data('path/to/your/data.csv')
X = data.iloc[:, :-1]
y = data.iloc[:, -1]
X_train, X_test, y_train, y_test = train_test_split(X, y, test_size=0.2, random_state=42)
# Scale features
scaler = StandardScaler()
X_train_scaled = scaler.fit_transform(X_train)
X_test_scaled = scaler.transform(X_test)
# Initialize Easylibpal with the desired algorithm
model = Easylibpal('Random Forest')
model.fit(X_train_scaled, y_train)
# Evaluate the model
evaluator = Evaluator()
results = evaluator.evaluate(model, X_test_scaled, y_test)
print(f"Model Accuracy: {results['accuracy']}")
# Optional: Use Tuner for hyperparameter optimization
tuner = Tuner(model, param_grid={'n_estimators': [100, 200], 'max_depth': [10, 20, 30]})
best_params = tuner.optimize(X_train_scaled, y_train)
print(f"Best Parameters: {best_params}")
```
This example demonstrates the structured approach to using Easylibpal with enhanced data handling, model evaluation, and optional hyperparameter tuning. The library empowers users to handle real-world datasets, apply various machine learning algorithms, and evaluate their performance with ease, making it an invaluable tool for developers and data scientists aiming to implement AI solutions efficiently.
Easylibpal is dedicated to making the latest AI technology accessible to everyone, regardless of their background or expertise. Our platform simplifies the process of selecting and implementing classic AI algorithms, enabling users across various industries to harness the power of artificial intelligence with ease. By democratizing access to AI, we aim to accelerate innovation and empower users to achieve their goals with confidence. Easylibpal's approach involves a democratization framework that reduces entry barriers, lowers the cost of building AI solutions, and speeds up the adoption of AI in both academic and business settings.
Below are examples showcasing how each main component of the Easylibpal library could be implemented and used in practice to provide a user-friendly interface for utilizing classic AI algorithms.
1. Core Components
Easylibpal Class Example:
```python
class Easylibpal:
def __init__(self, algorithm):
self.algorithm = algorithm
self.model = None
def fit(self, X, y):
# Simplified example: Instantiate and train a model based on the selected algorithm
if self.algorithm == 'Linear Regression':
from sklearn.linear_model import LinearRegression
self.model = LinearRegression()
elif self.algorithm == 'Random Forest':
from sklearn.ensemble import RandomForestClassifier
self.model = RandomForestClassifier()
self.model.fit(X, y)
def predict(self, X):
return self.model.predict(X)
```
2. Data Handling
DataLoader Class Example:
```python
class DataLoader:
def load_data(self, filepath, file_type='csv'):
if file_type == 'csv':
import pandas as pd
return pd.read_csv(filepath)
else:
raise ValueError("Unsupported file type provided.")
```
3. Model Evaluation
Evaluator Class Example:
```python
from sklearn.metrics import accuracy_score, classification_report
class Evaluator:
def evaluate(self, model, X_test, y_test):
predictions = model.predict(X_test)
accuracy = accuracy_score(y_test, predictions)
report = classification_report(y_test, predictions)
return {'accuracy': accuracy, 'report': report}
```
4. Hyperparameter Tuning
Tuner Class Example:
```python
from sklearn.model_selection import GridSearchCV
class Tuner:
def __init__(self, model, param_grid):
self.model = model
self.param_grid = param_grid
def optimize(self, X, y):
grid_search = GridSearchCV(self.model, self.param_grid, cv=5)
grid_search.fit(X, y)
return grid_search.best_params_
```
5. Visualization
Visualizer Class Example:
```python
import matplotlib.pyplot as plt
class Visualizer:
def plot_confusion_matrix(self, cm, classes, normalize=False, title='Confusion matrix'):
plt.imshow(cm, interpolation='nearest', cmap=plt.cm.Blues)
plt.title(title)
plt.colorbar()
tick_marks = np.arange(len(classes))
plt.xticks(tick_marks, classes, rotation=45)
plt.yticks(tick_marks, classes)
plt.ylabel('True label')
plt.xlabel('Predicted label')
plt.show()
```
6. Utility Functions
Save and Load Model Example:
```python
import joblib
def save_model(model, filename):
joblib.dump(model, filename)
def load_model(filename):
return joblib.load(filename)
```
7. Example Usage Script
Using Easylibpal in a Script:
```python
# Assuming Easylibpal and other classes have been imported
data_loader = DataLoader()
data = data_loader.load_data('data.csv')
X = data.drop('Target', axis=1)
y = data['Target']
model = Easylibpal('Random Forest')
model.fit(X, y)
evaluator = Evaluator()
results = evaluator.evaluate(model, X, y)
print("Accuracy:", results['accuracy'])
print("Report:", results['report'])
visualizer = Visualizer()
visualizer.plot_confusion_matrix(results['cm'], classes=['Class1', 'Class2'])
save_model(model, 'trained_model.pkl')
loaded_model = load_model('trained_model.pkl')
```
These examples illustrate the practical implementation and use of the Easylibpal library components, aiming to simplify the application of AI algorithms for users with varying levels of expertise in machine learning.
EASYLIBPAL IMPLEMENTATION:
Step 1: Define the Problem
First, we need to define the problem we want to solve. For this POC, let's assume we want to predict house prices based on various features like the number of bedrooms, square footage, and location.
Step 2: Choose an Appropriate Algorithm
Given our problem, a supervised learning algorithm like linear regression would be suitable. We'll use Scikit-learn, a popular library for machine learning in Python, to implement this algorithm.
Step 3: Prepare Your Data
We'll use Pandas to load and prepare our dataset. This involves cleaning the data, handling missing values, and splitting the dataset into training and testing sets.
Step 4: Implement the Algorithm
Now, we'll use Scikit-learn to implement the linear regression algorithm. We'll train the model on our training data and then test its performance on the testing data.
Step 5: Evaluate the Model
Finally, we'll evaluate the performance of our model using metrics like Mean Squared Error (MSE) and R-squared.
Python Code POC
```python
import numpy as np
import pandas as pd
from sklearn.model_selection import train_test_split
from sklearn.linear_model import LinearRegression
from sklearn.metrics import mean_squared_error, r2_score
# Load the dataset
data = pd.read_csv('house_prices.csv')
# Prepare the data
X = data'bedrooms', 'square_footage', 'location'
y = data['price']
# Split the data into training and testing sets
X_train, X_test, y_train, y_test = train_test_split(X, y, test_size=0.2, random_state=42)
# Create and train the model
model = LinearRegression()
model.fit(X_train, y_train)
# Make predictions
predictions = model.predict(X_test)
# Evaluate the model
mse = mean_squared_error(y_test, predictions)
r2 = r2_score(y_test, predictions)
print(f'Mean Squared Error: {mse}')
print(f'R-squared: {r2}')
```
Below is an implementation, Easylibpal provides a simple interface to instantiate and utilize classic AI algorithms such as Linear Regression, Logistic Regression, SVM, Naive Bayes, and K-NN. Users can easily create an instance of Easylibpal with their desired algorithm, fit the model with training data, and make predictions, all with minimal code and hassle. This demonstrates the power of Easylibpal in simplifying the integration of AI algorithms for various tasks.
```python
# Import necessary libraries
import numpy as np
import pandas as pd
import matplotlib.pyplot as plt
from sklearn.linear_model import LinearRegression
from sklearn.linear_model import LogisticRegression
from sklearn.svm import SVC
from sklearn.naive_bayes import GaussianNB
from sklearn.neighbors import KNeighborsClassifier
class Easylibpal:
def __init__(self, algorithm):
self.algorithm = algorithm
def fit(self, X, y):
if self.algorithm == 'Linear Regression':
self.model = LinearRegression()
elif self.algorithm == 'Logistic Regression':
self.model = LogisticRegression()
elif self.algorithm == 'SVM':
self.model = SVC()
elif self.algorithm == 'Naive Bayes':
self.model = GaussianNB()
elif self.algorithm == 'K-NN':
self.model = KNeighborsClassifier()
else:
raise ValueError("Invalid algorithm specified.")
self.model.fit(X, y)
def predict(self, X):
return self.model.predict(X)
# Example usage:
# Initialize Easylibpal with the desired algorithm
easy_algo = Easylibpal('Linear Regression')
# Generate some sample data
X = np.array([[1], [2], [3], [4]])
y = np.array([2, 4, 6, 8])
# Fit the model
easy_algo.fit(X, y)
# Make predictions
predictions = easy_algo.predict(X)
# Plot the results
plt.scatter(X, y)
plt.plot(X, predictions, color='red')
plt.title('Linear Regression with Easylibpal')
plt.xlabel('X')
plt.ylabel('y')
plt.show()
```
Easylibpal is an innovative Python library designed to simplify the integration and use of classic AI algorithms in a user-friendly manner. It aims to bridge the gap between the complexity of AI libraries and the ease of use, making it accessible for developers and data scientists alike. Easylibpal abstracts the underlying complexity of each algorithm, providing a unified interface that allows users to apply these algorithms with minimal configuration and understanding of the underlying mechanisms.
ENHANCED DATASET HANDLING
Easylibpal should be able to handle datasets more efficiently. This includes loading datasets from various sources (e.g., CSV files, databases), preprocessing data (e.g., normalization, handling missing values), and splitting data into training and testing sets.
```python
import os
from sklearn.model_selection import train_test_split
class Easylibpal:
# Existing code...
def load_dataset(self, filepath):
"""Loads a dataset from a CSV file."""
if not os.path.exists(filepath):
raise FileNotFoundError("Dataset file not found.")
return pd.read_csv(filepath)
def preprocess_data(self, dataset):
"""Preprocesses the dataset."""
# Implement data preprocessing steps here
return dataset
def split_data(self, X, y, test_size=0.2):
"""Splits the dataset into training and testing sets."""
return train_test_split(X, y, test_size=test_size)
```
Additional Algorithms
Easylibpal should support a wider range of algorithms. This includes decision trees, random forests, and gradient boosting machines.
```python
from sklearn.tree import DecisionTreeClassifier
from sklearn.ensemble import RandomForestClassifier
from sklearn.ensemble import GradientBoostingClassifier
class Easylibpal:
# Existing code...
def fit(self, X, y):
# Existing code...
elif self.algorithm == 'Decision Tree':
self.model = DecisionTreeClassifier()
elif self.algorithm == 'Random Forest':
self.model = RandomForestClassifier()
elif self.algorithm == 'Gradient Boosting':
self.model = GradientBoostingClassifier()
# Add more algorithms as needed
```
User-Friendly Features
To make Easylibpal even more user-friendly, consider adding features like:
- Automatic hyperparameter tuning: Implementing a simple interface for hyperparameter tuning using GridSearchCV or RandomizedSearchCV.
- Model evaluation metrics: Providing easy access to common evaluation metrics like accuracy, precision, recall, and F1 score.
- Visualization tools: Adding methods for plotting model performance, confusion matrices, and feature importance.
```python
from sklearn.metrics import accuracy_score, classification_report
from sklearn.model_selection import GridSearchCV
class Easylibpal:
# Existing code...
def evaluate_model(self, X_test, y_test):
"""Evaluates the model using accuracy and classification report."""
y_pred = self.predict(X_test)
print("Accuracy:", accuracy_score(y_test, y_pred))
print(classification_report(y_test, y_pred))
def tune_hyperparameters(self, X, y, param_grid):
"""Tunes the model's hyperparameters using GridSearchCV."""
grid_search = GridSearchCV(self.model, param_grid, cv=5)
grid_search.fit(X, y)
self.model = grid_search.best_estimator_
```
Easylibpal leverages the power of Python and its rich ecosystem of AI and machine learning libraries, such as scikit-learn, to implement the classic algorithms. It provides a high-level API that abstracts the specifics of each algorithm, allowing users to focus on the problem at hand rather than the intricacies of the algorithm.
Python Code Snippets for Easylibpal
Below are Python code snippets demonstrating the use of Easylibpal with classic AI algorithms. Each snippet demonstrates how to use Easylibpal to apply a specific algorithm to a dataset.
# Linear Regression
```python
from Easylibpal import Easylibpal
# Initialize Easylibpal with a dataset
Easylibpal = Easylibpal(dataset='your_dataset.csv')
# Apply Linear Regression
result = Easylibpal.apply_algorithm('linear_regression', target_column='target')
# Print the result
print(result)
```
# Logistic Regression
```python
from Easylibpal import Easylibpal
# Initialize Easylibpal with a dataset
Easylibpal = Easylibpal(dataset='your_dataset.csv')
# Apply Logistic Regression
result = Easylibpal.apply_algorithm('logistic_regression', target_column='target')
# Print the result
print(result)
```
# Support Vector Machines (SVM)
```python
from Easylibpal import Easylibpal
# Initialize Easylibpal with a dataset
Easylibpal = Easylibpal(dataset='your_dataset.csv')
# Apply SVM
result = Easylibpal.apply_algorithm('svm', target_column='target')
# Print the result
print(result)
```
# Naive Bayes
```python
from Easylibpal import Easylibpal
# Initialize Easylibpal with a dataset
Easylibpal = Easylibpal(dataset='your_dataset.csv')
# Apply Naive Bayes
result = Easylibpal.apply_algorithm('naive_bayes', target_column='target')
# Print the result
print(result)
```
# K-Nearest Neighbors (K-NN)
```python
from Easylibpal import Easylibpal
# Initialize Easylibpal with a dataset
Easylibpal = Easylibpal(dataset='your_dataset.csv')
# Apply K-NN
result = Easylibpal.apply_algorithm('knn', target_column='target')
# Print the result
print(result)
```
ABSTRACTION AND ESSENTIAL COMPLEXITY
- Essential Complexity: This refers to the inherent complexity of the problem domain, which cannot be reduced regardless of the programming language or framework used. It includes the logic and algorithm needed to solve the problem. For example, the essential complexity of sorting a list remains the same across different programming languages.
- Accidental Complexity: This is the complexity introduced by the choice of programming language, framework, or libraries. It can be reduced or eliminated through abstraction. For instance, using a high-level API in Python can hide the complexity of lower-level operations, making the code more readable and maintainable.
HOW EASYLIBPAL ABSTRACTS COMPLEXITY
Easylibpal aims to reduce accidental complexity by providing a high-level API that encapsulates the details of each classic AI algorithm. This abstraction allows users to apply these algorithms without needing to understand the underlying mechanisms or the specifics of the algorithm's implementation.
- Simplified Interface: Easylibpal offers a unified interface for applying various algorithms, such as Linear Regression, Logistic Regression, SVM, Naive Bayes, and K-NN. This interface abstracts the complexity of each algorithm, making it easier for users to apply them to their datasets.
- Runtime Fusion: By evaluating sub-expressions and sharing them across multiple terms, Easylibpal can optimize the execution of algorithms. This approach, similar to runtime fusion in abstract algorithms, allows for efficient computation without duplicating work, thereby reducing the computational complexity.
- Focus on Essential Complexity: While Easylibpal abstracts away the accidental complexity; it ensures that the essential complexity of the problem domain remains at the forefront. This means that while the implementation details are hidden, the core logic and algorithmic approach are still accessible and understandable to the user.
To implement Easylibpal, one would need to create a Python class that encapsulates the functionality of each classic AI algorithm. This class would provide methods for loading datasets, preprocessing data, and applying the algorithm with minimal configuration required from the user. The implementation would leverage existing libraries like scikit-learn for the actual algorithmic computations, abstracting away the complexity of these libraries.
Here's a conceptual example of how the Easylibpal class might be structured for applying a Linear Regression algorithm:
```python
class Easylibpal:
def __init__(self, dataset):
self.dataset = dataset
# Load and preprocess the dataset
def apply_linear_regression(self, target_column):
# Abstracted implementation of Linear Regression
# This method would internally use scikit-learn or another library
# to perform the actual computation, abstracting the complexity
pass
# Usage
Easylibpal = Easylibpal(dataset='your_dataset.csv')
result = Easylibpal.apply_linear_regression(target_column='target')
```
This example demonstrates the concept of Easylibpal by abstracting the complexity of applying a Linear Regression algorithm. The actual implementation would need to include the specifics of loading the dataset, preprocessing it, and applying the algorithm using an underlying library like scikit-learn.
Easylibpal abstracts the complexity of classic AI algorithms by providing a simplified interface that hides the intricacies of each algorithm's implementation. This abstraction allows users to apply these algorithms with minimal configuration and understanding of the underlying mechanisms. Here are examples of specific algorithms that Easylibpal abstracts:
To implement Easylibpal, one would need to create a Python class that encapsulates the functionality of each classic AI algorithm. This class would provide methods for loading datasets, preprocessing data, and applying the algorithm with minimal configuration required from the user. The implementation would leverage existing libraries like scikit-learn for the actual algorithmic computations, abstracting away the complexity of these libraries.
Here's a conceptual example of how the Easylibpal class might be structured for applying a Linear Regression algorithm:
```python
class Easylibpal:
def __init__(self, dataset):
self.dataset = dataset
# Load and preprocess the dataset
def apply_linear_regression(self, target_column):
# Abstracted implementation of Linear Regression
# This method would internally use scikit-learn or another library
# to perform the actual computation, abstracting the complexity
pass
# Usage
Easylibpal = Easylibpal(dataset='your_dataset.csv')
result = Easylibpal.apply_linear_regression(target_column='target')
```
This example demonstrates the concept of Easylibpal by abstracting the complexity of applying a Linear Regression algorithm. The actual implementation would need to include the specifics of loading the dataset, preprocessing it, and applying the algorithm using an underlying library like scikit-learn.
Easylibpal abstracts the complexity of feature selection for classic AI algorithms by providing a simplified interface that automates the process of selecting the most relevant features for each algorithm. This abstraction is crucial because feature selection is a critical step in machine learning that can significantly impact the performance of a model. Here's how Easylibpal handles feature selection for the mentioned algorithms:
To implement feature selection in Easylibpal, one could use scikit-learn's `SelectKBest` or `RFE` classes for feature selection based on statistical tests or model coefficients. Here's a conceptual example of how feature selection might be integrated into the Easylibpal class for Linear Regression:
```python
from sklearn.feature_selection import SelectKBest, f_regression
from sklearn.linear_model import LinearRegression
class Easylibpal:
def __init__(self, dataset):
self.dataset = dataset
# Load and preprocess the dataset
def apply_linear_regression(self, target_column):
# Feature selection using SelectKBest
selector = SelectKBest(score_func=f_regression, k=10)
X_new = selector.fit_transform(self.dataset.drop(target_column, axis=1), self.dataset[target_column])
# Train Linear Regression model
model = LinearRegression()
model.fit(X_new, self.dataset[target_column])
# Return the trained model
return model
# Usage
Easylibpal = Easylibpal(dataset='your_dataset.csv')
model = Easylibpal.apply_linear_regression(target_column='target')
```
This example demonstrates how Easylibpal abstracts the complexity of feature selection for Linear Regression by using scikit-learn's `SelectKBest` to select the top 10 features based on their statistical significance in predicting the target variable. The actual implementation would need to adapt this approach for each algorithm, considering the specific characteristics and requirements of each algorithm.
To implement feature selection in Easylibpal, one could use scikit-learn's `SelectKBest`, `RFE`, or other feature selection classes based on the algorithm's requirements. Here's a conceptual example of how feature selection might be integrated into the Easylibpal class for Logistic Regression using RFE:
```python
from sklearn.feature_selection import RFE
from sklearn.linear_model import LogisticRegression
class Easylibpal:
def __init__(self, dataset):
self.dataset = dataset
# Load and preprocess the dataset
def apply_logistic_regression(self, target_column):
# Feature selection using RFE
model = LogisticRegression()
rfe = RFE(model, n_features_to_select=10)
rfe.fit(self.dataset.drop(target_column, axis=1), self.dataset[target_column])
# Train Logistic Regression model
model.fit(self.dataset.drop(target_column, axis=1), self.dataset[target_column])
# Return the trained model
return model
# Usage
Easylibpal = Easylibpal(dataset='your_dataset.csv')
model = Easylibpal.apply_logistic_regression(target_column='target')
```
This example demonstrates how Easylibpal abstracts the complexity of feature selection for Logistic Regression by using scikit-learn's `RFE` to select the top 10 features based on their importance in the model. The actual implementation would need to adapt this approach for each algorithm, considering the specific characteristics and requirements of each algorithm.
EASYLIBPAL HANDLES DIFFERENT TYPES OF DATASETS
Easylibpal handles different types of datasets with varying structures by adopting a flexible and adaptable approach to data preprocessing and transformation. This approach is inspired by the principles of tidy data and the need to ensure data is in a consistent, usable format before applying AI algorithms. Here's how Easylibpal addresses the challenges posed by varying dataset structures:
One Type in Multiple Tables
When datasets contain different variables, the same variables with different names, different file formats, or different conventions for missing values, Easylibpal employs a process similar to tidying data. This involves identifying and standardizing the structure of each dataset, ensuring that each variable is consistently named and formatted across datasets. This process might include renaming columns, converting data types, and handling missing values in a uniform manner. For datasets stored in different file formats, Easylibpal would use appropriate libraries (e.g., pandas for CSV, Excel files, and SQL databases) to load and preprocess the data before applying the algorithms.
Multiple Types in One Table
For datasets that involve values collected at multiple levels or on different types of observational units, Easylibpal applies a normalization process. This involves breaking down the dataset into multiple tables, each representing a distinct type of observational unit. For example, if a dataset contains information about songs and their rankings over time, Easylibpal would separate this into two tables: one for song details and another for rankings. This normalization ensures that each fact is expressed in only one place, reducing inconsistencies and making the data more manageable for analysis.
Data Semantics
Easylibpal ensures that the data is organized in a way that aligns with the principles of data semantics, where every value belongs to a variable and an observation. This organization is crucial for the algorithms to interpret the data correctly. Easylibpal might use functions like `pivot_longer` and `pivot_wider` from the tidyverse or equivalent functions in pandas to reshape the data into a long format, where each row represents a single observation and each column represents a single variable. This format is particularly useful for algorithms that require a consistent structure for input data.
Messy Data
Dealing with messy data, which can include inconsistent data types, missing values, and outliers, is a common challenge in data science. Easylibpal addresses this by implementing robust data cleaning and preprocessing steps. This includes handling missing values (e.g., imputation or deletion), converting data types to ensure consistency, and identifying and removing outliers. These steps are crucial for preparing the data in a format that is suitable for the algorithms, ensuring that the algorithms can effectively learn from the data without being hindered by its inconsistencies.
To implement these principles in Python, Easylibpal would leverage libraries like pandas for data manipulation and preprocessing. Here's a conceptual example of how Easylibpal might handle a dataset with multiple types in one table:
```python
import pandas as pd
# Load the dataset
dataset = pd.read_csv('your_dataset.csv')
# Normalize the dataset by separating it into two tables
song_table = dataset'artist', 'track'.drop_duplicates().reset_index(drop=True)
song_table['song_id'] = range(1, len(song_table) + 1)
ranking_table = dataset'artist', 'track', 'week', 'rank'.drop_duplicates().reset_index(drop=True)
# Now, song_table and ranking_table can be used separately for analysis
```
This example demonstrates how Easylibpal might normalize a dataset with multiple types of observational units into separate tables, ensuring that each type of observational unit is stored in its own table. The actual implementation would need to adapt this approach based on the specific structure and requirements of the dataset being processed.
CLEAN DATA
Easylibpal employs a comprehensive set of data cleaning and preprocessing steps to handle messy data, ensuring that the data is in a suitable format for machine learning algorithms. These steps are crucial for improving the accuracy and reliability of the models, as well as preventing misleading results and conclusions. Here's a detailed look at the specific steps Easylibpal might employ:
1. Remove Irrelevant Data
The first step involves identifying and removing data that is not relevant to the analysis or modeling task at hand. This could include columns or rows that do not contribute to the predictive power of the model or are not necessary for the analysis .
2. Deduplicate Data
Deduplication is the process of removing duplicate entries from the dataset. Duplicates can skew the analysis and lead to incorrect conclusions. Easylibpal would use appropriate methods to identify and remove duplicates, ensuring that each entry in the dataset is unique.
3. Fix Structural Errors
Structural errors in the dataset, such as inconsistent data types, incorrect values, or formatting issues, can significantly impact the performance of machine learning algorithms. Easylibpal would employ data cleaning techniques to correct these errors, ensuring that the data is consistent and correctly formatted.
4. Deal with Missing Data
Handling missing data is a common challenge in data preprocessing. Easylibpal might use techniques such as imputation (filling missing values with statistical estimates like mean, median, or mode) or deletion (removing rows or columns with missing values) to address this issue. The choice of method depends on the nature of the data and the specific requirements of the analysis.
5. Filter Out Data Outliers
Outliers can significantly affect the performance of machine learning models. Easylibpal would use statistical methods to identify and filter out outliers, ensuring that the data is more representative of the population being analyzed.
6. Validate Data
The final step involves validating the cleaned and preprocessed data to ensure its quality and accuracy. This could include checking for consistency, verifying the correctness of the data, and ensuring that the data meets the requirements of the machine learning algorithms. Easylibpal would employ validation techniques to confirm that the data is ready for analysis.
To implement these data cleaning and preprocessing steps in Python, Easylibpal would leverage libraries like pandas and scikit-learn. Here's a conceptual example of how these steps might be integrated into the Easylibpal class:
```python
import pandas as pd
from sklearn.impute import SimpleImputer
from sklearn.preprocessing import StandardScaler
class Easylibpal:
def __init__(self, dataset):
self.dataset = dataset
# Load and preprocess the dataset
def clean_and_preprocess(self):
# Remove irrelevant data
self.dataset = self.dataset.drop(['irrelevant_column'], axis=1)
# Deduplicate data
self.dataset = self.dataset.drop_duplicates()
# Fix structural errors (example: correct data type)
self.dataset['correct_data_type_column'] = self.dataset['correct_data_type_column'].astype(float)
# Deal with missing data (example: imputation)
imputer = SimpleImputer(strategy='mean')
self.dataset['missing_data_column'] = imputer.fit_transform(self.dataset'missing_data_column')
# Filter out data outliers (example: using Z-score)
# This step requires a more detailed implementation based on the specific dataset
# Validate data (example: checking for NaN values)
assert not self.dataset.isnull().values.any(), "Data still contains NaN values"
# Return the cleaned and preprocessed dataset
return self.dataset
# Usage
Easylibpal = Easylibpal(dataset=pd.read_csv('your_dataset.csv'))
cleaned_dataset = Easylibpal.clean_and_preprocess()
```
This example demonstrates a simplified approach to data cleaning and preprocessing within Easylibpal. The actual implementation would need to adapt these steps based on the specific characteristics and requirements of the dataset being processed.
VALUE DATA
Easylibpal determines which data is irrelevant and can be removed through a combination of domain knowledge, data analysis, and automated techniques. The process involves identifying data that does not contribute to the analysis, research, or goals of the project, and removing it to improve the quality, efficiency, and clarity of the data. Here's how Easylibpal might approach this:
Domain Knowledge
Easylibpal leverages domain knowledge to identify data that is not relevant to the specific goals of the analysis or modeling task. This could include data that is out of scope, outdated, duplicated, or erroneous. By understanding the context and objectives of the project, Easylibpal can systematically exclude data that does not add value to the analysis.
Data Analysis
Easylibpal employs data analysis techniques to identify irrelevant data. This involves examining the dataset to understand the relationships between variables, the distribution of data, and the presence of outliers or anomalies. Data that does not have a significant impact on the predictive power of the model or the insights derived from the analysis is considered irrelevant.
Automated Techniques
Easylibpal uses automated tools and methods to remove irrelevant data. This includes filtering techniques to select or exclude certain rows or columns based on criteria or conditions, aggregating data to reduce its complexity, and deduplicating to remove duplicate entries. Tools like Excel, Google Sheets, Tableau, Power BI, OpenRefine, Python, R, Data Linter, Data Cleaner, and Data Wrangler can be employed for these purposes .
Examples of Irrelevant Data
- Personal Identifiable Information (PII): Data such as names, addresses, and phone numbers are irrelevant for most analytical purposes and should be removed to protect privacy and comply with data protection regulations .
- URLs and HTML Tags: These are typically not relevant to the analysis and can be removed to clean up the dataset.
- Boilerplate Text: Excessive blank space or boilerplate text (e.g., in emails) adds noise to the data and can be removed.
- Tracking Codes: These are used for tracking user interactions and do not contribute to the analysis.
To implement these steps in Python, Easylibpal might use pandas for data manipulation and filtering. Here's a conceptual example of how to remove irrelevant data:
```python
import pandas as pd
# Load the dataset
dataset = pd.read_csv('your_dataset.csv')
# Remove irrelevant columns (example: email addresses)
dataset = dataset.drop(['email_address'], axis=1)
# Remove rows with missing values (example: if a column is required for analysis)
dataset = dataset.dropna(subset=['required_column'])
# Deduplicate data
dataset = dataset.drop_duplicates()
# Return the cleaned dataset
cleaned_dataset = dataset
```
This example demonstrates how Easylibpal might remove irrelevant data from a dataset using Python and pandas. The actual implementation would need to adapt these steps based on the specific characteristics and requirements of the dataset being processed.
Detecting Inconsistencies
Easylibpal starts by detecting inconsistencies in the data. This involves identifying discrepancies in data types, missing values, duplicates, and formatting errors. By detecting these inconsistencies, Easylibpal can take targeted actions to address them.
Handling Formatting Errors
Formatting errors, such as inconsistent data types for the same feature, can significantly impact the analysis. Easylibpal uses functions like `astype()` in pandas to convert data types, ensuring uniformity and consistency across the dataset. This step is crucial for preparing the data for analysis, as it ensures that each feature is in the correct format expected by the algorithms.
Handling Missing Values
Missing values are a common issue in datasets. Easylibpal addresses this by consulting with subject matter experts to understand why data might be missing. If the missing data is missing completely at random, Easylibpal might choose to drop it. However, for other cases, Easylibpal might employ imputation techniques to fill in missing values, ensuring that the dataset is complete and ready for analysis.
Handling Duplicates
Duplicate entries can skew the analysis and lead to incorrect conclusions. Easylibpal uses pandas to identify and remove duplicates, ensuring that each entry in the dataset is unique. This step is crucial for maintaining the integrity of the data and ensuring that the analysis is based on distinct observations.
Handling Inconsistent Values
Inconsistent values, such as different representations of the same concept (e.g., "yes" vs. "y" for a binary variable), can also pose challenges. Easylibpal employs data cleaning techniques to standardize these values, ensuring that the data is consistent and can be accurately analyzed.
To implement these steps in Python, Easylibpal would leverage pandas for data manipulation and preprocessing. Here's a conceptual example of how these steps might be integrated into the Easylibpal class:
```python
import pandas as pd
class Easylibpal:
def __init__(self, dataset):
self.dataset = dataset
# Load and preprocess the dataset
def clean_and_preprocess(self):
# Detect inconsistencies (example: check data types)
print(self.dataset.dtypes)
# Handle formatting errors (example: convert data types)
self.dataset['date_column'] = pd.to_datetime(self.dataset['date_column'])
# Handle missing values (example: drop rows with missing values)
self.dataset = self.dataset.dropna(subset=['required_column'])
# Handle duplicates (example: drop duplicates)
self.dataset = self.dataset.drop_duplicates()
# Handle inconsistent values (example: standardize values)
self.dataset['binary_column'] = self.dataset['binary_column'].map({'yes': 1, 'no': 0})
# Return the cleaned and preprocessed dataset
return self.dataset
# Usage
Easylibpal = Easylibpal(dataset=pd.read_csv('your_dataset.csv'))
cleaned_dataset = Easylibpal.clean_and_preprocess()
```
This example demonstrates a simplified approach to handling inconsistent or messy data within Easylibpal. The actual implementation would need to adapt these steps based on the specific characteristics and requirements of the dataset being processed.
Statistical Imputation
Statistical imputation involves replacing missing values with statistical estimates such as the mean, median, or mode of the available data. This method is straightforward and can be effective for numerical data. For categorical data, mode imputation is commonly used. The choice of imputation method depends on the distribution of the data and the nature of the missing values.
Model-Based Imputation
Model-based imputation uses machine learning models to predict missing values. This approach can be more sophisticated and potentially more accurate than statistical imputation, especially for complex datasets. Techniques like K-Nearest Neighbors (KNN) imputation can be used, where the missing values are replaced with the values of the K nearest neighbors in the feature space.
Using SimpleImputer in scikit-learn
The scikit-learn library provides the `SimpleImputer` class, which supports both statistical and model-based imputation. `SimpleImputer` can be used to replace missing values with the mean, median, or most frequent value (mode) of the column. It also supports more advanced imputation methods like KNN imputation.
To implement these imputation techniques in Python, Easylibpal might use the `SimpleImputer` class from scikit-learn. Here's an example of how to use `SimpleImputer` for statistical imputation:
```python
from sklearn.impute import SimpleImputer
import pandas as pd
# Load the dataset
dataset = pd.read_csv('your_dataset.csv')
# Initialize SimpleImputer for numerical columns
num_imputer = SimpleImputer(strategy='mean')
# Fit and transform the numerical columns
dataset'numerical_column1', 'numerical_column2' = num_imputer.fit_transform(dataset'numerical_column1', 'numerical_column2')
# Initialize SimpleImputer for categorical columns
cat_imputer = SimpleImputer(strategy='most_frequent')
# Fit and transform the categorical columns
dataset'categorical_column1', 'categorical_column2' = cat_imputer.fit_transform(dataset'categorical_column1', 'categorical_column2')
# The dataset now has missing values imputed
```
This example demonstrates how to use `SimpleImputer` to fill in missing values in both numerical and categorical columns of a dataset. The actual implementation would need to adapt these steps based on the specific characteristics and requirements of the dataset being processed.
Model-based imputation techniques, such as Multiple Imputation by Chained Equations (MICE), offer powerful ways to handle missing data by using statistical models to predict missing values. However, these techniques come with their own set of limitations and potential drawbacks:
1. Complexity and Computational Cost
Model-based imputation methods can be computationally intensive, especially for large datasets or complex models. This can lead to longer processing times and increased computational resources required for imputation.
2. Overfitting and Convergence Issues
These methods are prone to overfitting, where the imputation model captures noise in the data rather than the underlying pattern. Overfitting can lead to imputed values that are too closely aligned with the observed data, potentially introducing bias into the analysis. Additionally, convergence issues may arise, where the imputation process does not settle on a stable solution.
3. Assumptions About Missing Data
Model-based imputation techniques often assume that the data is missing at random (MAR), which means that the probability of a value being missing is not related to the values of other variables. However, this assumption may not hold true in all cases, leading to biased imputations if the data is missing not at random (MNAR).
4. Need for Suitable Regression Models
For each variable with missing values, a suitable regression model must be chosen. Selecting the wrong model can lead to inaccurate imputations. The choice of model depends on the nature of the data and the relationship between the variable with missing values and other variables.
5. Combining Imputed Datasets
After imputing missing values, there is a challenge in combining the multiple imputed datasets to produce a single, final dataset. This requires careful consideration of how to aggregate the imputed values and can introduce additional complexity and uncertainty into the analysis.
6. Lack of Transparency
The process of model-based imputation can be less transparent than simpler imputation methods, such as mean or median imputation. This can make it harder to justify the imputation process, especially in contexts where the reasons for missing data are important, such as in healthcare research.
Despite these limitations, model-based imputation techniques can be highly effective for handling missing data in datasets where a amusingness is MAR and where the relationships between variables are complex. Careful consideration of the assumptions, the choice of models, and the methods for combining imputed datasets are crucial to mitigate these drawbacks and ensure the validity of the imputation process.
USING EASYLIBPAL FOR AI ALGORITHM INTEGRATION OFFERS SEVERAL SIGNIFICANT BENEFITS, PARTICULARLY IN ENHANCING EVERYDAY LIFE AND REVOLUTIONIZING VARIOUS SECTORS. HERE'S A DETAILED LOOK AT THE ADVANTAGES:
1. Enhanced Communication: AI, through Easylibpal, can significantly improve communication by categorizing messages, prioritizing inboxes, and providing instant customer support through chatbots. This ensures that critical information is not missed and that customer queries are resolved promptly.
2. Creative Endeavors: Beyond mundane tasks, AI can also contribute to creative endeavors. For instance, photo editing applications can use AI algorithms to enhance images, suggesting edits that align with aesthetic preferences. Music composition tools can generate melodies based on user input, inspiring musicians and amateurs alike to explore new artistic horizons. These innovations empower individuals to express themselves creatively with AI as a collaborative partner.
3. Daily Life Enhancement: AI, integrated through Easylibpal, has the potential to enhance daily life exponentially. Smart homes equipped with AI-driven systems can adjust lighting, temperature, and security settings according to user preferences. Autonomous vehicles promise safer and more efficient commuting experiences. Predictive analytics can optimize supply chains, reducing waste and ensuring goods reach users when needed.
4. Paradigm Shift in Technology Interaction: The integration of AI into our daily lives is not just a trend; it's a paradigm shift that's redefining how we interact with technology. By streamlining routine tasks, personalizing experiences, revolutionizing healthcare, enhancing communication, and fueling creativity, AI is opening doors to a more convenient, efficient, and tailored existence.
5. Responsible Benefit Harnessing: As we embrace AI's transformational power, it's essential to approach its integration with a sense of responsibility, ensuring that its benefits are harnessed for the betterment of society as a whole. This approach aligns with the ethical considerations of using AI, emphasizing the importance of using AI in a way that benefits all stakeholders.
In summary, Easylibpal facilitates the integration and use of AI algorithms in a manner that is accessible and beneficial across various domains, from enhancing communication and creative endeavors to revolutionizing daily life and promoting a paradigm shift in technology interaction. This integration not only streamlines the application of AI but also ensures that its benefits are harnessed responsibly for the betterment of society.
USING EASYLIBPAL OVER TRADITIONAL AI LIBRARIES OFFERS SEVERAL BENEFITS, PARTICULARLY IN TERMS OF EASE OF USE, EFFICIENCY, AND THE ABILITY TO APPLY AI ALGORITHMS WITH MINIMAL CONFIGURATION. HERE ARE THE KEY ADVANTAGES:
- Simplified Integration: Easylibpal abstracts the complexity of traditional AI libraries, making it easier for users to integrate classic AI algorithms into their projects. This simplification reduces the learning curve and allows developers and data scientists to focus on their core tasks without getting bogged down by the intricacies of AI implementation.
- User-Friendly Interface: By providing a unified platform for various AI algorithms, Easylibpal offers a user-friendly interface that streamlines the process of selecting and applying algorithms. This interface is designed to be intuitive and accessible, enabling users to experiment with different algorithms with minimal effort.
- Enhanced Productivity: The ability to effortlessly instantiate algorithms, fit models with training data, and make predictions with minimal configuration significantly enhances productivity. This efficiency allows for rapid prototyping and deployment of AI solutions, enabling users to bring their ideas to life more quickly.
- Democratization of AI: Easylibpal democratizes access to classic AI algorithms, making them accessible to a wider range of users, including those with limited programming experience. This democratization empowers users to leverage AI in various domains, fostering innovation and creativity.
- Automation of Repetitive Tasks: By automating the process of applying AI algorithms, Easylibpal helps users save time on repetitive tasks, allowing them to focus on more complex and creative aspects of their projects. This automation is particularly beneficial for users who may not have extensive experience with AI but still wish to incorporate AI capabilities into their work.
- Personalized Learning and Discovery: Easylibpal can be used to enhance personalized learning experiences and discovery mechanisms, similar to the benefits seen in academic libraries. By analyzing user behaviors and preferences, Easylibpal can tailor recommendations and resource suggestions to individual needs, fostering a more engaging and relevant learning journey.
- Data Management and Analysis: Easylibpal aids in managing large datasets efficiently and deriving meaningful insights from data. This capability is crucial in today's data-driven world, where the ability to analyze and interpret large volumes of data can significantly impact research outcomes and decision-making processes.
In summary, Easylibpal offers a simplified, user-friendly approach to applying classic AI algorithms, enhancing productivity, democratizing access to AI, and automating repetitive tasks. These benefits make Easylibpal a valuable tool for developers, data scientists, and users looking to leverage AI in their projects without the complexities associated with traditional AI libraries.
2 notes
·
View notes
Text
picard: very well. you have your duties. dism-
BAGOCK!
picard: what in-! Mr. Data is that... a.... a chicken?"
BAGOCK!
data: (putting finger gently on chickens beak) shhhhhhh. yes sir. (chicken quiets down) specifically a "rhode island red" chicken aged 2 years, 18 days, 5-
picard: commander data, would you care to explain to me what the hell a chicken doing is doing in the observation lounge?
riker: (smiling all goofy like) i didn't realize you hired a new member of the senior staff.
picard: >_>
data: this chicken is not a member of the enterprise crew. rather, i have brought it with me to help me understand human nature.
picard: mr. data.... (sigh) how is having a living, breathing chicken with you during a senior staff meeting supposed to help you understand the human condition?
data: allow me to explain. in my analysis of human literature surrounding human emotion, I have found over 62,000 occurrences of the concept of "fear" and the word "chicken" in close proximity. for example, in the 1985 film back to the future, the character of "marty mcfly" becomes self conscious about--
picard: (shifts in his chair and looks at geordi, who shrugs)
data: --whenever the word "chicken" is used against him as an insult. Additionally, in the 1987 film "Spaceballs"-
riker: (looking around the room smiling) "space...balls?"
picard: mr. data that's enough!
data: pardon me sir. then you understand my reasoning in keeping this chicken nearby as i perform my duties? in order to better understand the human experience of fear?
picard: mr. data. I-! (sighs and sits back in chair) mr. data prior to this meeting, i've have spent the past 12 hours staring at one of the fish in my ready room. when.... (leans in) when i close my eyes, i can still see it. in my imagination! like it's right here in front of me. (starts to stare off into the distance) even now, i see its face staring back at me. sometimes... sometimes I almost think it's smiling (slowly starts to smile and chuckle to himself)
...
geordi: captain?
picard: (startled) apologies. (sigh) now, the point i intend to make is that in this moment, i don't even have the mental capacity to explain the abject lunacy of keeping a chicken in your lap while you serve as a member of my crew. now i'm going to have to order you to dispose of the chicken--
mr. data: bethany.
picard: -what?
data: the chicken's name is bethany.
picard: (looks around and brings down the tone of his voice) I'm going to have to ask you to dispose of...bethany... immediately.
data: i see sir. i am sorry, i did not realize bethany's presence would cause offense. i will immediately take her to shuttlebay 2 and decompress the airlock.
riker: I need to see this
geordi: right be behind you commander-
picard: dismiss-- wait! airlock!? mr. data that chicken is a living being! you can't simply...jettison it into space like...like an empty cargo container!
data: i apologize sir. i believe i misunderstood your intent. you see, when humans use the word "dispose" in relation to a living being, it is often meant with the connotation of causing death or irreparable injury. additionally, i have found humans traditionally place little value on the lives of chicken and other birds of poultry. current replicator logs show that over 80% of crew meals consist of cooked chicken meat. even during today's lunch captain, replicator activity shows you consumed a quote "chicken salad sand"-
picard: enough mr. data! (sigh, facepalms and rubs his temples)
geordi: wait data, how did you even get a chicken aboard the ship?
data: excellent question, geordi. i used the replicator in my quarters to synthesize a chicken egg, as these are often used in the cooking of breakfast foods. I then incubated it until the chicken was ready to hatch.
geordi: ...incubated it?
data: yes. i-
barkley: i-i'll take it
picard: mr. barkley?
barkley: the..the chicken. i...i can keep it.
geordi: wait, reg. you mean you're gonna keep it in your quarters?
barkley: y-yes. if that's. well. if that's alr-
picard: mr. barkley. this is an extraordinary responsbility. are you sure you are prepared to take on the duty of caring for this lifeform - no. bethany. until she reaches a healthy maturity?
barkley: a-absolutely.of course. i'll be sure to show her plenty of l-love... care. care. and attention. i'll. i'll keep her safe. you have my word.
picard: very well. mr. data, surrender the chicken to mr. barkley. dismissed.
i'm stopping this here i can't keep writing this
3 notes
·
View notes
Text
I'm a data nerd, and this will probably not be interesting to anyone else, but I tracked stats on What It All Could Be while I posted and decided to perform some analyses because I'm a loser with nothing else to do with my time. The fic is now complete, but today is the day I would have updated, so I figured it was a good day to cap tracking and look at what's going on.
*This is data analysis for my own pleasure. It's not in any way meant to boast, induce guilt, etc. I like doing this stuff because I find it interesting (and it's the part of my big girl job that makes me want to tear my hair out the least).
Chaptered fics are a long game. I think every fanfic writer knows, anecdotally, that with each chapter posted, hits go up a lot and kudos go up a little.
Here's something less anecdotal:
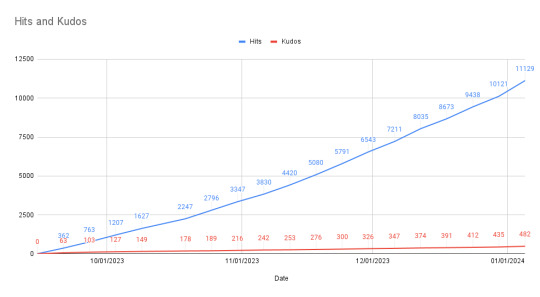
I captured current hits and kudos each time I updated What It All Could Be. As one can see, both increased chapter-over-chapter, but the hits rise at a far greater magnitude than kudos. This is understandable. Unless a reader uses a workaround, they can only leave one kudos on a chaptered fic, but each time they visit, it's registered as a hit, so hits will naturally increase more than kudos. More on kudos in a bit.
As far as hits per chapter, there was a relatively steady-ish increase over time with a big jump when the final chapter and epilogue were posted. The trendline does go up over the course of the fic, and even at the end, it's pretty much in line with the trend of the data I posted before. Notably though, there are a few chapters that clocked less hits than the chapters immediately before them (I'm looking at you, Chapters 8, 15, and 17).

Chapters 8 and 15 were posted on Tuesdays, along with Chapter 4. This leads me to believe if a writer is looking for readers, Tuesday probably isn't the day to post (but this assumption is based entirely on a chaptered fic updated regularly, and three data points is not enough to draw real, significant conclusions. I'd be interested to see this same kind of data on one-shots.). Chapter 17 was posted on a Sunday, which happened to be Christmas Eve, and in the following week, people in large swaths of the world had far more important things to do than read fanfic. They should have been eating, drinking, and being merry. I only did one other update on a Sunday, Chapter 10, so I'm not drawing any conclusions on posting on Sundays.
Now for kudos.

This is pretty much what I expected. Relatively steady kudos across chapters while updating, and then a spike at the end after the fic was completed. I know there are readers who won't read WIPs, but keep tabs on them to read as soon as they're complete.
As for who was leaving kudos...
At the time of this post, What It All Could Be has 482 kudos, 252 from users, 230 from guests.
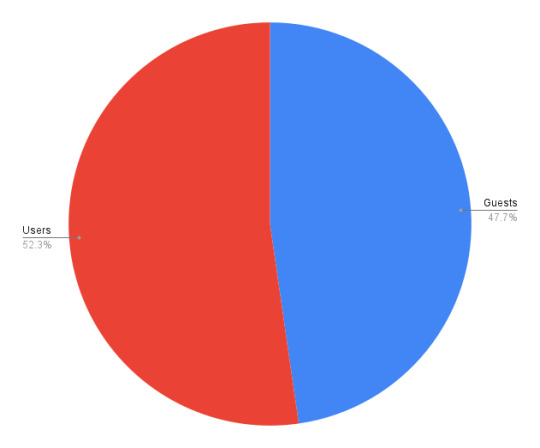
This shocked me a little. Based on previous fics posted, I expected the user/guest kudos ratio to be more in favor of users. I didn't think it would be almost evenly split. I don't think readers are "gaming" Ao3 to any great extent, e.g. using different IP addresses to leave guest kudos, using an incognito session, or logging out to leave a guest kudos after leaving one as a logged in user. But I still would be interested in seeing actual unique reader kudos. The only way I can think to test this would be to lock a fic for Ao3 users only, because then a guest wouldn't be able to see the fic at all to leave kudos in the first place. 🤔
Now it's time to turn to comments.
Here are hits, kudos, and comments, side by side.

Since I try to reply to comments, I calculated comments per chapter by taking the total number of comments on a chapter and divided it by two. You can see hits go up, but engagement (if you want to call it that) stays steady chapter to chapter. Even at the end, there's no great "spike" in comments. And as to who leaves comments, at the time of this post, What It All Could Be has 276 comment threads per my Ao3 stats page. 63 unique users left comments on the fic, a few of whom left comments on every chapter and led to some really thought-provoking discussion on soulmarks (I love you guys 😘).
Anyway, I had fun doing this, and, again, it's not meant as anything more than stupid analyses of stuff that doesn't really matter, done for my own enjoyment. I might do it again on a one-shot someday because I'm a data nerd and I like graphs, but we shall see. ✌️
2 notes
·
View notes
Text
Streamlining Safety and Efficiency: Virtual Inspection Services in the Modern World
In the ever-evolving landscape of public safety, the need for innovative solutions to enhance efficiency and streamline operations is paramount. This is where virtual inspection services come into play, transforming traditional safety procedures into modern, tech-savvy processes. Revcord is at the forefront of this revolution, offering cutting-edge solutions such as audio logging for public safety and NG911 Call Logging.

Audio Logging for Public Safety:
Audio logging for public safety is a critical component of public safety. It allows emergency services to record and archive emergency calls, ensuring a comprehensive database for future reference, training, and quality control. Revcord audio logging solutions provide secure, cloud-based storage, making it easy to access and manage critical audio data. This not only helps in verifying and improving response procedures but also aids in ensuring the highest standard of service during emergencies.
NG911 Call Logging:
The Next Generation 911 (NG911) is an advanced system that enables the public to make emergency calls via various communication methods, including text, multimedia messages, and voice calls. With NG911 Call Logging from Revcord, these interactions are seamlessly recorded and stored for later analysis. This invaluable data can help in assessing response times, improving protocols, and, most importantly, saving lives.
Virtual Inspection Services:
Virtual inspection services are changing the way safety inspections are conducted. By leveraging technology, public safety organizations can remotely assess and monitor facilities, ensuring compliance with safety regulations.
Relying on a cloud-based platform, Revcord virtual inspection services provide a secure and efficient way to perform inspections remotely. Features like real-time video streaming, image capture, and annotation tools make the process smooth and reliable.
In conclusion, Revcord is leading the charge in enhancing public safety with innovative solutions such as audio logging, NG911 Call Logging, and virtual inspection services. These tools not only increase efficiency but also contribute to the safety of communities across the modern world. Embracing these technologies is a crucial step in streamlining public safety operations and improving overall effectiveness.
2 notes
·
View notes
Text
Article from 2020
The rapid decline of mountain caribou has alarmed both biologists and government officials and prompted an aggressive response. In 2015, British Columbia placed a bounty on wolves, which the province believed to be a key threat to the ailing herds. The sanctioned cull is estimated to have killed more than a thousand of the apex predators.
...
In 2019, an influential study suggested that culling wolves and creating fenced refuges for pregnant females could help stem the demise of mountain caribou. The government of British Columbia cited the paper’s findings to establish an expanded wolf cull, believed to have killed more than 460 wolves in the last year – part of the province’s multimillion-dollar caribou recovery plan.
But after running their own simulations, a team of researchers at the University of Alberta concluded that killing wolves wasn’t saving the caribou in areas where caribou were most vulnerable and at risk
In a new paper, published in the journal Biology and Conservation, the researchers used the same data results from the 2019 paper, but added a null model – a “self-check” meant to determine if a pattern is real, or just part of a random variation – to their statistical analysis of areas where caribou are declining.
The team could find no statistical support for claims that culling wolves and penning in pregnant caribou offset population decline – especially in the most vulnerable cases.
In the case of the endangered Wells Grey herd in central British Columbia, which has suffered one of the worst population declines, the researchers found that wolves weren’t even a major predator: bears, cougars and wolverines were far more deadly.
...
Environmental groups opposed to the cull have welcomed the findings. Wolves have been an easy villain, but a focus on predation ignores a more complex web of factors in the decline of the caribou, they argue.
“When you remove top level apex predators, like wolves, you see a collapse of ecosystems from insects to riparian areas, to the predator prey relationship to the forest cover itself,” said Ian McAllister, executive director at Pacific Wild, a conservation organisation. “Wolves in every meaning of the word are being used as a scapegoat for government negligence.”
Spribille and his colleagues believe habitat degradation, in the form of clear-cut logging practices, inflicts far greater harm on the caribou. By chopping down old trees, loggers remove critical food sources, as well as valuable shelter. It takes roughly 80 years for a forest to mature to the point that it produces a suitable amount of lichen, says Spribille, the main staple of the mountain caribou.
2 notes
·
View notes
Text
What is Solr – Comparing Apache Solr vs. Elasticsearch

In the world of search engines and data retrieval systems, Apache Solr and Elasticsearch are two prominent contenders, each with its strengths and unique capabilities. These open-source, distributed search platforms play a crucial role in empowering organizations to harness the power of big data and deliver relevant search results efficiently. In this blog, we will delve into the fundamentals of Solr and Elasticsearch, highlighting their key features and comparing their functionalities. Whether you're a developer, data analyst, or IT professional, understanding the differences between Solr and Elasticsearch will help you make informed decisions to meet your specific search and data management needs.
Overview of Apache Solr
Apache Solr is a search platform built on top of the Apache Lucene library, known for its robust indexing and full-text search capabilities. It is written in Java and designed to handle large-scale search and data retrieval tasks. Solr follows a RESTful API approach, making it easy to integrate with different programming languages and frameworks. It offers a rich set of features, including faceted search, hit highlighting, spell checking, and geospatial search, making it a versatile solution for various use cases.
Overview of Elasticsearch
Elasticsearch, also based on Apache Lucene, is a distributed search engine that stands out for its real-time data indexing and analytics capabilities. It is known for its scalability and speed, making it an ideal choice for applications that require near-instantaneous search results. Elasticsearch provides a simple RESTful API, enabling developers to perform complex searches effortlessly. Moreover, it offers support for data visualization through its integration with Kibana, making it a popular choice for log analysis, application monitoring, and other data-driven use cases.
Comparing Solr and Elasticsearch
Data Handling and Indexing
Both Solr and Elasticsearch are proficient at handling large volumes of data and offer excellent indexing capabilities. Solr uses XML and JSON formats for data indexing, while Elasticsearch relies on JSON, which is generally considered more human-readable and easier to work with. Elasticsearch's dynamic mapping feature allows it to automatically infer data types during indexing, streamlining the process further.
Querying and Searching
Both platforms support complex search queries, but Elasticsearch is often regarded as more developer-friendly due to its clean and straightforward API. Elasticsearch's support for nested queries and aggregations simplifies the process of retrieving and analyzing data. On the other hand, Solr provides a range of query parsers, allowing developers to choose between traditional and advanced syntax options based on their preference and familiarity.
Scalability and Performance
Elasticsearch is designed with scalability in mind from the ground up, making it relatively easier to scale horizontally by adding more nodes to the cluster. It excels in real-time search and analytics scenarios, making it a top choice for applications with dynamic data streams. Solr, while also scalable, may require more effort for horizontal scaling compared to Elasticsearch.
Community and Ecosystem
Both Solr and Elasticsearch boast active and vibrant open-source communities. Solr has been around longer and, therefore, has a more extensive user base and established ecosystem. Elasticsearch, however, has gained significant momentum over the years, supported by the Elastic Stack, which includes Kibana for data visualization and Beats for data shipping.
Document-Based vs. Schema-Free
Solr follows a document-based approach, where data is organized into fields and requires a predefined schema. While this provides better control over data, it may become restrictive when dealing with dynamic or constantly evolving data structures. Elasticsearch, being schema-free, allows for more flexible data handling, making it more suitable for projects with varying data structures.
Conclusion
In summary, Apache Solr and Elasticsearch are both powerful search platforms, each excelling in specific scenarios. Solr's robustness and established ecosystem make it a reliable choice for traditional search applications, while Elasticsearch's real-time capabilities and seamless integration with the Elastic Stack are perfect for modern data-driven projects. Choosing between the two depends on your specific requirements, data complexity, and preferred development style. Regardless of your decision, both Solr and Elasticsearch can supercharge your search and analytics endeavors, bringing efficiency and relevance to your data retrieval processes.
Whether you opt for Solr, Elasticsearch, or a combination of both, the future of search and data exploration remains bright, with technology continually evolving to meet the needs of next-generation applications.
2 notes
·
View notes
Text
CONSULTATION SERVICES – TMCS

National Instruments software has been a technical pioneer and leader in virtual instrumentation for than four decades, a groundbreaking notion that has altered the way engineers and scientists in business, government, and academia approach measurement and automation. Everything from prototyping and probability analysis to project management and the integration of third-party software and hardware may be done quickly.
TMCS is a National Instruments, USA Silver Alliance Partner (system integrator/applications expert) capable of handling system design, system integration, and applications engineering utilizing any combination of National Instruments' high-performance software and hardware solutions.
OUR CAPABILITIES INCLUDE
Turn-key Systems Engineering
Software Development for Measurement, Data Acquisition, and Control Applications
System Engineering, Hardware and Software for Sophisticated Networks for Distributed Data Acquisition and Control Systems
Design and Assembly of Complete Control Panels and their Integration
Data Acquisition Systems
Data Acquisition Systems often referred, as the process of digitizing data from the world around us so it can be displayed, analyzed and stored in a computer. DAQ system applications are usually controlled by software programs developed using various programming language such as C, C++, Python, NI LabVIEW.
Data acquisition is a critical component of contemporary test and measurement systems, and National Instruments LabVIEW (short for Laboratory Virtual Instrument Engineering Workbench) is a prominent software tool for this purpose. LabVIEW is a graphical programming language that enables engineers and scientists to rapidly and simply construct unique test and measurement applications.
One typical use for NI LabVIEW is the creation of test benches, which are systems meant to automate the testing of electrical or mechanical components. These test bench may be used to do functional testing, stress testing, and other sorts of testing, and they can considerably increase the efficiency and accuracy of testing operations.
NI 6001 Multifunction I/O- Based System
USB Multifunction I/O Device – 8 AI (14-Bit, 20 KS/s), 2 AO (5 KS/s/Ch), 13 DIO

Description:
Multifunction I/O device
32-bit Counter
Data Logging
Portable Measurements
Data Acquisition system for Verification Validation
NI CDAQ 9185 for Data Acquisition
CompactDAQ Chassis – 4-Slot, TSN-Enabled Ethernet CompactDAQ Chassis

Description:
Controls Timing Synchronization between NI modules and host
Connectivity Options – USB, Ethernet, Wi-Fi
Multiple Hardware timed operations
For limited channel count data acquisitions which needs measurement from multiple networks, signals and sensors, the Compact DAQ is the ideal choice.
NI CDAQ 9181 for Data Acquisition
CompactDAQ Chassis 1 Slot, Ethernet CompactDAQ Chassis

Description:
Created for compact, decentralized sensor measurement systems.
Manages the timing synchronization of NI modules with the host
May be used to produce a mix of analogue, digital, and counter/timer measurements by combining C Series I/O modules.
NI 9234 for Vibration Monitoring system
C Series Sound and Vibration Input Module, 2-Channel, 102.4 KS/s/Ch Simultaneous, ±5 V

Description:
Vibration and Sound Input Module
software-selectable coupling for AC/DC
IEPE short/open detection,
Signal conditioning for IEPE
Signal conditioning for IEPE
Comes with the NI DAQmx driver setup tool.
Supports Python, C++, and NI programming environments.
The system calculates displacement, velocity, and acceleration.
2 notes
·
View notes
Text
Top 6 Best Network Sniffing Tools In 2022 - A Complete Guide

Top 6 Best Network Sniffing Tools In 2022 - A Complete Guide
Knowing what’s going on with your network from moment to moment is the only way to troubleshoot issues swiftly and avoid downtime.
There are lots of tools that give you on-the-fly insights into network performance, but not all are created equal. To help you find the right network sniffer, we’ve ranked the best of the bunch on the market right now.
SolarWinds
As well as supplying products including service desk software for IT departments, SolarWinds also has an impressive Network Performance Monitor package, part of which is the Network Packet Sniffer.
As the name suggests, this is capable of quickly identifying the causes of performance snafus, while ensuring that the data that it delves into is displayed in a coherent way.
Another benefit of this tool is that it lets you sift through network traffic according to the different types of applications that are being used across the infrastructure. Thousands of apps are supported natively, including common social media solutions, communications services, cloud storage products and much more besides.
Auvik
Like SolarWinds’ offering, there’s a lot to be said about the user-friendliness of Auvik’s competing network sniffing tool.
You don’t need to be a mastermind to work out what’s being tracked and analyzed by the software, and this kind of shallow learning curve is very useful in any new tool that’s in line for adoption at your organization.
It’s also worth noting that this service is browser-based, which is convenient in terms of not being reliant on a local installation, or being beholden to a specific OS ecosystem.
Wireshark

So far we’ve discussed network sniffing tools that offer free trials, but require payment to unlock the full functionality of the premium experience in the long term.
With Wireshark, you get an open source tool that’s free to employ and is backed up by a large community of users, along with a vast knowledge base which you can draw upon to make the most of it.
It supports Windows, Linux, MacOS and other platforms, and makes it easy not only to track traffic, but also export the data that’s gathered in whatever format you prefer for additional analysis and reporting elsewhere.
ManageEngine
The NetFlow Analyzer from ManageEngine may have a fancy name, but it also manages to have a clear and unfussy interface and a solid set of capabilities that make it worth considering alongside its better known rivals.
You can use it to identify patterns in network traffic, and to oversee the ebb and flow of resource usage, logging everything as time passes and empowering admins with the info they need to make improvements to performance.
Paessler
Paessler’s PRTG platform is a wide-ranging monitoring solution in the same vein as SolarWinds’ equivalent suite, and factors in monitoring for traffic from the web, alongside things like file transfers and mail servers as well.
As you’d expect from an enterprise-focused tool, it comes at a price, but you can try it out for free for up to 30 days before committing, which is helpful for budget management.
One selling point of this tool is that it offers support for mobile operating systems like Android and iOS, and so is arguably more flexible than some of its rivals.
TCPDump
The most basic of network sniffing is provided by TCPDump, which is entirely command-line based and follows the open source approach to development. You’ll need to get to grips with the syntax it deployed to execute user instructions, but once you have it’s a lightweight and efficient monitoring solution.
The thing to remember is that you can always change how you monitor your network, so don’t get wedded to one tool if there’s a better option out there.
Read the full article
4 notes
·
View notes
Text
If you did not already know
CoinRun
In this paper, we investigate the problem of overfitting in deep reinforcement learning. Among the most common benchmarks in RL, it is customary to use the same environments for both training and testing. This practice offers relatively little insight into an agent’s ability to generalize. We address this issue by using procedurally generated environments to construct distinct training and test sets. Most notably, we introduce a new environment called CoinRun, designed as a benchmark for generalization in RL. Using CoinRun, we find that agents overfit to surprisingly large training sets. We then show that deeper convolutional architectures improve generalization, as do methods traditionally found in supervised learning, including L2 regularization, dropout, data augmentation and batch normalization. …
Randomized Principal Component Analysis (RPCA)
Recently popularized randomized methods for principal component analysis (PCA) efficiently and reliably produce nearly optimal accuracy – even on parallel processors – unlike the classical (deterministic) alternatives. We adapt one of these randomized methods for use with data sets that are too large to be stored in random-access memory (RAM). (The traditional terminology is that our procedure works efficiently out-of-core.) We illustrate the performance of the algorithm via several numerical examples. For example, we report on the PCA of a data set stored on disk that is so large that less than a hundredth of it can fit in our computer’s RAM. Read More: https://…/100804139 …
SFIEGARCH
Here we develop the theory of seasonal FIEGARCH processes, denoted by SFIEGARCH, establishing conditions for the existence, the invertibility, the stationarity and the ergodicity of these processes. We analyze their asymptotic dependence structure by means of the autocovariance and autocorrelation functions. We also present some properties regarding their spectral representation. All properties are illustrated through graphical examples and an application of SFIEGARCH models to describe the volatility of the S&P500 US stock index log-return time series in the period from December 13, 2004 to October 10, 2009 is provided. …
Paraphrase Adversaries from Word Scrambling (PAWS)
Existing paraphrase identification datasets lack sentence pairs that have high lexical overlap without being paraphrases. Models trained on such data fail to distinguish pairs like flights from New York to Florida and flights from Florida to New York. This paper introduces PAWS (Paraphrase Adversaries from Word Scrambling), a new dataset with 108,463 well-formed paraphrase and non-paraphrase pairs with high lexical overlap. Challenging pairs are generated by controlled word swapping and back translation, followed by fluency and paraphrase judgments by human raters. State-of-the-art models trained on existing datasets have dismal performance on PAWS ( https://analytixon.com/2022/10/22/if-you-did-not-already-know-1865/?utm_source=dlvr.it&utm_medium=tumblr
2 notes
·
View notes
Text
Understanding SQL Server Integration Services (SSIS)
In today’s fast-paced business environment, data integration is crucial for effective decision-making and business operations. As organizations collect data from multiple sources—ranging from on-premises databases to cloud-based services—integrating and transforming this data into usable information becomes challenging. This is where SQL Server Integration Services (SSIS) comes into play.
SQL Server Integration Services (SSIS) is a powerful data integration tool included with Microsoft SQL Server that allows businesses to extract, transform, and load (ETL) data from various sources into a centralized location for analysis and reporting. In this article, we’ll dive deep into SSIS, exploring its core functionalities, benefits, and its importance in modern data-driven environments. We will also highlight how SSIS-816 improves data integration efficiency in the conclusion.
What is SQL Server Integration Services (SSIS)?
SSIS is a component of Microsoft's SQL Server database software that can be used to perform a wide range of data migration tasks. It is a scalable, high-performance ETL platform that simplifies data management, whether it’s importing large datasets, cleansing data, or executing complex data transformations.
SSIS provides a user-friendly graphical interface within SQL Server Data Tools (SSDT) to create packages that manage data integration tasks. These packages can be scheduled to run automatically, allowing businesses to automate their data flow between systems.
Key Features of SSIS
1. Data Extraction, Transformation, and Loading (ETL)
SSIS is primarily used for ETL tasks. It can connect to various data sources such as SQL databases, Excel spreadsheets, flat files, and web services to extract raw data. This data is then transformed using SSIS tools to cleanse, filter, and manipulate it before loading it into the target destination.
2. Data Integration
SSIS allows for the seamless integration of data from multiple sources, enabling businesses to merge data into a single, coherent system. This is especially useful for organizations with complex infrastructures that include various data types and storage systems.
3. Data Cleansing
Poor data quality can severely impact business decisions. SSIS provides advanced data cleansing capabilities, including de-duplication, validation, and formatting. This ensures that businesses work with accurate, consistent, and high-quality data.
4. Workflow Automation
One of the most powerful features of SSIS is its ability to automate workflows. Businesses can set up SSIS packages to run automatically at scheduled intervals or trigger them based on specific events. This means that repetitive tasks such as data loading, transformations, and reporting can be fully automated, reducing manual intervention and saving time.
5. Error Handling and Logging
SSIS provides robust error-handling features, allowing users to identify and resolve issues during data integration. It logs errors and failures in the process, ensuring transparency and enabling efficient troubleshooting. This reduces downtime and helps maintain data accuracy.
6. Data Transformation Tools
SSIS offers a range of transformations such as sorting, aggregating, merging, and converting data. These transformations allow businesses to manipulate data according to their needs, ensuring it is in the proper format before loading it into a destination database.
Conclusion:
In conclusion, SQL Server Integration Services (SSIS) is a powerful solution for businesses looking to integrate and manage their data efficiently. With advanced ETL capabilities, automation, and error handling, SSIS can transform the way companies handle data, providing a robust foundation for analytics and business intelligence. Tools like SSIS-816 further enhance these capabilities, making data integration more streamlined, accurate, and reliable for modern enterprises.
0 notes
Last Seen Blogs

marvelladiesimagines
Imagines of the Women of Marvel

guribrahim
İsimsiz

fodaa-vida
Composure

gatohijo
Horny Guy

m4rk3rr
★