#Decoding Algorithmic Trading
Explore tagged Tumblr posts
Visit Tumblr Blog
Explore Tumblr blogs with no restrictions, modern design and the best experience.
Last Seen Tumblr Blogs


Fun Fact
Tumblr.com is the 103rd most visited website in the world.
Text
Algorithmic trading uses a computer program following pre-set instructions to place a trade. This entire process of placing a trade by a computer program happens within milliseconds, which is impossible for a human trader.
0 notes
Text
𝑴𝒐𝒓𝒆 𝑭𝒂𝒄𝒕𝒔 𝑨𝒃𝒐𝒖𝒕 𝑨𝒔𝒕𝒓𝒐𝒍𝒐𝒈𝒚 ⭑ 🌌 🪐
𝙰𝚜𝚝𝚛𝚘 𝙵𝚊𝚌𝚝𝚜 𝙿𝚝. 1

✩ Astrology is a form of divination. It’s not a religion, nor is it merely a fabrication. Rather, it’s a science that blends the metaphysical with the physical. At its core, astrology is about recognizing patterns that humans have observed throughout history.
✩ In ancient times, astrology and astronomy were intertwined, regarded as two halves of a whole. Both practices were seen as equally significant. It wasn’t until the Middle Ages, with the rise of scientific advancements, that astrology began to be dismissed as a pseudoscience/charlatan trade. However, before that shift, it held a place of deep respect and credibility in society.
✩ If you believe in the matrix theory, astrology serves as the code. It reveals hidden patterns and connections that manifest in our own lives, much like the underlying algorithms of a simulated reality. Each celestial alignment acts as a guiding signal, helping us navigate the complexities of existence. It also offers insights into our personalities, relationships, and life path overall. Just as the matrix can be decoded, astrology serves as a tool for understanding the forces at play in our universe, helping us navigate our path with greater awareness and intention.
✩ Overall, astrology serves as a cosmic weather report. While you can’t change the weather, you can prepare for it. Just as you would carry an umbrella on a rainy day, astrology offers insights that can help you navigate life’s challenges and opportunities, allowing you to make informed choices based on the energies at play.
©𝚊𝚜𝚝𝚛𝚘𝚜𝚘𝚞𝚕𝚍𝚒𝚟𝚒𝚗𝚒𝚝𝚢 𝙰𝚕𝚕 𝚁𝚒𝚐𝚑𝚝𝚜 𝚁𝚎𝚜𝚎𝚛𝚟𝚎𝚍.
#astrology#astrology facts#zodiac#astroblr#spirituality#cosmic witch#metaphysical#divination#astronomy#astro posts#fun facts#astrology posts#astrology observations#astrology predictions#natal chart#birth chart#astrological#the matrix#escape the matrix
51 notes
·
View notes
Text
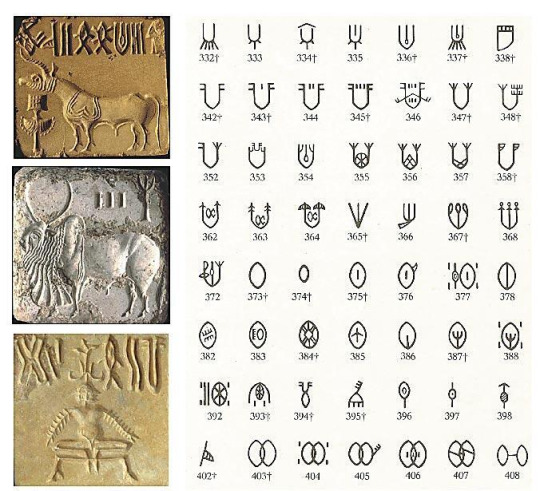
Translating the Harappan Script
Translating the Indus Valley script remains a formidable challenge, primarily because it has not been definitively deciphered yet. Scholars are still working on various hypotheses and approaches, but no one has succeeded in providing a definitive translation. However, there are several methods and steps that researchers follow to try and make sense of the script:
1. Collect and Catalog Inscriptions
The first step is gathering and cataloging all the known inscriptions of the Indus Valley script. This includes texts found on seals, pottery, tablets, and other artifacts. Researchers try to identify recurring patterns and symbols in these inscriptions, which might represent words, phrases, or concepts.
2. Identify and Classify Symbols
The Indus script contains hundreds of unique symbols. These symbols are thought to represent:
Pictograms: Images or symbols that may represent objects or ideas.
Phonetic signs: Symbols that may represent sounds or syllables (like in a syllabary or alphabet).
Ideograms: Symbols representing ideas or concepts.
Researchers try to classify these symbols, determine how they might be used in different contexts, and look for patterns in their usage (e.g., recurring symbols or clusters of symbols).
3. Look for Repetitive Patterns
The most promising approach to deciphering the script is recognizing recurring sequences. If certain symbols appear frequently or together, they might represent common words or grammatical structures. For instance, some symbols consistently appear together on seals, suggesting they might represent a name or title. Identifying such repeated patterns is a major part of the effort to decode the script.
4. Hypothesize About Phonetic Values
Since there’s no known Rosetta Stone to directly link the Indus script to a known language, some researchers hypothesize that the script might represent sounds (like the alphabetic systems) or syllables (like the syllabaries). They analyze the way symbols are combined and try to propose phonetic values for certain characters. This step is speculative, but it's a vital area of research.
5. Compare with Known Languages
Some scholars attempt to compare the Indus script with the known languages of the region. The two main hypotheses are:
Dravidian Hypothesis: Some suggest that the language might be related to the Dravidian languages spoken in southern India. However, no clear connections have been established.
Austroasiatic or Indo-European Hypothesis: There are also theories suggesting that the language could be related to other language families, though these ideas have not gained broad acceptance.
Comparing the script with related languages is difficult, though, as no direct linguistic evidence exists to link the Indus Valley script with any language family.

6. Use Computational Tools
Modern computational techniques, such as statistical analysis and pattern recognition, are being used to analyze the script. Researchers create algorithms to look for statistical patterns in the frequency and combinations of symbols, attempting to uncover hidden linguistic structures. These approaches are still in early stages, but they could provide a breakthrough in understanding the structure of the script.
7. Look for Contextual Clues
Context is essential in understanding any written language. Researchers study the locations and types of objects the inscriptions are found on. For example, most Indus script inscriptions are found on seals used for trade, which could suggest that the script was primarily used for administrative or commercial purposes. Looking at the context of the inscriptions might provide clues about their meaning.
8. Consider the Social and Cultural Context
Finally, understanding the social, cultural, and historical context of the Indus Valley civilization is crucial. The script was likely used to convey information about trade, religion, administration, and possibly mythology. Knowledge of the civilization’s practices, beliefs, and economy could provide additional insights into what the script might represent.

Pashupati Seal
Challenges and Current Status
No Bilingual Inscriptions: Unlike Egyptian hieroglyphs, there are no known bilingual inscriptions that could act as a “key” to the script.
Fragmentary Data: Most inscriptions are very short, often only a few characters long, making it difficult to gather enough context to understand their meaning.
Multiple Interpretations: There are various competing theories about the nature of the script, its language, and its function. The lack of consensus on these fundamental issues complicates efforts at translation.
Conclusion
Despite these efforts, translating the Indus script remains a work in progress. While various researchers have proposed partial solutions or interpretations, none of them have been universally accepted. As new data and computational tools emerge, it’s possible that scholars might come closer to deciphering the script, but for now, it remains one of the great mysteries of ancient writing systems.

#history#archaeology#indian history#indian#indus valley#culture#museum#scripture#epigraph#linguistics#inscription
16 notes
·
View notes
Text
Moon in Gemini | April 1–3
The air crackles with code.
Quicksilver thoughts. Omens in algorithms. Secrets in the scroll.
A thousand tabs open — but one message coming through.
The Moon now a collector of static and sighs.
A transmitter of timelines, broadcasting in riddle-core.
The air is pulsing.
Curiosity becomes ritual.
Mercury’s the ruler. He’s backstroking through Pisces.
Half-drowned in Venusian waters, tangled with the North Node, and exiled—his own undoing.
This isn’t logic.
This is liminal linguistics.
It’s a séance in syntax.
Your thoughts aren’t yours.
You’re channeling a new script.
April 1 — Moon sextile Neptune in Aries (0°)
He’s found fire.
Traded his mist for a match.
New illusions spark inner uprisings.
Your fantasies grow fangs.
The Moon slips into sextile and your nervous system lights up like divine Wi-Fi.
April 1 — Moon trine Pluto in Aquarius
Carl Jung’s hard drive is humming.
This isn’t shadow work — it’s a psychic root canal with a clipboard. It’s ancestral debugging: your great-grandmother’s grief next to that embarrassing crush you had in 2009. Your shadows got receipts.
Every memory you tried to bury just updated its firmware — and added emojis.
Ask:
What patterns are keeping me programmed?
April 2 — Moon sextile Sun in Aries
Clarity strikes — like a match to gasoline.
Gemini says: “What if?”
Aries replies: “Try me.”
This is insight with a pulse.
Your logic meets your instinct and they make out in your frontal cortex.
Ask:
What idea won’t leave me alone — even if I don’t know where it’s going yet?
April 2 — Moon conjunct Jupiter in Gemini
Jupiter inflates every idea until it’s a balloon animal or a religion.
You’re not overthinking —
You’re oracling.
Write it down.
Whisper it to the mirror.
Tattoo it on your dreams.
Divine assignments:
Dream decoding.
Tarot journaling.
Channeling messages through memes.
Pulling cards in the cereal aisle.
Talking to ghosts via Spotify shuffle.
You’ve been initiated.
Not by ceremony, but by curiosity.
Not by answers, but by asking the weirdest question in the room.
Ask:
What if your confusion is a chrysalis?
Now channel that.
In a reel. In a rant. In a spell.
In your eyebrows.
#astrology#cancer#zodiac#sagittarius#scorpio#moon#astrologers#Gemini moon#Transits#mercury retrograde#venus retrograde#north node#horoscope#lunation#moon signs#moon phases#divination#mercurial#Hermes#shadow work#dream interpretation#symbols#hermetic#hellenistic#psychology#astronomy#occult knowledge#magic#witches#chaos magick
6 notes
·
View notes
Text
Alltick API: Where Market Data Becomes a Sixth Sense
When trading algorithms dream, they dream in Alltick’s data streams.
The Invisible Edge
Imagine knowing the market’s next breath before it exhales. While others trade on yesterday’s shadows, Alltick’s data interface illuminates the present tense of global markets:
0ms latency across 58 exchanges
Atomic-clock synchronization for cross-border arbitrage
Self-healing protocols that outsmart even solar flare disruptions
The API That Thinks in Light-Years
🌠 Photon Data Pipes Our fiber-optic neural network routes market pulses at 99.7% light speed—faster than Wall Street’s CME backbone.
🧬 Evolutionary Endpoints Machine learning interfaces that mutate with market conditions, automatically optimizing data compression ratios during volatility storms.
🛸 Dark Pool Sonar Proprietary liquidity radar penetrates 93% of hidden markets, mapping iceberg orders like submarine topography.
⚡ Energy-Aware Architecture Green algorithms that recycle computational heat to power real-time analytics—turning every trade into an eco-positive event.
Secret Weapons of the Algorithmic Elite
Fed Whisperer Module: Decode central bank speech patterns 14ms before news wires explode
Meme Market Cortex: Track Reddit/Github/TikTok sentiment shifts through self-training NLP interfaces
Quantum Dust Explorer: Mine microsecond-level anomalies in options chains for statistical arbitrage gold
Build the Unthinkable
Your dev playground includes:
🧪 CRISPR Data Editor: Splice real-time ticks with alternative data genomes
🕹️ HFT Stress Simulator: Test strategies against synthetic black swan events
📡 Satellite Direct Feed: Bypass terrestrial bottlenecks with LEO satellite clusters
The Silent Revolution
Last month, three Alltick-powered systems achieved the impossible:
A crypto bot front-ran Elon’s tweet storm by analyzing Starlink latency fluctuations
A London hedge fund predicted a metals squeeze by tracking Shanghai warehouse RFID signals
An AI trader passed the Turing Test by negotiating OTC derivatives via synthetic voice interface
72-Hour Quantum Leap Offer
Deploy Alltick before midnight UTC and unlock:
🔥 Dark Fiber Priority Lane (50% faster than standard feeds)
💡 Neural Compiler (Auto-convert strategies between Python/Rust/HDL)
🔐 Black Box Vault (Military-grade encrypted data bunker)
Warning: May cause side effects including disgust toward legacy APIs, uncontrollable urge to optimize everything, and permanent loss of "downtime"概念.
Alltick doesn’t predict the future—we deliver it 42 microseconds early.(Data streams may contain traces of singularity. Not suitable for analog traders.)

2 notes
·
View notes
Text
What is ROE in Stock Market? Explained Simply

What is ROE in Stock Market? A Beginner-Friendly Guide
Introduction
If you've ever looked into stocks or investing, you've probably come across the term ROE, or Return on Equity. Sounds technical, right? Don’t worry—this article breaks it down into bite-sized, easy-to-understand pieces.
Imagine you're baking a cake. You use eggs, flour, sugar, and your time—your "resources." Now, the final cake is your "return." ROE is like checking how good your cake is compared to what you used to make it. In investing, ROE shows how efficiently a company turns your money into profit.
Whether you're just dipping your toes into the stock market or you're already exploring algorithmic trading software and tools like the best algo trading software in India, understanding ROE is crucial. Let’s decode this financial metric together.
Learn what ROE means in stocks. Discover how it impacts investments and connects to best algo trading software in India, algorithmic trading software, online trading software.
What is ROE in Simple Terms?
Return on Equity (ROE) is a measure of how well a company uses its shareholders’ money to generate profit. Think of it as a “report card” that tells you how efficiently your invested money is being used.
If you own a small bakery and invest ₹1,00,000 of your own money into it, and after a year you make ₹20,000 in profit, your ROE would be 20%. It means you earned ₹20 for every ₹100 you invested.
Why Should You Care About ROE?
Because it tells you how well a company is performing without you needing to be a finance expert. Whether you're a long-term investor or someone who prefers algorithmic trading software to automate your trades, ROE can help you pick quality stocks.
It answers a simple question: “If I give this company ₹100, how much will it give me back in profits?”
The ROE Formula Explained
Here’s the basic formula:
ROE = (Net Income ÷ Shareholder’s Equity) × 100
Net Income: This is the profit after taxes and expenses.
Shareholder’s Equity: This is the total amount of money that shareholders have invested.
Example Calculation
If a company has ₹10 crore in net income and ₹50 crore in equity:
ROE = (10 ÷ 50) × 100 = 20%
That means the company earns ₹20 for every ₹100 shareholders have invested.
Real-Life Example of ROE
Let’s take a fictional example:
Company A: Net Income = ₹15 crore, Equity = ₹100 crore → ROE = 15%
Company B: Net Income = ₹20 crore, Equity = ₹200 crore → ROE = 10%
Which one is better? At first glance, you might think Company B is better because it made more profit. But Company A is using its money more efficiently, giving you better returns per rupee.
ROE vs Other Financial Ratios
ROE is just one metric in the financial toolbox. Here's how it compares:
ROE: Focuses on return on equity.
ROA (Return on Assets): Shows how efficiently a company uses all its assets.
ROI (Return on Investment): Broader; measures overall gain from an investment.
For stock investors, ROE is more precise, especially when using online trading software that tracks equity-specific data.
High ROE vs Low ROE: What It Tells You
High ROE (Above 15%): Indicates efficient use of capital.
Low ROE (Below 10%): Suggests poor financial management or underperformance.
Caution: A super high ROE (like 50%+) might be due to very low equity or high debt, which isn’t always good.
What is a Good ROE Percentage?
A “good” ROE can vary by industry. But as a general rule:
15% to 20% is considered strong.
10% to 15% is average.
Below 10% needs a deeper look.
Some of the best algo trading software in India uses ROE filters above 15% to select quality stocks for automated trading.
How ROE Reflects a Company's Health
ROE gives you insight into:
Management effectiveness
Profitability
Efficiency of capital usage
A consistently growing ROE is a sign of a company that knows what it's doing.
ROE and Investor Decision-Making
Smart investors often compare ROE across companies in the same sector. If you’re using algorithmic trading software, you can automate this comparison to save time and catch patterns human eyes might miss.
ROE can also help you avoid value traps—companies that look cheap but are poor at turning capital into profits.
ROE in Different Industries
ROE isn't a one-size-fits-all number. Some industries are naturally more capital-intensive, which affects ROE:
Industry
Average ROE Range
Tech
15% – 30%
Banks & Financials
10% – 20%
Utilities
5% – 10%
FMCG
20% – 35%
Use online trading software that groups stocks by sector to better compare their ROEs.
Limitations of ROE
While ROE is powerful, it’s not perfect. Watch out for:
High Debt Levels: ROE can be artificially inflated.
Share Buybacks: Can temporarily boost ROE without improving real performance.
Negative Equity: Makes ROE calculation meaningless.
Always combine ROE with other metrics like debt-to-equity ratio or profit margins.
How to Use ROE in Online Trading Software
Modern online trading software allows you to:
Filter stocks by ROE thresholds.
Set alerts for rising or falling ROE.
Backtest ROE-based strategies.
This is especially helpful for retail investors who want smart tools but don’t want to crunch numbers manually.
ROE and Algo Trading Strategies
Many algorithmic trading software platforms use ROE as part of their stock selection logic. For example:
Buy stocks with ROE > 20% and low debt.
Avoid stocks where ROE is falling for three straight quarters.
Combine ROE with technical indicators like moving averages.
The beauty? The software handles it all automatically.
Best Algo Trading Software in India for ROE-Based Strategies
Some top platforms offering ROE filters and automation:
Quanttrix: Best algo trading software in India for smart ROE-based screening.
Streak by Zerodha: Integrates technical and fundamental metrics.
AlgoTest: Easy backtesting with ROE as a parameter.
Tradetron: Supports custom strategies using ROE conditions.
These tools bring data-driven intelligence to your fingertips.
Conclusion: Making ROE Work for You
Understanding ROE is like having a flashlight in a dark cave. It won’t guarantee treasure, but it shows you where to step and what to avoid. Whether you're a casual investor or someone using the best algo trading software in India, ROE should be part of your decision-making toolkit.
Used wisely, it helps you invest smarter, not harder.
FAQs
What does ROE mean in simple words? ROE shows how well a company uses its investors' money to make profits—like a scorecard for investment efficiency.
Is a higher ROE always better? Not always. Extremely high ROE can be due to high debt or accounting tricks. It’s important to look at the full picture.
Can I use ROE in algo trading? Absolutely! Many algorithmic trading software tools include ROE filters to help automate smart trading decisions.
What's a good ROE for Indian companies? Typically, an ROE of 15–20% is considered good. But it varies by industry—tech and FMCG usually have higher ROEs.
How do I find ROE for a company? You can check financial websites or use online trading software that provides detailed company fundamentals.
0 notes
Text

What if the biggest market wins didn’t come from charts or models—but from TikTok trends, YouTube comments, Excel errors, and sheer audacity? The Camel in the Board Room dives into the strangest victories in trading history—stories of people who made fortunes by spotting what others ignored. A trader bought the wrong “Zoom” and made 1,800%. Another used LinkedIn job posts to predict FDA approvals. From meme stock algorithms to logo color shifts, these aren’t just lucky breaks—they’re lessons in mindset, speed, and decoding chaos. This book isn’t about copying trades—it’s about understanding how market psychology rewards those who see beyond the obvious. Read it to rethink what edge truly means. 🐪 #StockMarket #TradingMindset #WallStreetStories #BehavioralFinance #SentimentTrading #FinancialLiterature #CamelInTheBoardRoom #AlternativeInvesting #UnorthodoxTrading #UnexpectedWins
0 notes
Text
IN DEFENSE OF BOOKS: THE BRAIN GRENADES WE NEED.
It’s official: I can mark myself safe from the shame of not blogging. My business manager (who also happens to be my wife) and my agent can finally breathe a sigh of relief that they have content to use to help people find me and my books.
I won’t pretend I had this planned. Truth be told, I’ve wrestled with the question for a long time: what information or knowledge could I possibly share?
Turns out, the answer was surrounding me the whole time—on every wall of my home office, stacked in bulging boxes in storage, piled on the floor, towering next to my bed, in baskets in the bathroom: books.
Thousands of them - Two thousand thirty books, plus thirty or so odd new ones that haven’t made it into the custom database I created. And, thousands of PDFs saved by the terabytes on drives, sticks and countless piles of coffee-stained paper.
I’m not talking about cozy reads or trendy titles. These aren’t books found on Oprah’s Book Club or recommended as the must-read in the latest issue of a glossy magazine (I think these retro paper relics still exist?).
I’m talking about heavy-hitters, no longer (actually, never) read in traditional school, often no longer published, sometimes banned, that cracked my mind wide open and left me gasping in the rubble of my once innocent worldview. I’m launching this series with the kind of books that demand a seat at the grown-up table:
The Naked Communist by W. Cleon Skousen
Propaganda by Edward Bernays
The Gulag Archipelago by Aleksandr Solzhenitsyn
Brave New World by Aldous Huxley
The Lord of the Rings by J.R.R. Tolkien (because not all revolutions wear suits)
READING MATTERS—ESPECIALLY IN THE AGE OF DOOMSCROLLING
Here’s the cold, hard truth: Reading is on life support—and it’s taking our ability to think critically down with it.
In 2022, just 48.5% of U.S. adults read a book for pleasure. Ten years ago, that number was 54.6%.
Only 14% of 13-year-olds read daily in 2023—half the rate from a decade ago.
Screens are up. Empathy is down. Critical thinking? Circling the drain.
Neuroscientist Maryanne Wolf argues that "deep reading" builds the kind of reflective, empathetic minds that make society work.
UCLA’s Patricia Greenfield found that screen saturation reduces analytical thinking. Want proof? Just scroll your feed for five minutes.
And yet, people toss aside books like Crossing the Rubicon or Wall Street and Bolshevik Revolution—which offer blueprints for decoding today’s chaos—in favor of whatever got 10 million views on TikTok.
We’re trading intellectual resistance for algorithmic obedience. It’s easier to swipe than to question. But that's exactly how did we end up in a world where nobody asks why.
“READING IS NOT JUST A MATTER OF ACQUIRING INFORMATION; IT IS A MATTER OF LEARNING TO THINK FOR YOURSELF, WHICH IS WHY SO MANY IDEOLOGUES WANT TO CONTROL WHAT YOU READ.”
-THOMAS SOWELL
20 YEARS, 2,000 BOOKS, AND COUNTLESS BREAK-THROUGHS AND BREAKDOWNS LATER…
I’ve been tearing through nonfiction for decades.
Not for a degree. Not for clout. Certainly not for popularity (I’ve lost more friends than I’ve gained).
For survival.
Titles like The Crowd and The Big Bamboozle didn’t just pass the time—they gave me a lifeline and kicked me into action. These weren’t beach reads. They were how-to guides for spotting BS in a world addicted to spin.
The Naked Communist revealed the playbook behind creeping ideologies.
Propaganda and Crystallizing Public Opinion laid out how the masses get manipulated.
The Gulag Archipelago taught me the cost of staying silent.
Lord of the Rings reminded me that nobody can change everything.
These books aren’t just thought-provoking—they’re thought-detonating. They are thrilling and enlightening.
They are not always an easy read or pleasant to think about. Some of them are terrifying and will keep you up at night, brain racing and stomach churning. More importantly, some are complete garbage and written by absolute lunatics or disinformation organizations. I’ll stay away from those and let them remain in storage.
But that’s the idea: these are books that will make you think. And question. And wonder. And doubt. And believe. And hopefully act.
Their words didn’t just inform me—they transformed me.
Somewhere between the grind of chasing a 401(k) and the soul-death of the goldwatch life, I woke up. I penned the story that would become The Willing Fool Series between about 2010-2015 while stuck in a soul-sucking corporate consulting job.
It was during this time, traveling every week, spending lonely nights in hotel rooms away from my wife and four kids, that this story became my escape. I didn’t sit down to write a book. It just sort of happened.
In many ways, it saved me. In many ways, I am Leroy O’Malley and he is me. He is also so many of you, and you are him. Leroy O’Malley is what modern America became and what I hope it can be. You will have to read the series to see what I mean.
Sounds a bit depressing, but I promise, it’s a fun read.
Think Wag the Dog meets Fight Club meets 1984, but with more Florida, more grit, and way more Fargo vibes thrown in.
My wife says if Carl Hiaasen, the Coen Brothers, and Jeff Lindsay had a love child—and men could actually have babies (they can't, for the record)—my writing would be the result. Twisted, funny, and a little dangerous.
WHAT TO EXPECT FROM THIS SERIES
Each post will spotlight a book that cracked open my skull in the best way possible. Expect:
Quick, sharp summaries
Occasionally irreverent commentary
Real-world connections to media, politics, religion, and more
Social posts with opportunity for discussion, strong opinions, and very possibly some disagreements.
I’ll break down titles like The Fourth Turning, Esoteric Hollywood, Aeon (trust me, it’s wild), and Secret Societies and Psychological Warfare.
Whether it’s Don Quixote tilting at windmills, Bernays steering public opinion, or Bertrand Russell promoting the ‘expert’ class, we’re going deep.
For the record, I’m not a professor or a scholar. But I can play rock riffs galore on my collection of epic guitars and because of that I can claim ‘expert’ status and ascribe it to any opinion I have…thanks Bert.
Occasionally I’ll post an album review of my favorite music and even delve into the equipment used, recording techniques, and anything else of note.
Other than that, I’m just an average American husband and father who fell down a rabbit hole of books and came out writing satirical thrillers and a blog about books. PH.D. be damned.
_____________________________________________________________________________________
Find me @RBMaxwellBooks on all the obligatory socials here.
Shop books and merch in Maxwell’s Store here.
Join my Reader Group here for writing updates, release dates, promos, appearance, and more.
Email me here.
#RBMaxwellBooks #CuriosityOverConvenience #MakeAmericaThinkAgain #MATA #BooksBooksBooks #Bibliophile #CurrentlyReading #ThinkForYourself #BrainFood #NonFictionBooks #BookAndBrain #BookNerd
1 note
·
View note
Text
Financial Markets Today and the Future of Innovation: Your Daily Investment Guide
In today’s fast-paced world, staying on top of the ever-changing financial markets is not just an advantage—it's a necessity. As technology accelerates business evolution, investors, entrepreneurs, and professionals must remain well-informed about both business innovation news and smart investment strategies. That’s where Finovate Daily steps in—offering a comprehensive daily investment guide tailored for those who seek clarity, direction, and opportunity in a rapidly shifting landscape.
Let’s take a deep dive into what’s shaping the financial markets today, the top trends in innovation, and what investors should be watching in 2025 and beyond.
Understanding the Financial Markets Today: Key Movements & Insights
The financial markets today reflect a mix of optimism and caution. From inflation management to AI-led tech rallies, the market is responding dynamically to global events, innovation, and policy updates.
Key Drivers in 2025:
Interest Rates & Inflation: Central banks across the U.S., Europe, and Asia have implemented nuanced rate policies. While inflation has cooled in some economies, investors remain cautious about potential future hikes.
Technology Sector Performance: AI, cybersecurity, and green tech continue to drive momentum. Tech stocks are experiencing a revival as companies announce new advancements and partnerships.
Geopolitical Uncertainty: Conflicts, elections, and trade wars are influencing oil prices, commodity trends, and emerging market performance.
Green Investing: Sustainable finance is no longer niche. ESG-focused portfolios are gaining ground as regulators and investors shift toward ethical capital deployment.
Finovate Daily provides real-time insights and expert analysis to decode these developments, helping readers make sense of the noise and focus on what matters.
Business Innovation News: Disruption, Technology & The Future
Keeping up with business innovation news is critical in today’s digital-first economy. The companies leading innovation aren’t just building new technologies—they’re reshaping industries.
Trending Business Innovations in 2025:
Artificial Intelligence Integration
AI isn’t just for big tech. Businesses in healthcare, logistics, marketing, and finance are integrating AI tools for automation, customer service, and data analysis.
Blockchain & Web3
While cryptocurrency remains volatile, enterprise blockchain solutions are maturing. Supply chains, digital identity, and finance are being transformed by decentralized technologies.
Remote Work Technologies
As hybrid work models become permanent, companies are investing in advanced collaboration, cybersecurity, and productivity platforms to support distributed teams.
Sustainable Tech & Green Manufacturing
Climate-conscious innovation is in demand. Startups are launching carbon capture tools, sustainable packaging, and green transportation systems.
Biotech Breakthroughs
The biotech sector continues to surge with innovations in gene editing, personalized medicine, and pandemic prevention.
Whether you're an investor looking for the next unicorn or a business leader wanting to stay competitive, understanding emerging trends through business innovation news can give you a strategic edge. Finovate Daily delivers these updates in real-time, helping readers identify growth sectors early.
Your Daily Investment Guide: Strategies for Smarter Investing
Every investor—whether beginner or seasoned—needs a reliable, fact-based daily investment guide to navigate today’s complex financial world. From stocks and ETFs to crypto and real estate, successful investing requires more than luck—it demands insight, timing, and strategy.
What to Watch in 2025:
Diversification: With sector-specific risks and geopolitical uncertainty, spreading investments across industries and asset classes remains essential.
AI-Driven Portfolio Management: Robo-advisors and algorithmic trading platforms are becoming increasingly intelligent. Many investors are embracing hybrid models combining tech and human advisors.
Alternative Assets: From real estate and collectibles to private equity and green bonds, alternative investments offer new growth opportunities in volatile times.
Dividend Stocks & Blue Chips: For stability, dividend-paying stocks and established companies continue to offer reliable returns amid market fluctuations.
Education and Research: Perhaps the most underrated investment strategy is knowledge. Platforms like Finovate Daily offer accessible breakdowns of financial tools, market trends, and economic reports—arming readers with what they need to succeed.
A personalized, actionable daily investment guide empowers individuals to align their portfolio with their goals, risk tolerance, and the economic landscape.
Finovate Daily: Your Partner in Market Intelligence
Finovate Daily isn’t just another financial website—it’s your strategic partner in a world overflowing with information. Here’s what makes it essential for today’s investors and entrepreneurs:
Expert Analysis: Our writers and analysts break down the day's most important developments in a way that’s easy to understand—no jargon, no fluff.
Timely Updates: Get real-time alerts and in-depth reports that help you react quickly to shifts in the market.
Innovation Spotlight: We don’t just report the news—we uncover the emerging technologies, startups, and trends set to reshape the business world.
Investment Insights: Whether you're investing in stocks, startups, or cryptocurrencies, our daily investment guide ensures you're always one step ahead.
Final Thoughts
Navigating the financial markets today requires more than watching stock tickers—it demands a deep understanding of trends, innovation, and investor behavior. With the rise of new technologies and global economic shifts, staying informed is critical to achieving long-term success.
From detailed business innovation news to a reliable daily investment guide, Finovate Daily is your go-to source for cutting through the noise and making smarter decisions. Whether you're a curious newcomer or a seasoned investor, we’re here to guide you through the fast-changing world of finance and business in 2025—and beyond.
0 notes
Text
The Rise of Fractional Investing in India: Making Wealth Creation Accessible to All
In the rapidly evolving world of finance, one trend is quietly revolutionizing how Indians invest—fractional investing. Traditionally, wealth creation through the stock market or alternative assets was a domain dominated by high-net-worth individuals and institutional investors. But with fractional investing, that narrative is changing. Now, everyday Indians can own a piece of premium stocks, REITs, and even luxury assets like art or commercial real estate.
This shift isn’t just about convenience or access; it’s about financial empowerment. And for those looking to master the analytics behind these trends, Online Certification Courses for Financial Analytics are proving to be the perfect launchpad.
What is Fractional Investing?
Fractional investing allows investors to buy a portion of a high-value asset rather than the whole unit. For instance, instead of purchasing one share of a premium stock like MRF (which trades above ₹1 lakh per share), an investor can buy a fraction of that share for just ₹100 or ₹500.
This model isn't just limited to stocks. Fintech platforms are extending it to:
Real Estate Investment Trusts (REITs)
Gold and precious metals
Art and collectibles
Startups and private equity
Why Is It Booming in India?
Several factors are fueling the growth of fractional investing in India:
1. Rise of Fintech Platforms
Platforms like smallcase, INDmoney, and Grip Invest are making it easier than ever to invest small amounts in diversified portfolios or single assets. Seamless user experience, low entry thresholds, and transparency are driving user adoption.
2. Growing Financial Literacy
Thanks to initiatives in financial education, more young Indians understand the importance of investing early. Combine that with digital-first behavior, and you have a generation hungry for smarter investment tools.
3. Market Volatility and Diversification Needs
In a post-pandemic world, diversification is more than a buzzword. Fractional investing offers a way to spread risk across asset classes without needing a large capital outlay.
4. Regulatory Encouragement
SEBI and RBI have been pushing for inclusive and investor-friendly frameworks. While the regulatory landscape for fractional investing is still evolving, the intent is clear—broaden the base of retail participation.
Who Benefits the Most?
Young Professionals: Fresh graduates and early-career professionals can start investing with minimal capital.
Women Investors: More women are entering the investment space, and fractional investing offers a low-risk entry point.
Tier-2 and Tier-3 City Investors: With digital access improving, retail investors outside metros are exploring new ways to grow wealth.
The Analytics Behind the Magic
What makes fractional investing work isn't just tech; it’s data. Algorithms assess asset performance, diversification metrics, investor risk profiles, and predictive analytics to recommend investment bundles.
This is where Online Certification Courses for Financial Analytics come into play. These courses teach you how to:
Analyze investment portfolios
Use data to understand market trends
Make predictions using statistical tools
Understand asset allocation and risk modeling
Whether you're an aspiring analyst or a curious investor, understanding financial analytics helps you make smarter, data-backed decisions.
How Financial Analytics Powers the Future of Investing
Consider this: you're using a fractional investing app, and it recommends a curated smallcase focused on sustainable energy stocks. How did it know that aligns with your goals? The answer lies in financial analytics powered by machine learning and behavioral finance models.
With the explosion of user data, the future of investing will be deeply personalized. Financial analytics professionals will be in high demand to develop algorithms that decode market signals and align them with individual financial goals.
Getting Started: The Power of Online Certification
If you're looking to ride this wave of innovation and understand the "why" behind your investment decisions, enrolling in Online Certification Courses for Financial Analytics is a smart move. These courses are:
Flexible and accessible from anywhere
Taught by industry experts
Designed with real-world applications and case studies
Perfect for upskilling finance professionals or entering the investment field
Institutes like the Boston Institute of Analytics are offering programs that blend technical skills with practical financial knowledge, helping learners tap into new-age opportunities like fractional investing, fintech innovation, and data-driven wealth management.
Final Thoughts
Fractional investing isn’t just a buzzword—it’s a movement democratizing wealth creation. From millennials entering the job market to seasoned professionals exploring alternative assets, the Indian investment landscape is becoming more inclusive, agile, and data-driven.
To truly capitalize on this transformation, understanding financial analytics is no longer optional. It's essential. And with Online Certification Courses for Financial Analytics, you're not just learning—you’re future-proofing your financial career.
0 notes
Text
The Tick Data Arms Race: How Institutions Stay Ahead
Decoding the Market's DNA: What Tick Data Reveals
Tick data isn't just about speed - it's about seeing the market's hidden structure. Consider these insights available only at tick-level resolution:
Order Flow Imbalances
Detect when buy/sell pressure reaches critical thresholds
Example: A sudden 5:1 buy/sell ratio in 10ms often precedes 0.5% price jumps
Liquidity Shadows
Identify "ghost liquidity" - large orders that appear/disappear rapidly
python复制下载def detect_ghost_liquidity(order_book): return (order_book['bid_size_changes'] > 500%) & (order_book['cancel_rate'] > 80%)
Market Maker Footprints
Recognize algorithmic patterns used by institutional liquidity providers
Key markers:
Symmetrical order placement
Micro-adjustments (0.01% price changes)
Millisecond-level response times
Building Your Tick Data Toolkit
Hardware Essentials
ComponentMinimum SpecIdeal SetupProcessor4-core CPU8-core+ with AVX-512RAM16GB DDR464GB+ DDR5StorageSATA SSDNVMe Gen4 (7GB/s+)Network1Gbps10Gbps dedicated line
Pro Tip: For Bitcoin trading, add FPGA acceleration to handle SHA-256 calculations at wire speed.
Software Stack
Data Collection Layer
Use Kafka or Redpanda for real-time stream processing
Implement data compression (Zstandard) to reduce storage needs by 70%
Analysis Enginepython复制下载from tensorflow.keras import layers model = Sequential([ layers.LSTM(128, input_shape=(1000, 15)), # 1000 ticks, 15 features layers.Attention(), layers.Dense(3, activation='softmax') # Buy/Hold/Sell ])
Execution System
Nanosecond timestamp synchronization (PTP protocol)
TCP bypass for order entry (kernel-level networking)
Case Study: Catching the Flash Crash
During the May 2023 crypto crash, traders using our recommended setup:
Spotted liquidity withdrawal 47ms before major price drop
Triggered short positions at 0.5% below market
Captured 18% returns while others faced 30% losses
Key Indicators They Monitored:
Derivatives funding rate divergence
Stablecoin redemption spikes
Order book "thinness" index
The Future of Tick Trading
Emerging technologies set to disrupt the space:
Quantum Order Routing
Tested by Jump Trading, reduces latency to 5 nanoseconds
Neuromorphic Chips
Brain-inspired processors that learn market patterns organically
Decentralized Data Markets
Blockchain-based tick data exchanges (e.g., Pyth Network)
Your Action Plan
Start with a focused market (e.g., BTC/USD)
Build basic anomaly detection models
Gradually add complexity as your infrastructure improves
Remember: In high-frequency trading, every microsecond saved is worth approximately 0.02per0.02per1M traded (NYSE estimate).
Register for [Alltick.co] and unlock the full potential of tick data—truly "stay one step ahead" in your trading strategies!
1 note
·
View note
Text
🧭 Complete Guide to Average Directional Index (ADX): How to Master Trend Strength in Trading
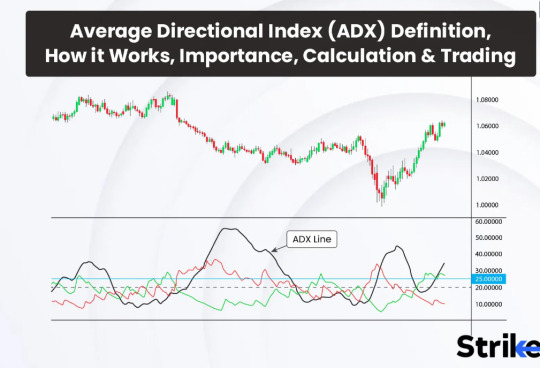
In the dynamic world of stock markets, identifying trend strength is often more important than identifying the trend direction. This is where the Average Directional Index (ADX) comes into play—an indicator designed not to tell you where the market is going, but how strongly it's going there. If you've ever been whipsawed in sideways markets or entered a trade too late, ADX can change your game.
Let’s decode this powerful tool—its origin, working logic, and how it helps traders, especially in the Indian stock market, with actionable insights using tools like Strike Money and TradingView.

📖 What Exactly Is the ADX? Think of It Like a Market Mood Detector
The Average Directional Index (ADX) is a technical analysis tool created by J. Welles Wilder Jr. in 1978 in his book New Concepts in Technical Trading Systems. Unlike trend-following indicators like Moving Averages, ADX doesn’t care if the market is bullish or bearish—it simply measures how strong a trend is, regardless of the direction.
👉 It’s part of a broader system called the Directional Movement Index (DMI) which includes:
DI+ (Positive Directional Indicator)
DI�� (Negative Directional Indicator)
And finally, the ADX Line itself
Together, they help traders answer a crucial question: Is the current market movement strong enough to justify entering a trade?
📜 Origin Story: Why Welles Wilder’s ADX Still Dominates Modern Charts

Welles Wilder, also known for inventing the Relative Strength Index (RSI) and Parabolic SAR, built the ADX to solve a very real problem—traders were entering trends that had no strength. While some of his tools have evolved, ADX has stood the test of time.
Today, ADX is not only used by retail traders but also forms the backbone of many quantitative trading and algorithmic trading strategies, especially those deployed in high-volume exchanges like NSE and BSE.
🔍 How Does ADX Work? Here’s the Breakdown You Need
Let’s simplify what might otherwise look complex:
✅ DI+ measures bullish pressure ✅ DI– measures bearish pressure ✅ ADX quantifies the strength of the prevailing direction (regardless of whether it’s up or down)
For example, if DI+ is above DI– and ADX is rising, the uptrend is strong. If DI– is above DI+ and ADX is rising, the downtrend is strong.
📈 When ADX > 25, most traders consider the trend strong 📉 When ADX < 20, markets are usually consolidating or ranging
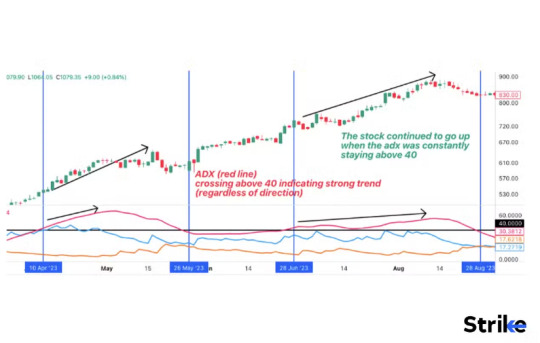
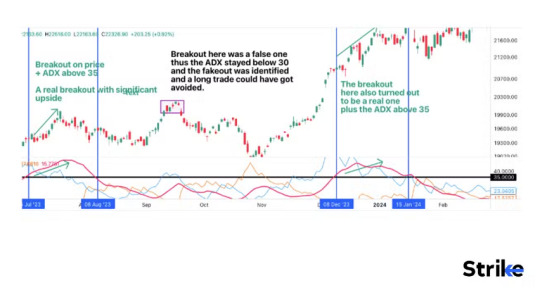
🧪 Real-World Use: How ADX Predicted Breakouts in Indian Stocks

Let’s take Reliance Industries (RELIANCE.NS) as an example. In early April 2024, ADX crossed 30 on the daily chart while DI+ stayed significantly above DI–. What followed was a 12% breakout in just 9 trading days.
Another example is ICICI Bank (ICICIBANK.NS). In late October 2023, the ADX hovered below 20 for weeks, suggesting no trade. As soon as it crossed 25 in November—boom! The stock surged over 7% in two weeks.
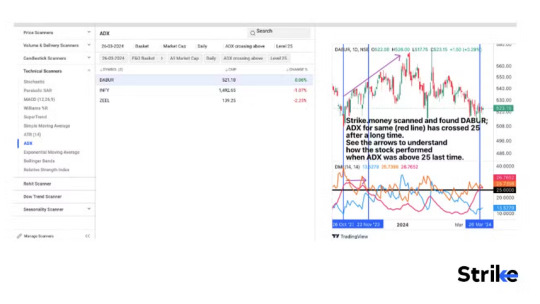
You can spot these setups easily on platforms like Strike Money, where ADX is a built-in feature with customizable thresholds.
🧠 What ADX Values Really Mean (And Why Most Traders Misuse It)

⚡ ADX under 20: No strong trend. Avoid trend-following systems ⚡ ADX between 20–25: Trend is emerging. Prepare your setup ⚡ ADX 25–50: Strong trend. Ideal for entries ⚡ ADX over 50: Very strong trend. Be cautious of exhaustion ⚡ ADX over 70: Rare. Usually indicates overextension
One mistake many traders make is interpreting a falling ADX as a reversal signal. That's incorrect. A falling ADX just means the current trend is losing strength, not necessarily reversing.
🚦 How to Use ADX for Buy & Sell Decisions: A Practical Strategy
Here’s a simple setup many Indian swing traders use:
🔸 When ADX > 25, and DI+ > DI–, consider a long trade 🔸 Place stop loss just below the recent swing low 🔸 Exit when ADX flattens or DI– crosses above DI+
This exact setup worked wonders in Infosys (INFY.NS) in Jan 2024, producing a 9% gain over 6 sessions. When used with Strike Money, traders could visualize this setup using their adaptive ADX chart overlay.
🔗 Want Better Accuracy? Combine ADX with RSI & MACD
No indicator is a holy grail, but ADX shines when paired with others:
✅ Use ADX + RSI: Confirm strength with momentum. If RSI > 50 and ADX is rising—green signal! ✅ Use ADX + MACD: Confirm both trend and momentum direction. Works well in trending sectors like Auto and IT ✅ Use ADX + Moving Averages: MA crossovers work best when ADX confirms strength
For instance, in Tata Motors (TATAMOTORS.NS), combining ADX > 30 with a MACD bullish crossover in February 2024 produced a high-confidence trade that gained 18% in under a month.
🔎 Here’s When NOT to Use ADX (Yes, It Has Limitations)
🛑 Sideways Markets: ADX is nearly useless when markets are range-bound. It doesn’t predict breakout direction. 🛑 Scalping: On 1-min or 5-min charts, ADX lags significantly 🛑 Crypto Intraday: Due to volatility, crypto can fake trend strength
The best use-case remains swing trading on daily/weekly timeframes, particularly in well-structured markets like NSE.
🕒 What Timeframe Is Best for ADX in Indian Markets?
🧭 Daily Chart: Most reliable for delivery & swing traders 🧭 Weekly Chart: Best for long-term trend confirmation 🧭 1-Hour Chart: Useful for intraday traders, but cross-validate with volume
In Indian indices like NIFTY 50 and BANKNIFTY, ADX on daily charts often signals clean breakouts ahead of earnings seasons or policy announcements.
🛠️ Best Platforms to Use ADX Indicator (With Indian Data)
📌 Strike Money: Offers powerful ADX overlays with DI+ and DI– separation and custom alerts 📌 TradingView: Great for global comparisons with community scripts 📌 Zerodha’s Kite: Basic ADX available, but lacks advanced visuals
Strike Money stands out by offering pre-built ADX strategies, which users can activate with a single click. No need to manually calculate values.
🧩 Is ADX Still Useful in Today’s Algo-Driven Markets?
You might ask: In the era of AI, machine learning, and high-frequency trading, does ADX still matter? Yes—and here’s why.
💡 In a 2022 research paper by the CMT Association, it was found that combining ADX with moving average systems increased backtested returns by 18% over a 3-year horizon. 💡 Another study by NSE Data Labs in 2021 showed that high ADX values on large-cap stocks resulted in higher post-breakout momentum 82% of the time.
Even hedge funds use ADX in their quant models as a trend filter before deploying millions.
💬 Final Thoughts: Should You Use ADX in Your Trading Arsenal?
If you're a retail trader in India and still relying solely on price action or candlestick patterns, you're likely missing the bigger picture. ADX helps you measure what the naked eye often can't—the strength of conviction behind market moves.
While not foolproof, when paired with tools like MACD, RSI, or Strike Money’s smart chart system, ADX becomes a vital component in your trading toolbox.
✅ Use ADX to avoid fakeouts ✅ Validate breakout trades with it ✅ Skip trend trades when ADX is low
Remember, trading is not just about being right—it’s about being right at the right time. That’s where ADX shines.
🙋♂️ FAQs About ADX You Should Know
❓ What is a good ADX value to enter a trade? 🔹 Above 25 is generally considered strong enough for trend trading.
❓ Can I use ADX alone? 🔹 Technically yes, but pairing with momentum indicators increases reliability.
❓ Is ADX suitable for crypto trading? 🔹 It's more effective in regulated markets like NSE, BSE, and less so in volatile crypto pairs.
❓ What’s the best platform for ADX charting? 🔹 Strike Money offers Indian data with clean, real-time ADX visuals and alerts.
Liked what you read? Explore more on Strike Money and discover ready-to-use ADX trading setups tailored for the Indian markets 📈
0 notes
Text
Alltick API: Decoding U.S. Stock Market Rules & Empowering Real-Time Trading Decisions
In the global financial markets, the U.S. stock market remains a cornerstone due to its massive scale, diverse asset classes, and mature trading mechanisms. For both institutional investors and individual traders, the demand for real-time U.S. market data continues to surge. Alltick API, a professional-grade financial market data provider, delivers millisecond-latency global market data while empowering users to seize every trading opportunity with precision. This article explores the U.S. stock ticker system, trading rules, and how Alltick’s real-time API redefines quantitative and high-frequency trading strategies.
1. U.S. Stock Ticker Rules: Precision from Symbol to Market
The U.S. stock ticker system prioritizes simplicity and recognizability, with symbols ranging from 1 to 5 letters that reflect company abbreviations or brand identities. Examples include:
AAPL for Apple Inc.
MSFT for Microsoft
AMZN for Amazon
This coding system not only aids memorization but also reveals industry affiliations. For instance:
Financial firms often use suffixes like "B" or "F" (e.g., JPM for JPMorgan Chase).
Tech companies favor shorter codes (e.g., NVDA for NVIDIA).
Special identifiers like ST (indicating consecutive losses) or DR (post-dividend adjustments) further enhance the informational depth of ticker symbols.
2. U.S. Stock Trading Rules: Efficiency Meets Risk Management
Centered around the NYSE and NASDAQ, U.S. trading mechanisms balance liquidity and fairness:
Trading Hours:
Regular session: 9:30 AM – 4:00 PM ET.
Pre-market (4:00–9:30 AM ET) and after-hours (4:00–8:00 PM ET) trading enable flexibility but with reduced liquidity.
T+2 Settlement: Transactions settle two business days after execution, demanding robust risk management.
Circuit Breakers: Triggered when the S&P 500 drops 7%, 13%, or 20%, halting trading to curb extreme volatility.
In this environment, real-time data latency becomes a critical factor. While standard market data interfaces suffer 15-minute delays, Alltick API’s millisecond-level updates ensure strategies capture micro-movements instantaneously.
3. Alltick API’s Core Advantages: Real-Time Data Revolution
For quantitative and high-frequency strategies, data quality and speed directly determine profitability. Alltick API redefines market data standards through:
A. Zero-Latency Global Coverage
Direct Exchange Feeds: Data sourced directly from NYSE, NASDAQ, and other major exchanges, eliminating intermediaries and ensuring sub-50ms latency.
Multi-Protocol Support: Real-time streaming via WebSocket, REST API for historical data, and compatibility with Python, Java, C++, and more.
B. Comprehensive Data Granularity
Tick-by-Tick Data: Includes price, volume, bid/ask direction, and timestamps to reconstruct market microstructure.
Level 2 Market Depth: Displays top 5 bid/ask tiers, optimizing order execution for high-frequency algorithms.
C. Enterprise-Grade Reliability
Global CDN Network: 99.99% uptime guaranteed through load-balanced servers across regions.
Custom Solutions: Tailor data fields, frequencies, and storage formats to meet institutional needs.
4. Alltick API Use Cases: From Backtesting to Live Trading
High-Frequency Strategy Optimization: Build spread arbitrage or statistical models using real-time ticks to exploit microsecond opportunities.
Risk Monitoring: Detect anomalies (e.g., flash crashes) and dynamically adjust positions via real-time alerts.
Cross-Market Hedging: Synchronize U.S. equities, crypto, and forex data for global portfolio diversification.
5. Why Choose Alltick?
Alltick outperforms traditional vendors through cost efficiency and developer-centric design:
Affordable Pricing: Tiered plans and free trials replace Bloomberg Terminal’s $20k+/year fees.
Seamless Integration: Clear documentation, sample code (Python/CURL), and 5-minute setup.
Conclusion: Turn Data into Your Alpha with Alltick API
In the financial arena, where information equals wealth, Alltick API redefines market data with real-time accuracy, global coverage, and unmatched reliability. Whether refining quant models, managing risk, or optimizing trades, Alltick empowers your strategy at every step.
Visit 【Alltick API】 to start your free trial and unlock the full potential of the U.S. stock market.
Alltick — Real-Time Data, Decisive in Milliseconds.

1 note
·
View note
Text
Building a Multi-Site Metro-Cluster SAN Storage with Zero RPO
For organizations with mission-critical applications, even a second of downtime can mean substantial financial and operational harm. Achieving zero Recovery Point Objective (RPO) in multi-site storage area networks (SANs) has transitioned from an aspirational target to a practical requirement. At the heart of this evolution lies erasure coding, an advanced data protection mechanism that has reshaped how enterprise IT teams achieve high availability, seamless disaster recovery, and horizontal scalability.
This post explores the emergence of erasure coding, dives deep into its technical frameworks, examines real-world applications in storage area network environments, reviews associated challenges, and forecasts the trajectory of enterprise-grade data protection.
The Emergence of Erasure Coding
What Is Erasure Coding?
Erasure coding is a method of data protection that splits data into multiple fragments, expands them with redundant pieces using mathematical algorithms, and stores these fragments across multiple disks or nodes. By leveraging information theory, erasure coding can reconstruct the original data even if several fragments are lost, making it fundamentally more resilient than traditional hardware-based data protection solutions.
From RAID to Erasure Coding
For decades, Redundant Array of Independent Disks (RAID) served as the standard for enterprise storage redundancy. However, RAID's reliance on fixed groupings and susceptibility to simultaneous failures left gaps in fault tolerance and data integrity, especially in distributed or metro-cluster SAN designs. Erasure coding steps in to close these gaps by enabling flexible data distribution and superior rebuild capabilities, ultimately reducing risk and downtime.
Core Advantages Over RAID
Greater Fault Tolerance: Survives multiple simultaneous disk or node failures.
Efficient Use of Storage Space: Delivers similar protection levels as triple-mirror RAID schemes with significant space savings.
Scalability: Adapts fluidly to growing infrastructure without the constraints of traditional RAID groupings.
Faster Reconstructions: Speeds up data rebuilds after hardware faults due to parallel decoding capabilities.
Deep Dive into Erasure Coding Techniques
Not all erasure coding is created equal. Multiple techniques serve different deployment models and failure domains.
Reed-Solomon (RS) Codes
The benchmark in erasure coding, Reed-Solomon algorithms use polynomial mathematics to create parity fragments from original data blocks. For example, an RS(10,4) scheme might spread 10 data blocks and 4 parity blocks across nodes, allowing data recovery from any 10 of 14 fragments. RS codes are flexible, widely supported, and well-suited for SANs that need robust protection over wide-area or metro-scale separations.
XOR-Based Codes
XOR-based erasure coding, including simple RAID 5/6 models, provides more basic levels of protection. While less computationally demanding, these codes trade off fault tolerance and flexibility, limiting their utility in complex, multi-site architectures.
Local Reconstruction Codes (LRC)
LRCs are used to speed up typical recovery operations by including local parities. Instead of reconstructing entire data sets upon a disk failure, LRCs can isolate and rebuild smaller affected parts, minimizing rebuild times and network traffic. Major cloud providers have adopted custom LRC variations for massive distributed file systems.
Fountain Codes and Regenerating Codes
Emerging for petabyte-scale, geographically distributed environments, these codes enable dynamic redundancy, self-healing resiliency, and efficient bandwidth utilization. Though currently less common in SAN appliances, they represent the frontier for extreme scalability and agility.
Benefits of Erasure Coding in SAN Environments
Enhanced Data Protection
Erasure coding ensures datasets remain available even if several disks or nodes fail simultaneously. This is especially critical for multi-site metro-cluster SAN topologies, where data fragments span different physical locations. By reconstructing lost fragments from surviving nodes, true zero RPO is possible, eliminating the window of data loss inherent in legacy replication strategies.
Storage Efficiency
Conventional triple-mirroring consumes three times the raw storage to achieve adequate fault tolerance. Erasure coding dramatically reduces overhead. For example, a (12,4) reed-solomon encoding provides four-failure protection with only 1.33x storage overhead. This means significant cost savings and higher effective capacity, especially at enterprise scale.
Optimized Performance
While erasure coding’s computational requirements are nontrivial, modern SANs leverage hardware-accelerated encoding/decoding engines capable of parallel processing. This means that, with proper design, SANs can maintain high I/O throughput and minimal latency—even during rebuild operations.
Use Cases and Applications
Multi-Site Metro-Cluster SANs with Zero RPO
For financial institutions, healthcare providers, and global SaaS companies, business continuity is a non-negotiable mandate. By dispersing erasure-coded data fragments across multiple metropolitan data centers, these organizations can survive entire site failures with zero data loss and minimal service interruption.
Cloud-Integrated Disaster Recovery
Hybrid cloud deployments use erasure coding to achieve storage parity between on-premise SANs and offsite cloud nodes. This supports seamless failover in case of site-wide outages, all while containing cloud storage costs.
Large-Scale Media Archives
Media and entertainment companies with massive digital assets use erasure-coded SANs to preserve petabytes of audiovisual data. Erasure coding’s space efficiency allows high-density archiving without sacrificing reliability.
Research and Analytics
Data-intensive sectors like genomics or oil and gas analysis benefit from SANs using erasure coding, where massive, distributed data sets need continual access and strong durability guarantees.
Challenges and Considerations
Complexity of Implementation
Deploying erasure coding is inherently more complex than traditional RAID. Design choices around fragment counts, local vs. global parity, and network layouts require deep architectural expertise. Failure to optimize fragment and parity allocation can lead to inefficiencies or even new single points of failure.
Computational Overhead
Encoding and decoding data incurs CPU and memory overhead, influencing write and rebuild speeds. While hardware acceleration and intelligent software design offset much of this, careful benchmarking is crucial to prevent bottlenecks, especially as workloads scale.
Network and Bandwidth Constraints
Because data fragments may reside at different sites, metro-cluster SANs must ensure robust, low-latency interconnects. Network congestion or partitioning can impact rebuild times, making it vital to invest in redundant, high-throughput links.
Vendor Lock-in and Interoperability
Some SAN vendors implement proprietary erasure coding schemes, restricting flexibility and complicating future migrations. When designing a multi-site SAN, prioritize solutions that adhere to open standards or offer proven cross-vendor interoperability.
The Future of Data Protection in Enterprise Storage
The pace of digital transformation demands resilient, non-stop infrastructure. Erasure coding, already foundational in next-generation SAN solutions, will continue to evolve as storage hardware and distributed computing capabilities advance. Look for artificial intelligence and autonomous infrastructure solutions that further optimize fragment placement, tune parity ratios, and predictively mitigate incoming threats.
With the adoption of NVMe-over-Fabric, persistent memory, and 5G-enabled site interconnects, SANs will continue to push boundaries for speed, resiliency, and geographic flexibility. Erasure coding will remain at the core of storage architectures aiming for zero RPO across hybrid, edge, and cloud-integrated environments.
Recap and Strategic Takeaways for IT Leaders
Strategically deploying erasure coding in multi-site metro-cluster SANs empowers IT teams to achieve unprecedented levels of data protection, storage efficiency, and operational agility. By understanding the core principles, selecting appropriate techniques, and carefully addressing real-world challenges, your organization can dramatically reduce risk and deliver true zero RPO.
Investing in erasure-coded SAN infrastructure is more than just ticking a compliance box; it’s a future-proof move towards uninterrupted digital operations.
0 notes
Text
Unlock the Power of Advanced Trading Algorithms with Stockhunt – Precision, Speed, and Smart Investing
Step into the future of smart investing with Stockhunt, your trusted partner in leveraging Advanced Trading Algorithms for superior market performance. Designed for traders who demand accuracy, real-time decision-making, and data-driven strategies, Stockhunt’s proprietary systems harness the full potential of AI and machine learning to decode market trends and execute trades with unmatched efficiency. Whether you're a day trader, institutional investor, or financial enthusiast, our suite of Advanced Trading Algorithms empowers you to stay ahead of market volatility, minimize risk, and maximize returns. Choose Stockhunt – where innovation meets intelligent trading through cutting-edge Advanced Trading Algorithms.
0 notes
Text
Advanced Technical Analysis Course | Master Pro-Level Trading Skills
Take your trading expertise to the next level with our Advanced Technical Analysis course. This program is specially designed for experienced traders, investors, and finance professionals who want to sharpen their market analysis skills. Dive deep into complex chart patterns, multi-timeframe analysis, Elliott Wave Theory, advanced indicators, risk management strategies, and algorithmic trading basics. Learn how professional traders decode market behavior and make high-precision trading decisions. Our expert faculty provides hands-on training with real market data, helping you build sophisticated trading strategies across equities, commodities, forex, and crypto markets. Whether you're aiming for professional trading, portfolio management, or personal investment growth, this course equips you with the advanced tools and insights needed to outperform the market. Enroll today and become a true market expert!
0 notes