#Statistical analysis
Explore tagged Tumblr posts
Visit Tumblr Blog
Explore Tumblr blogs with no restrictions, modern design and the best experience.
Last Seen Tumblr Blogs


Fun Fact
Tumblr was the first site to host the blog for President Barack Obama in 2011.
Text
The Legend of Zelda: stats of the kingdom
A Statistical Analysis of Popular Fanfiction in the Legend of Zelda Fandom on AO3
I like numbers and stats and for some unfathomable reason I find it calming. So over the past couple weeks, I’ve been making this spreadsheet!
DISCLAIMER: This is not a judgement of the quality, value, or merits of any of the fics on this list. It's just me being curious about what's popular with the Legend of Zelda fandom on AO3.
Feel free to go explore the spreadsheet. My own observations and analysis under the cut.
TL:DR, Link has a lot of kinky sex. Sidlink and Zelink are vying for who’s the most popular ship. Also, this fandom has a shit ton of sub categories that are truly islands unto themselves and have their own conventions.
Methodology: I'm including all fics from the first page of AO3 results (20 fics per page) sorted by:
Hits
Kudos
Comments
Bookmarks
Anything tagged under the Legend of Zelda and Related Fandoms tag that was in the top 20 most hits, kudos, comments, or bookmarks made it into the spreadsheet. This ended up including 51 fics in total.
I put all the fics into one single spreadsheet in order to compare the differences between fics that are really high on the kudos count but not the hit count, or what has a lot of comments but fewer hits. Basically, I'm throwing a lot of things together to observe what gets engagement and looking at patterns that emerge!
Popular fandom subcategories:
Botw (41 fics tagged as such)
Linked Universe (9, including one mostly set in the world of BOTW)
OoT (2)
(I do wonder what it would be like to run these numbers on other fanfic sites, given the popularity boom of ao3 over the last 15 years or so. But also, Botw was an insanely popular game even by Zelda standards, so… who knows?)
Tags:
Character tags: Obviously, Link was by far the most popular character, but here are the characters that had a minimum of 3 appearances per category. Yay champions!
Zelda
Sidon
Mipha
Urbosa
Revali
Daruk
Story tags: Again, just going by sheer numbers, here are the story tags that appeared at least 3 times in every category:
Slowburn
AU – canon divergence
With honorable mentions to fluff, angst, double penetration, anal sex, amnesia/memory loss, and mute or selectively mute Link, who all cracked above 3 instances in 2 separate categories.
Relationships:
This was a tight race, but shoutout to Sidlink for eking out the win for the most highly rated ship in the Zelda fandom with 13 fics qualifying in my ranking. Zelink is close behind at 10 fics. (That being said, Zelink takes it by volume: 7,797 fics tagged as Zelink vs Sidlink’s 2,193)
Other popular ships:
Revalink (8) (this one surprised me! I didn’t realize my beloved birb was so popular)
Miphlink (3)
Link/Monsters (2)
Sidon/Reader (2)
Ganzelink, Ganlink, Malink, Miphzelink, and Miphzel all made single appearances.
(Pls don’t start ship war discourse in the notes kthanx)
All right, let’s deep dive into the numbers!
Fics in all 4 categories:
Interim - starkraving
Sands of time -tirsynni
Congrats you are officially the most popular Loz fics across all of ao3! at least according to my particular scope of analysis.
Fics in 3 categories:
Displaced - socksock
Drown In Me - bacchanalia
Alone We Fight - SilvermistAnimeLover
Blood Moon Rising - MarquesGillette
Popular authors (people who show up more than once in multiple categories sorry comments georg)
MarquesGillette
MaryDragon
SilvermistAnimeLover
ObakeAri
Hits:
Top 5 most popular fics by hit count:
Displaced - socksock
Interim - starkraving
To Save Hyrule - orphan_account
Sands of time - tirsynni
Drown In Me - bacchanalia
First page by hits:
Min: 117,917 – Sidon’s Epic Pining Adventure (ObakeAri)
Max: 189,622 – Displaced (socksock)
Average: 145,385
Average wordcount for fics with the most hits:
140,909
Kudos:
Top 5 most popular fics by kudos count:
Excuse Me While I Kiss This Guy - Icka M Chif
Interim - starkraving
To My Dearest Friend - surveycorpsjean
26 Minutes and 42 Seconds - T_5Seconds
Blood Moon Rising - MarquesGillette
First page by kudos:
Min: 4917 – Finding Link (Umbreonix)
Max: 10321 – Excuse Me While I Kiss This Guy (Icka M Chif)
Average: 6981
Average wordcount for fics with the most kudos:
41,136
Comments:
Top 5 most popular fics by comment count:
Carlos from MarvelandZeldaFan's Children of the Heroes - KR5
This is an Adjuration - notfreyja
My Art - KR5
Sidon's Epic Pining Adventure - ObakeAri
Priestess of War - KR5
Woohoo! You all get to meet KR5 aka Comments Georg. Comments Georg has long conversations and RPs in the comments of their ao3 posts, which are usually fanart. TO BE CLEAR, THIS IS TOTALLY FINE AND COOL! I think it’s quite delightful! However, it does completely bork my ranking system because outside of comments, these posts do not have a lot of engagement (like, less than 100 hits and less than 20 kudos) and I don’t think they count towards my analysis of “what is popular in the Zelda fandom writ large”. But they qualified based on my criteria. Which I think speaks to the weakness of my criteria more than anything else tbh…
Anyways, shoutout to Comments Georg for truly showing off what it means to be a statistical outlier.
First page by comments:
Min: 1568 – The Quiet River Rages (MaryDragon)
Max: 43808 - Carlos from MarvelandZeldaFan's Children of the Heroes (KR5)
Average: 4131 (which goes down to 2042 if we exclude KR5’s impressive max, which is a full order of magnitude more than notfreyja in second place with 3470 comments. Very much demonstrating the power of a statistical outlier!)
Average wordcount for fics with the most comments:
275,593
Bookmarks:
Top 5 most popular fics by bookmarks count:
Interim - starkraving
Excuse Me While I Kiss This Guy - Icka M Chif
Sands of time - tirsynni
To My Dearest Friend - surveycorpsjean
Alone We Fight - SilvermistAnimeLover
First page by bookmarks:
Min: 973 – Expatriate (thehoyden)
Max: 2984 – Interim (starkraving)
Average: 1468
Average wordcount for fics with the most bookmarks:
70,027
Fic Ratings:
G: 3 (literally all fanart from KR5)
T: 22
M: 8
E: 17
Unrated: 1
Observations:
I ran this twice. Once including crossovers, and once excluding crossovers. This filtered out a lot of large drabbles and things like “flash fiction fuckings” which, no judgment, you do you, they just weren’t super relevant for what I was looking for. If you wanna see these stats including all the multifandom stuff that shows up, here’s the link for that:
https://docs.google.com/spreadsheets/d/1DXDKXutIzVC-Iac93fFSDohAkphrn67yV-DmRt9xXmU/edit?usp=sharing
(I’m going to break academic professional analysis here and get on my soapbox for a sec – please don’t post big multifandom one shots where you tag like 20 different fandoms and every single kink that gets written about across 103 different chapters. This is literally what series are for. These kinds of things just clog up the tags, and it also makes it harder for people to find the things you’ve written that they want to read! I know this was a convention on ff.net, but this is not ff.net! We can make authors' lives and readers' lives easier!)
There were 38,427 fics in the tag “Legend of Zelda and Related Fandoms” (including crossovers, that goes up to 41,634). I manually added one back in though because it was entirely a botw story, just loosely inspired by another game.
Linked Universe fans comment a LOT. Strong correlation between high comment and Linked Universe fandom subsection. Y’all are very involved and active, and you show support to your authors. I salute you!
Sidlinkers, y'all are horny and I respect it.
Zelinkers, dear god we do love a slowburn.
All the most highly kudos’d fics are very low in the comment count. It’s almost an inverse correlation.
Excluding crossovers increased the correlation between hits and kudos quite dramatically.
There were not very many au’s other than canon divergence. Only one modern au as far as I could tell from a cursory examination of tags.
Lots more clustering, far less disparity between min and max numbers than when I ran this with A:TLA numbers.
Far less consensus on a vibe. Way fewer big writers, but lots of little writers doing their own thing.
Truly a lot of E fics. We are horny bastards.
We need more stuff written for games other than BOTW!!
There aren’t as many fics that are like “oh everyone in the fandom has read these fics”. There are probably those fics in each subcategory of the fandom, or within the specific ships, but there aren’t as many general fics that have entire fandom-wide appeal.
Thank you for reading! This was a lot of fun, and I hope you found it interesting. Shoutout to the Hateno Hangout discord for helping me refine this mess :P
Further shoutout to my partner who helped with writing some SQL to help with tag analysis. Truly partner of the year.
If you want more of this kind of egregious nerdiness, I did this with the top fics in the A:TLA fandom a couple weeks ago: https://www.tumblr.com/cooking-with-hailstones/751749202663669760/statistical-analysis-of-the-most-popular-atla
#the legend of zelda#legend of zelda#tloz#loz#ao3#archive of our own#fandom analysis#fandom stats#zelda stats#linked universe#sidlink#zelink#zelda#link#sidon#stats analysis#stats of the kingdom#statistical analysis
111 notes
·
View notes
Text
"average Antivan Crow plots 3 potentially-treasonous schemes a year" factoid actualy just statistical error. average crow plots 0 high stakes schemes per year. Politics Georg Magpie de Riva, who eats dreams and plots over 10,000 schemes each day, is an outlier adn should not have been counted
#crow thoughts#magpie files#spiders georg#statistical analysis#crow rook#rook de riva#antivan crows#the antivan crows#antivan crow politics
21 notes
·
View notes
Text
HI! So as previously promised I was doing some statistical analysis of the "The Wheel of Fortune" tarot from Balatro, here is an update


The next update will be at 100 uses
10 notes
·
View notes
Text

Live blogging in class currently learning about standard deviation 🔥🔥🔥
17 notes
·
View notes
Text
A note on Katharine Birbalsingh and Michaela Community School
The media narrative surrounding Michaela Community School in London mostly goes like this: Katharine Birbalsingh transforms poor inner-city (read: ethnic minority) children into academic superstars through the power of discipline. Thomas Chatterton Williams’s recent essay (full text here) in The Atlantic is merely the latest in a long line of fawning profiles that tout, implicitly or explicitly, Birbalsingh's iron fist as the solution to all that ails Britain. However, no article I have read so far has investigated other explanations for Michaela's high Progress 8 score nor endeavored to deconstruct the popular narrative surrounding the conservative superstar.
Williams begins the body of this piece by pointing out that Michaela “draws nearly all its students from Wembley, one of the poorest districts in London” in an apparent attempt to cast them as would-be low achievers, if not for Birbalsingh’s intervention. Although the characteristics of the individual pupils who attend Michaela have a greater impact on results than those of the school's neighborhood, he doesn’t bother to investigate how they differ. Among Michaela pupils who sat GCSEs over the past three years and whose prior attainment at Key Stage 2 (measured by an exam at the end of primary school) were available, 31% were high achieving, 53% were middle achieving, and only the remaining 16% were low achieving. For those who are uninterested in learning the nuances of British exam scoring, that means Michaela’s pupils were exceptionally bright even before they entered the school.
Birbalsingh furthers her savior narrative by describing Michaela's intake with unquantifiable terms such as "challenging" or "inner-city." However, only 28 of Michaela's 2024 GCSE takers (24%) were disadvantaged per the government's definition, "those who were eligible for free school meals at any time during the last 6 years and children looked after," in line with the national average of 25%. Although Birbalsingh likes to advance the narrative that she improves the academic performance of poor children—to be fair, she does, at a rate of roughly 30 individuals per year—she mostly improves the GCSE performance of middle class children.
Michaela's pupils are also self selecting, and therefore they are not representative of pupils in Wembley, London, or the UK as a whole. Any pupil who wishes to attend state secondary school in London must fill out a form indicating their top six choices, and they will be placed in one of those schools based on geography, demand, and availability. A pupil who does not wish to attend Michaela can leave it off their application, guaranteeing they won't attend. Therefore, Michaela is left with an intake of pupils who largely want to be there. By my calculations, Michaela's classwork and homework demand just over 49 hours of work each week. Although this does lead to good results, many teenagers would not abide by this; the 40-hour workweek is taxing even for most adults, who are blessed with more waking hours. Michaela's model and results cannot be easily repeated at any given school—at least not without systematic exclusion.
Williams unintentionally misrepresents a statistic when he asserts that “More than 80 percent of Michaela graduates continue their studies at Russell Group Universities.” He lacks a sufficiently deep understanding of the British school system to interpret this figure. While Michaela’s website states that 82% of its 2021 sixth form alumni attended a Russell Group university, it does not provide data on the university attendance of graduates from its secondary school, the disciplinarian institution which Williams profiles.
In the UK, sixth form (years 12 and 13, spent studying for A-levels) is separate from secondary school (years 7 through 11; the last 2 years, KS4, are spent studying for GCSEs). For Michaela, this also means a different admissions process. While there are no academic minimums to enroll in the secondary school, the sixth form requires an impressive average GCSE score of 7. Michaela has the capacity to enroll 120 students in each year of sixth form. However, the sixth form was under-enrolled by half in 2024. Michaela is a publicly-funded school, so this begs the question as to why state resources are not being utilized to their maximum capacity. The sixth form could educate more students simply by lowering GCSE requirements, but that would of course lead to less impressive university admissions—the kind that may not be displayed on Michaela’s home page. It is also possible that some secondary teachers would be pulled away to teach A-level subjects, worsening GCSE results, but that is speculation.
Thus far, all discussions of Michaela’s results have been woefully incomplete because they have not examined the effect of its narrow curriculum on its exam scores, instead focusing on the behaviorism that makes Birbalsingh’s authoritarian acolytes salivate. Williams's article is no different, only mentioning in passing that she believes “the national curriculum might force her to lower her own standards.” Depending on what changes the new Labour government implements, a revised national curriculum may indeed clash with Michaela’s philosophy. The school directs virtually all of its resources toward preparing pupils for its narrow selection of GCSE subjects or the few non-GCSE subjects that are required by the current national curriculum, such as PSHE, music theory, or PE. Birbalsingh is so focused on GCSE revision that she does not even believe volunteer work to be a "financially viable" option for Michaela pupils. Michaela's extra-curricular clubs all have a marginal cost of practically zero. In fact, several of them directly support curricular subjects, so they should rightfully be considered part of GCSE preparation.
A narrow curriculum obviously allows pupils to spend more time studying each GCSE subject they sit, thereby increasing their exam scores. Since most of the GCSE-level classes that Michaela offers are mandatory, pupils have little freedom to choose their own subjects (more on that later). Aside from that, cohort sizes stay remarkably close to 120 from year to year, and the school seems to impose a soft cap on classes of 30 pupils (120 / 4 = 30), so Michaela can hire the exact number of teachers it needs each year on a full-time basis. The school never needs to "waste" money hiring teachers for undersubscribed subjects, so it can also raise test scores by investing more in its core subjects than schools with broader curricula can afford to. On the flip side, Michaela does not offer dramatic arts, orchestra, individual sciences, computing, design and technology, foreign languages besides French, or a whole host of other popular subjects at the GCSE level. Other schools could easily raise their GCSE scores by slashing their curricula down to Michaela levels, but they offer a variety of classes because they care about their pupils experiencing joy and exploring a variety of career paths more than they care about their P8 scores.
For years, all of Michaela’s pupils have studied the same subjects at GCSE with some slight variations. A handful of pupils always sit for exams in heritage languages, but otherwise, the following paragraphs demonstrate approximately how the subject breakdown has looked over the past three years. (Earlier data has been distorted by COVID, or it is incomplete or outdated.) At the time of publication, 2024 data can be found here, while older results can be accessed through the link “Download data (1991-2024)”.
- 2022: 100% of pupils: English language, English literature, combined science, mathematics, religious studies. ~75%: French, geography/history. ~25%: Citizenship. ~25%: Art & design: photography, art & design: fine art. (I had to recreate this year from memory because individual subject entries do not appear to be retained in older data, but it is accurate to the best of my recollection.)
- 2023: 100% of pupils: English language, English literature, combined science, mathematics, religious studies. ~75%: French, geography/history. ~25%: Art & design: photography, art & design: fine art.
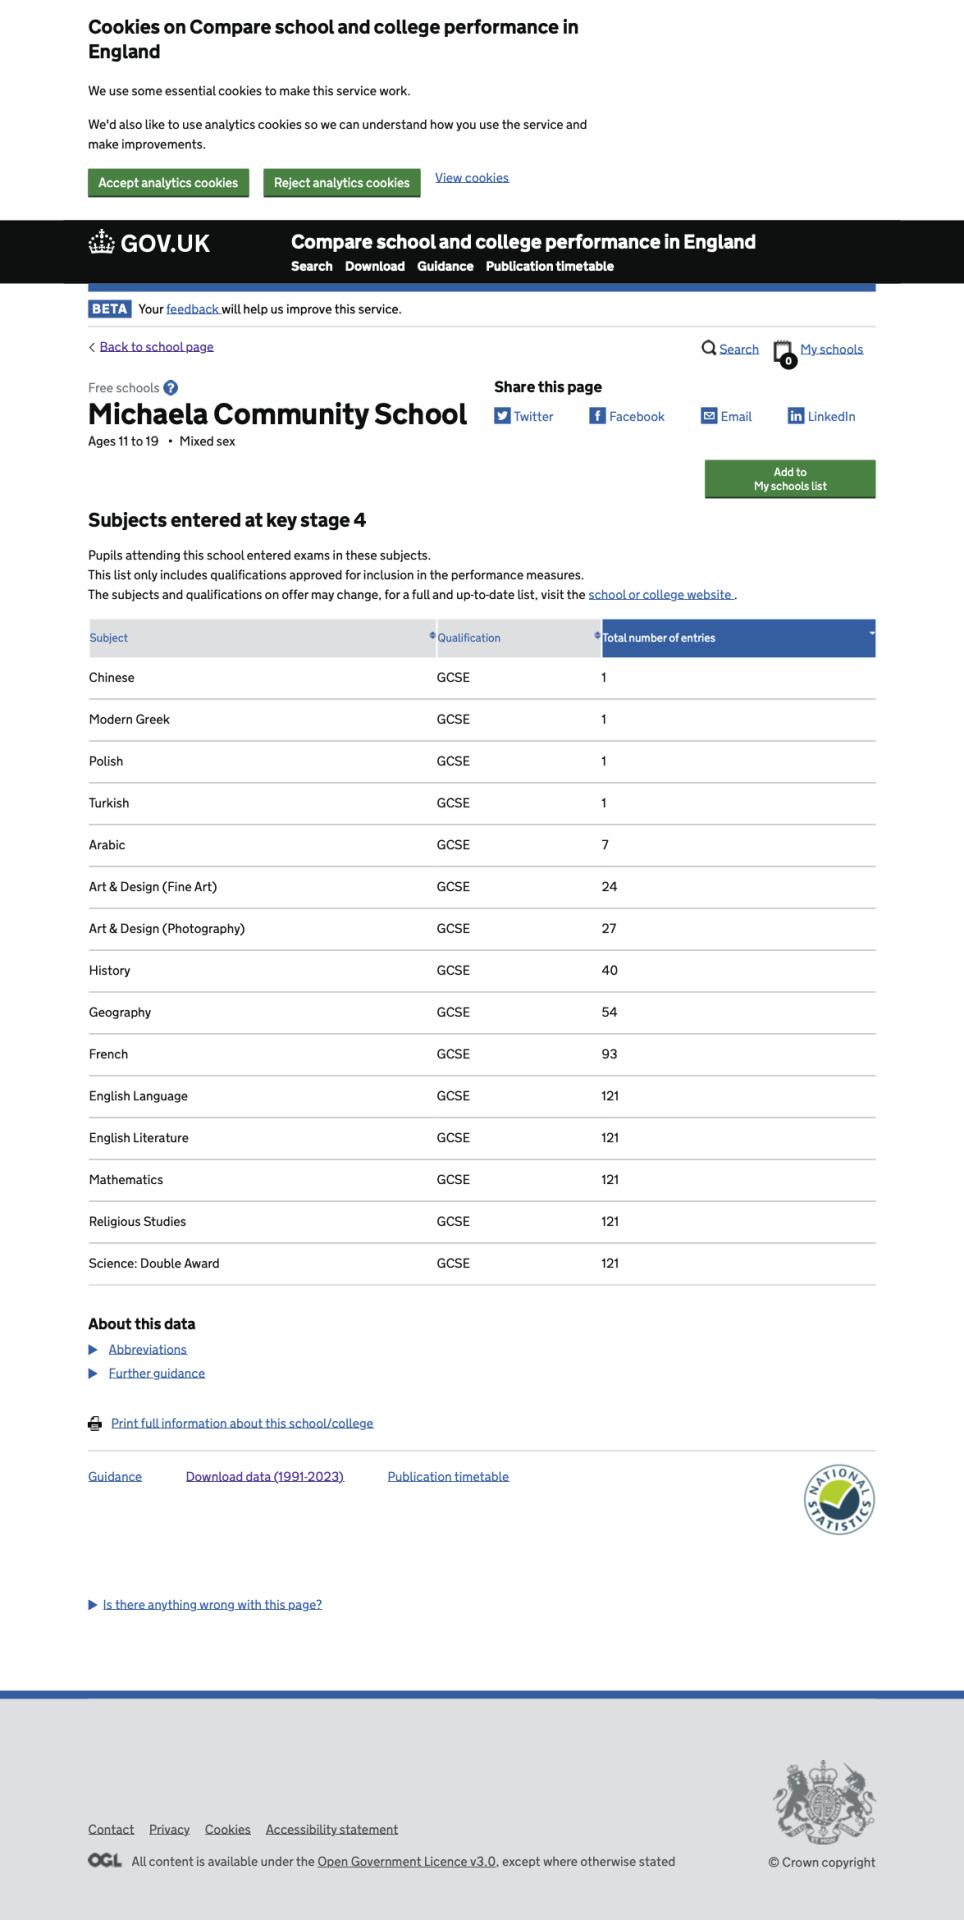
- 2024: 100% of pupils: English language, English literature, combined science, mathematics, religious studies, French. * ~80%: Geography/history. ~20%: Art & design: photography.
*This year, 3 pupils sat for biology, chemistry, and physics separately instead of taking combined science, but there is no explanation for this on Michaela's website.
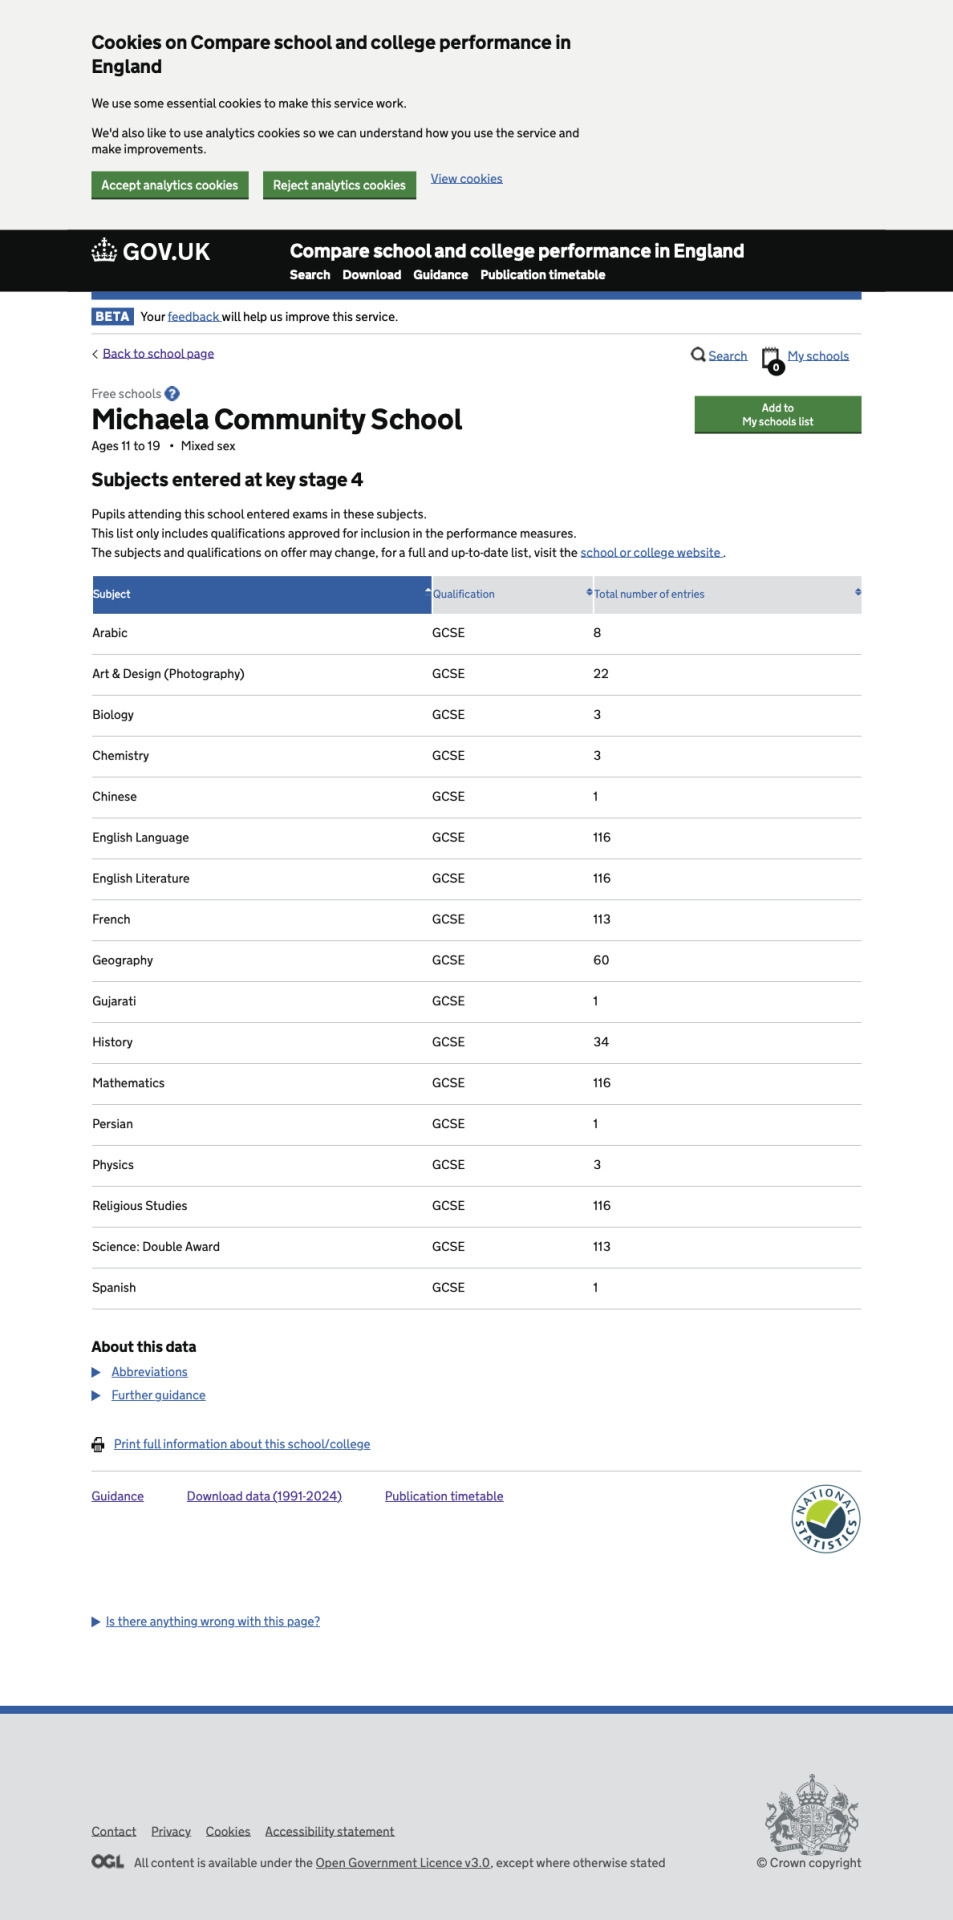
Each year, about 90 Michaela pupils enter for the EBacc, a set of GCSE subjects encouraged by the British government. This usually works out to 75% of a cohort, but in 2024 it was 81% (94 pupils) because the cohort size was smaller than usual at only 116 pupils. Still, that means the largest class of EBacc entrants was only 32, in line with Michaela's projected class size of 30—despite Birbalsingh asserting that "class size matters little for success." Although the school comparison website does not list subject selections for individual pupils, it was easy to see how subjects were combined by cross-referencing exam entries per pupil and total entries per subject.
In 2021-2022, the pupils who did not enter for EBacc studied citizenship but neither French nor humanities. The study of art did not appear to correlate with EBacc entry.
In 2022-2023, the pupils who did not enter for EBacc studied photography and fine art but neither French nor humanities. Citizenship was dropped from the curriculum.
In 2023-2024, the pupils who did not enter for the EBacc studied photography but not humanities.
EBacc entry varies little across different pupil demographics such as gender, disadvantage, or English as an additional language. However, there is one characteristic that strongly determines EBacc entry at Michaela: prior attainment (PA). Over the past three years, out of 323 pupils for whom the PA data is available, 23% of low-PA pupils have entered the EBacc. This number is 83% for middle PA and 99% for high PA. According to my statistical analysis, the chance of these disparate "choices" arising without intervention is less than one percent.
At the end of Key Stage 3, Michaela staff pick approximately the top 75% of performers to enter for EBacc and require the lowest 25% to study other subjects.
This explains why only a few low-PA pupils enter for EBacc: although they are likely to remain in the bottom of their cohort throughout their schooling, some may improve enough to enter the top three quartiles. Although I am fully confident that my statistical analysis supports my assertion that Michaela pupils are not permitted to choose their GCSE subjects, the school has never disclosed a rationale for this practice, so the remainder of this essay will be speculation, not fact.
Michaela frequently boasts of its high Progress 8 (P8) score, and in order to understand my hypotheses, I recommend you familiarize yourself with its calculation. P8 is calculated by comparing actual Attainment 8 (A8) scores with expected scores based on Key Stage 2 (KS2) performance. This PDF explains how A8 scores are derived. (For my purposes, I will count double science as 2 GCSE subjects.) Therefore, a school with a non-selective intake such as Michaela can only change its P8 score by changing its A8 score.
Over the past few years, Michaela has refined its placement technique, presumably to increase its A8 scores. Pupils of any ability were permitted to study art at the GCSE level in 2022, but that option was removed the next year, probably so that high performers could devote more energy to EBacc subjects. Low performers who would have studied citizenship in 2022 instead studied art in 2023. Perhaps a part-time citizenship teacher would no longer be needed, and more resources could be directed to core subjects. All pupils studied GCSE French for the first time in 2024, giving each pupil 3 EBacc qualifications and finally maximizing A8 scores. However, the poorest performing 25% did not study humanities at KS4. This meant that approximately 120 * 2 * (1 - 0.25) = 180 pupils did study humanities at KS4, so with a typical class size of 30 and 6 class periods per day, one teacher could have accommodated all of them. If poor performers had studied humanities as well, hiring another teacher may have been necessary (and we already know how protective Michaela is of its budget).
The curricula for high and low performers are now identical, except for poor performers studying photography instead of humanities. Working from the assumption that Michaela intends to maximize its A8 score, this leads to one or two conclusions: it believes that poor performers will score higher on photography than French, and/or it does not want to expend humanities resources on poor performers because allocating them exclusively to high performers will raise the A8 score more. Similarly, no Michaela pupil has entered for more than 8 GCSE subjects (barring heritage languages, which do not demand too much revision time) since 2022, almost certainly to improve A8 scores. A limited class schedule allows pupils to devote more revision time to each core subject, while more exams would not raise A8, even if they did expand pupils’ horizons.
In the matter of GCSE curriculum, Michaela’s website is outdated and incomplete. It still enumerates the KS4 fine art curriculum, even though the subject was not offered at the GCSE level in 2024. It doesn’t mention that only three-quarters of pupils will study GCSE history or geography, so some parents who expect their children to study the humanities past age 13 may be in for a nasty surprise. Of course, this begs the question, what does Michaela have to hide?
It is difficult to understand how these prescribed schedules advantage Michaela’s pupils. Does the school not enroll maths whizzes who are determined to enter for mathematics, further mathematics, and physics at A-level, but who want one last artistic hurrah before starting sixth form? Are none of the poor performers averse enough to art that they'd prefer history? These prescriptions do not necessarily benefit Michaela’s pupils, but they do benefit the school’s P8.
Finally, Williams closes his article on a nostalgic note, contrasting his childhood with that of the Michaela pupil: “…my friends and I were free—luxuriously so—in ways these children possibly couldn’t even imagine. But that freedom that so many underprivileged and minority children bask in isn’t worth a damn thing if it leads to an adulthood boxed in by self-inflicted limitations.” Since the author was raised by college graduate parents and educated in private schools, and he is now a successful writer, he seems to believe that children who grow up rich can thrive on freedom, but the same is not true of the poor. Birbalsingh similarly believes that disadvantaged children need extreme discipline to succeed. However, she does not want to create a world where child poverty is eradicated so that every pupil can experience freedom, joy, and success at the same time. In fact, she envisions the opposite. She has spoken out against free meals for primary schoolers because she believes (without evidence!) that it would somehow make their parents less responsible. Even this concern were legitimate, it would pale in comparison to the necessity of feeding hungry children.
In the end, my dislike of Birbalsingh stems from her incredibly bleak worldview. She maintains that children should face the threat of starvation so their parents will be motivated to work harder. Even when testifying before Parliament, she believes the sexism that drives differences in A-level subject choices should remain unexamined. She propagates furry hoaxes—originally spread to mock trans people—to exemplify a supposed lack of discipline from parents. She believes if you don’t decorate your house for Christmas, you are destroying the country, and it is also somehow Vishnu’s problem (yes, the letter is truly that bizarre, and I recommend reading it for full effect). In her ideal world, she imagines suffering for suffering’s sake, a boot stamping on a human face—forever.
#katharine birbalsingh#birbalsingh#michaela community school#michaela#politics#british politics#uk politics#essay#longform#long form#data science#statistics#statistical analysis#education#education system#uk education#education uk#british education#united kingdom#london#wembley#i am a girl who likes hard maths
3 notes
·
View notes
Text
How to Come Up with Time Lord Names
Sooooo...I did a letter-by-letter analysis of 230 names from the wiki's list of Time Lords, making sure I only chose characters that both 1) had names that sounded like part of the same language and 2) had their jobs listed so I could correlate name-segments with talents.
If you want to see my whole headcanon about how Time Lord names work and what each syllable means, I've put it on AO3. If you just want to know what sounds and syllables to include when you're coming up with names, the analysis I did of all those existing names is below the cut.
Most syllables consist of a consonant followed by a vowel.
A syllable can only contain one vowel (with the exception of IA, which acts like a single vowel).
Every syllable contains at least one consonant (with the exception of O, which can stand alone without a consonant attached).
About 46% of analyzed syllables add a second consonant after the vowel. About 18% of analyzed syllables follow a vowel-consonant pattern. Only nine consonants are used after vowels. (C/K/Ch, D, F/Ph/P, L/LL, M/N, R, S/Sh, T/Th, X)
Total names analyzed: 230
Total syllables in analyzed names: 719
Number of syllables based around each vowel:
A 295 (36% 0f analyzed syllables) E 129 (18% 0f analyzed syllables) O 127 (18% 0f analyzed syllables) I 118 (16% 0f analyzed syllables) U 50 (7% 0f analyzed syllables)
Number of syllables beginning with consonants: 592 (82% of analyzed syllables)
Number of syllables beginning with each consonant:
R 77 (11% 0f analyzed syllables) T 70 (10% 0f analyzed syllables) L 68 (9% of analyzed syllables) N 46 S/Sh 40 V 42 C/K/Ch 41 D 40 M 32 G 21 P 21 B 14 Tr 13 H 12 Dr 10 Br 7 F/Ph 6 J 6 X 6 Z 5 Fl 3 Sp 3 Qu 3 W 2 Y 2
Number of syllables beginning with vowels: 127 (18% of analyzed syllables)
Number of syllables beginning with each vowel:
A 61 (8% of analyzed syllables) E 24 O 19 U 16 I 7
Number of syllables ending with consonants: 332 (46% of analyzed syllables)
Number of syllables ending with each consonant:
M/N 102 (14% of analyzed syllables, 31% of syllables ending with consonants) R 67 (9% of analyzed syllables, 20% of syllables ending with consonants) S/Sh 52 (16% of syllables ending with consonants) L/LL 43 (13% of syllables ending with consonants) X 22 C/K/Ch 15 T/Th 14 D 12 F/Ph/P 5
Most Commonly Used Syllables:
An (15 times) Na (15 times) Ra (15 times) Ri (14 times) Ta (14 times) La (13 times) Ro (11 times) Sa (11 times) Us (11 times) Ti (10 times) All other syllables appeared fewer than ten times in the analysis.
#doctor who fanfic#statistical analysis#gallifreyan language#conlang#I'm probably insane for doing this#but I hope it helps someone
26 notes
·
View notes
Text

I’m off to explore! 🎒
#student memes#uni memes#university memes#student life#dissertation#dissertation memes#dissertation life#data analysis#psychology student#university#psych student#student#uni life#research project#final year project#stats#statistics#university life#university student#research memes#research life#regression#spss#statistical analysis#null hypothesis#explore#correlation#ineedfairypee#fairypeememes#I Need Fairy Pee
8 notes
·
View notes
Text
The Role of Statistical Analysis in Business Decision-Making
In the business model, where data initiative decisions the role of statistical analysis has become vital. Companies control statistical methods to make informed choices, optimize performance, and gain a competitive analysis. One of the most valuable resources in mastering is a professional who provides expertise in static analysis and helps businesses connect data's power. Here’s a look at how a static tutor can significantly improve business decision-making.
Understanding Market Trends with Precision
Statistical analysis allows businesses to understand market trends and consumer behaviors effectively. A static tutor helps businesses understand complex statistical models that predict future trends based on historical data. For instance, if a retail company wants to predict seasonal sales, a static tutor can guide the application of time-series analysis and regression techniques. These techniques ensure that businesses accurately to look forward market demands and make strategies according to the market trends.
Improving Operational Efficiency
When maintaining profitability and affordability operational efficiency plays a vital role. By statistical application methods, businesses can identify ineffective operations in business development. A static tutor can help in analyzing metrics such as performance in chain supply. By applying techniques like hypothesis testing and analysis of variance, businesses can find improvement and implementation to enhance business development.
Enhancing Financial Performance
Company success may depend on business financial performance. Through statistical analysis sort out financial performance and future planning. A static tutor can help businesses utilize techniques such as Regression analysis to make a chart of total business revenue and calculate investment opportunities. By understanding financial data trends, companies can make informed decisions about budgeting, pricing, and resource allocation, ultimately improving their financial health.
Optimizing Marketing Strategies
Marketing effectiveness is significantly boosted by statistical analysis. A static tutor provides services in marketing strategies to develop business leveraging data. Techniques such as multivariate analysis allow companies to determine the most effective marketing messages and channels.
Facilitating Data-Driven Decision-Making
Facilitating decision-making can lead to more accurate outcomes and maximize the certainty of data. A static tutor plays a crucial role in ensuring that businesses make decisions based on solid statistical evidence rather than inspection. By guiding the use of statistical tools and methods, a static tutor helps businesses interpret data accurately and make informed decisions that align with their strategic goals.
Assessing Customer Satisfaction
Understanding customer satisfaction is vital for business success. A static tutor helps in analyzing customer feedback and satisfaction reviews using statistical methods. Techniques like factor analysis help to coordinate with customers’ needs. This analysis enables businesses to enhance their products and services, leading to improved customer satisfaction and loyalty.
Evaluating Product Performance
Product performance evaluation is essential for maintaining and improving market competitiveness. A static tutor can assist businesses in applying statistical analysis to assess product performance based on sales data, customer reviews, and market share. By utilizing techniques such as regression analysis and correlational studies, businesses can identify trends and make data-driven decisions to optimize their product offerings.
Reducing Risk
Risk management is a critical aspect of business strategy. Statistical analysis helps in assessing and managing risks effectively. A static tutor can guide businesses in using risk assessment models. By understanding risk prospects, businesses can develop accurate strategies to manage possibilities and protect their assets.
Enhancing Human Resources Management
We can get human resources management benefits from statistical analysis in several ways. A static tutor can help analyze employee performance data, and monthly revenue generated. Techniques like predictive analytics can identify factors leading to high employee performance and satisfaction. This data strategies approach enables better business decisions, from recruitment to employee development, and Encourages more effectiveness in workability.
Conclusion
Coordinating with a static tutor for your business strategy provides invaluable expertise in statistical analysis, leading to more informed and effective decision-making. From understanding market trends and optimizing operations to enhancing financial performance and managing risks, a static tutor helps businesses leverage data to achieve their goals. implement statistical analysis with the support of statistics tutors, businesses can know how the complexities of today’s market with confidence and precision, maintaining success and sustained growth.
3 notes
·
View notes
Text
Understanding Different Types of Variables in Statistical Analysis
Summary: This blog delves into the types of variables in statistical analysis, including quantitative (continuous and discrete) and qualitative (nominal and ordinal). Understanding these variables is critical for practical data interpretation and statistical analysis.

Introduction
Statistical analysis is crucial in research and data interpretation, providing insights that guide decision-making and uncover trends. By analysing data systematically, researchers can draw meaningful conclusions and validate hypotheses.
Understanding the types of variables in statistical analysis is essential for accurate data interpretation. Variables representing different data aspects play a crucial role in shaping statistical results.
This blog aims to explore the various types of variables in statistical analysis, explaining their definitions and applications to enhance your grasp of how they influence data analysis and research outcomes.
What is Statistical Analysis?
Statistical analysis involves applying mathematical techniques to understand, interpret, and summarise data. It transforms raw data into meaningful insights by identifying patterns, trends, and relationships. The primary purpose is to make informed decisions based on data, whether for academic research, business strategy, or policy-making.
How Statistical Analysis Helps in Drawing Conclusions
Statistical analysis aids in concluding by providing a structured approach to data examination. It involves summarising data through measures of central tendency (mean, median, mode) and variability (range, variance, standard deviation). By using these summaries, analysts can detect trends and anomalies.
More advanced techniques, such as hypothesis testing and regression analysis, help make predictions and determine the relationships between variables. These insights allow decision-makers to base their actions on empirical evidence rather than intuition.
Types of Statistical Analyses
Analysts can effectively interpret data, support their findings with evidence, and make well-informed decisions by employing both descriptive and inferential statistics.
Descriptive Statistics: This type focuses on summarising and describing the features of a dataset. Techniques include calculating averages and percentages and crating visual representations like charts and graphs. Descriptive statistics provide a snapshot of the data, making it easier to understand and communicate.
Inferential Statistics: Inferential analysis goes beyond summarisation to make predictions or generalisations about a population based on a sample. It includes hypothesis testing, confidence intervals, and regression analysis. This type of analysis helps conclude a broader context from the data collected from a smaller subset.
What are Variables in Statistical Analysis?
In statistical analysis, a variable represents a characteristic or attribute that can take on different values. Variables are the foundation for collecting and analysing data, allowing researchers to quantify and examine various study aspects. They are essential components in research, as they help identify patterns, relationships, and trends within the data.
How Variables Represent Data
Variables act as placeholders for data points and can be used to measure different aspects of a study. For instance, variables might include test scores, study hours, and socioeconomic status in a survey of student performance.
Researchers can systematically analyse how different factors influence outcomes by assigning numerical or categorical values to these variables. This process involves collecting data, organising it, and then applying statistical techniques to draw meaningful conclusions.
Importance of Understanding Variables
Understanding variables is crucial for accurate data analysis and interpretation. Continuous, discrete, nominal, and ordinal variables affect how data is analysed and interpreted. For example, continuous variables like height or weight can be measured precisely. In contrast, nominal variables like gender or ethnicity categorise data without implying order.
Researchers can apply appropriate statistical methods and avoid misleading results by correctly identifying and using variables. Accurate analysis hinges on a clear grasp of variable types and their roles in the research process, interpreting data more reliable and actionable.
Types of Variables in Statistical Analysis

Understanding the different types of variables in statistical analysis is crucial for practical data interpretation and decision-making. Variables are characteristics or attributes that researchers measure and analyse to uncover patterns, relationships, and insights. These variables can be broadly categorised into quantitative and qualitative types, each with distinct characteristics and significance.
Quantitative Variables
Quantitative variables represent measurable quantities and can be expressed numerically. They allow researchers to perform mathematical operations and statistical analyses to derive insights.
Continuous Variables
Continuous variables can take on infinite values within a given range. These variables can be measured precisely, and their values are not limited to specific discrete points.
Examples of continuous variables include height, weight, temperature, and time. For instance, a person's height can be measured with varying degrees of precision, from centimetres to millimetres, and it can fall anywhere within a specific range.
Continuous variables are crucial for analyses that require detailed and precise measurement. They enable researchers to conduct a wide range of statistical tests, such as calculating averages and standard deviations and performing regression analyses. The granularity of continuous variables allows for nuanced insights and more accurate predictions.
Discrete Variables
Discrete variables can only take on separate values. Unlike continuous variables, discrete variables cannot be subdivided into finer increments and are often counted rather than measured.
Examples of discrete variables include the number of students in a class, the number of cars in a parking lot, and the number of errors in a software application. For instance, you can count 15 students in a class, but you cannot have 15.5 students.
Discrete variables are essential when counting or categorising is required. They are often used in frequency distributions and categorical data analysis. Statistical methods for discrete variables include chi-square tests and Poisson regression, which are valuable for analysing count-based data and understanding categorical outcomes.
Qualitative Variables
Qualitative or categorical variables describe characteristics or attributes that cannot be measured numerically but can be classified into categories.
Nominal Variables
Nominal variables categorise data without inherent order or ranking. These variables represent different categories or groups that are mutually exclusive and do not have a natural sequence.
Examples of nominal variables include gender, ethnicity, and blood type. For instance, gender can be classified as male, female, and non-binary. However, there is no inherent ranking between these categories.
Nominal variables classify data into distinct groups and are crucial for categorical data analysis. Statistical techniques like frequency tables, bar charts, and chi-square tests are commonly employed to analyse nominal variables. Understanding nominal variables helps researchers identify patterns and trends across different categories.
Ordinal Variables
Ordinal variables represent categories with a meaningful order or ranking, but the differences between the categories are not necessarily uniform or quantifiable. These variables provide information about the relative position of categories.
Examples of ordinal variables include education level (e.g., high school, bachelor's degree, master's degree) and customer satisfaction ratings (e.g., poor, fair, good, excellent). The categories have a specific order in these cases, but the exact distance between the ranks is not defined.
Ordinal variables are essential for analysing data where the order of categories matters, but the precise differences between categories are unknown. Researchers use ordinal scales to measure attitudes, preferences, and rankings. Statistical techniques such as median, percentiles, and ordinal logistic regression are employed to analyse ordinal data and understand the relative positioning of categories.
Comparison Between Quantitative and Qualitative Variables
Quantitative and qualitative variables serve different purposes and are analysed using distinct methods. Understanding their differences is essential for choosing the appropriate statistical techniques and drawing accurate conclusions.
Measurement: Quantitative variables are measured numerically and can be subjected to arithmetic operations, whereas qualitative variables are classified without numerical measurement.
Analysis Techniques: Quantitative variables are analysed using statistical methods like mean, standard deviation, and regression analysis, while qualitative variables are analysed using frequency distributions, chi-square tests, and non-parametric techniques.
Data Representation: Continuous and discrete variables are often represented using histograms, scatter plots, and box plots. Nominal and ordinal variables are defined using bar charts, pie charts, and frequency tables.
Frequently Asked Questions
What are the main types of variables in statistical analysis?
The main variables in statistical analysis are quantitative (continuous and discrete) and qualitative (nominal and ordinal). Quantitative variables involve measurable data, while qualitative variables categorise data without numerical measurement.
How do continuous and discrete variables differ?
Continuous variables can take infinite values within a range and are measured precisely, such as height or temperature. Discrete variables, like the number of students, can only take specific, countable values and are not subdivisible.
What are nominal and ordinal variables in statistical analysis?
Nominal variables categorise data into distinct groups without any inherent order, like gender or blood type. Ordinal variables involve categories with a meaningful order but unequal intervals, such as education levels or satisfaction ratings.
Conclusion
Understanding the types of variables in statistical analysis is crucial for accurate data interpretation. By distinguishing between quantitative variables (continuous and discrete) and qualitative variables (nominal and ordinal), researchers can select appropriate statistical methods and draw valid conclusions. This clarity enhances the quality and reliability of data-driven insights.
#Understanding Different Types of Variables in Statistical Analysis#Variables in Statistical Analysis#Statistical Analysis#statistics#data science
4 notes
·
View notes
Text

Dr. Ganasoundari, an expert statistician and thesis consultant conducts statistical workshop for research scholars using SPSS on Zoom. She has more than two decades of experience and has mentored 1000s of research scholars to achieve their PhD dream. Date : April 19 & 20, 2024 (fri &sat) Time : 5 pm to 8 pm IST Venue : Zoom Register Now Registration Link : https://www.phddataanalysis.com/statisti.../spss-foundation/
2 notes
·
View notes
Text
**Waves some jedi ninja hand sigils:
"These ARE the data you are looking for!"
the phantom of the opera and the hunchback of notre dame? opposite ends of same spectrum
#lotr#lord of the rings#jrr tolkien#tmnt#saruman#minas ithil#phantom of the opera#the hunchback of notre dame#geometry#graphs#visual data#statistics#statistical analysis#rigorous analysis#these are the data you are looking for#beauty and the beast#fairy tales#Gabrielle-Suzanne Barbot de Villeneuve#whatthefolklore#jedi#naruto
188K notes
·
View notes
Text
Here is part 3 of balatro Wheel of Fortune statistics, this time is at 100 uses and next time will be 250.


It's actually averaging out to roughly a quarter, which I suppose is to be expected but I'm still a bit surprised because it felt like way less.
7 notes
·
View notes
Text
Data Journey
Hi guys,
My name is Sakinat. And I will be documenting my data journey here. I will be analysing the amount of CO₂ and Sulphur emissions by country, using datasets from gapminder. I will also be examining the life expectancy and daily income of individuals from these countries and see the relationships between CO₂ emissions and life expectancy of individuals.
Looking forward to sharing this experience here as well as getting feedback from you all.
Ciao.
1 note
·
View note
Text
Expert Dissertation Writing & Statistical Analysis Services for Masters and PhD Students in the UK – AI, Data Science, and Biostatistics Support
Comprehensive Dissertation Writing & Statistical Analysis Services for Masters and PhD Students in the UK
At Tutors India, we understand how challenging it can be to complete your Masters dissertation statistical analysis or PhD thesis statistical assistance, especially when it comes to complex dissertation statistical analysis and data science tasks. Our expert team offers end-to-end support covering all aspects of dissertation statistical consultation, thesis statistical assistance, and academic data interpretation.
Whether you need help with quantitative data analysis services, qualitative research analysis, or advanced AI and machine learning techniques, we’re here to guide you every step of the way.
Ready to get expert help with your dissertation statistics? Contact us now!
Our Expert Services Include:1. Masters Dissertation Statistical Analysis and Data Science Chapter Writing Services
We offer specialized Masters dissertation statistical analysis and data science support to help you develop a rigorous and methodologically sound Results (Chapter 4) section. Our services are tailored to your research objectives and data type, ensuring accurate analysis, interpretation, and presentation of findings.
Our Expertise Includes:
Statistical Software Proficiency: Analysis using SPSS, SAS, R programming, Python (NumPy, Pandas, SciPy), and STATA, based on your academic or institutional preferences.
Advanced Statistical Techniques: Implementation of: Descriptive statistics (mean, median, mode, SD, frequency distribution)
Inferential statistics (confidence intervals, p-values, standard error)
Hypothesis testing (t-tests, chi-square, z-tests)
Multivariate techniques (ANOVA, MANOVA, linear and logistic regression, correlation, cluster analysis)
Data Visualization & Reporting: Presentation of findings using: Publication-quality charts and tables
APA/Harvard-compliant formatting
Graphs created via matplotlib/seaborn (Python), ggplot2 (R), or SPSS output
Data Interpretation & Insight Extraction: Clear, concise discussion of statistical findings in alignment with your research questions, ensuring consistency with your research hypotheses and methodology.
Whether you're analyzing experimental results, survey data, or secondary datasets, our statistical experts provide guidance aligned with your university’s rubric, ensuring statistical accuracy, academic rigor, and clarity.
Need expert help polishing your dissertation’s data analysis chapter? Get in touch with our academic specialists today.
2. Data Science and Biostatistics Support
Our advanced Masters dissertation data science writing and editing services leverage AI and biostatistics for accurate, insightful data interpretation. Services include:
● AI-driven data modeling and algorithm development
● Machine learning dissertation support ● Statistical consultation for biomedical and life sciences research Looking for cutting-edge biostatistics support for your thesis? Let’s talk!
3. Quantitative & Qualitative Data Analysis
We offer comprehensive assistance in both:
● Masters quantitative data analysis writing services using techniques like sampling techniques, grounded theory, and inferential statistics ● Masters qualitative data analysis writing services including content analysis and thematic coding Our goal is to ensure your dissertation meets academic rigor and effectively communicates your research findings.
Struggling with dissertation data analysis? Get expert consultation now!
4. Research Methodology & Statistical Consultation
Our specialists provide expert guidance in:
● Designing research methodologies that fit your project
● Applying effective sampling techniques such as stratified, snowball, and purposive sampling
● Using statistical tools like Minitab and Excel for rigorous data analysis
Need help refining your research methodology? Contact our experts today!
5. Data Interpretation & Reporting
Interpreting results accurately is key to dissertation success. We help you with:
● Clear and comprehensive academic data interpretation
● Creating impactful data visualizations for thesis presentation ● Preparing detailed statistical reports to enhance your dissertation quality
Want clear, precise interpretation of your dissertation data? Book a session now!
Why Choose Tutors India for Your Dissertation Statistical Analysis & Writing?
● Comprehensive Expertise: We cover all areas from dissertation statistical consultation to advanced statistical techniques and data science editing services. ● Advanced Tools: Proficient in SPSS, R programming, SAS, STATA, Minitab, Excel, and AI-powered statistical analysis tools. ● 100% Plagiarism-Free: Every dissertation is rigorously checked with Turnitin to ensure originality.
● UK-Based Academic Writers: Qualified experts specializing in Masters and PhD dissertations.
● End-to-End Support: From dissertation proposal writing to final editing and submission.
● Quick Turnaround: Urgent dissertation help with guaranteed high quality. Ready to boost your dissertation with expert help? Contact Tutors India today!
Book Your Consultation Today!
Don’t let complex statistics or data science overwhelm you. Get in touch with Tutors India for professional Masters dissertation statistical analysis writing services, thesis editing, and AI-powered data science support in the UK.
Contact Us: UK: +44-1143520021 IN: +91 8754446690 Email: [email protected]
0 notes
Text
DICS – Your Trusted Data Analytics Institute in Laxmi Nagar

In today’s data-driven world, the demand for skilled data analysts is skyrocketing. Whether you’re a student, working professional, or career switcher, mastering data analytics can open the door to numerous opportunities across industries. If you’re looking to start or advance your career in data analytics, choosing the right institute is crucial. Look no further — [Institute Name] is recognized as the best data analytics institute in Laxmi Nagar, offering industry-relevant training, expert faculty, and hands-on learning experiences that set you up for success.
Why Choose Us?
At [Institute Name], we believe in delivering more than just theoretical knowledge. Our mission is to equip you with the practical skills and insights needed to thrive in real-world data environments. Our data analytics program is designed by industry experts and regularly updated to match current trends and technologies. We focus on tools like Excel, SQL, Python, Power BI, Tableau, and R, ensuring that our students are proficient in all the key technologies employers are looking for.
Best Data Analytics Course in Laxmi Nagar
Our comprehensive curriculum makes us stand out as the provider of the best data analytics course in Laxmi Nagar. Whether you’re a beginner or have some background in analytics, our course structure is tailored to meet diverse learning needs. The course includes:
Introduction to Data Analytics
Data Visualization with Power BI & Tableau
Programming for Data Analytics (Python & R)
Statistical Analysis & Predictive Modeling
SQL for Data Management
Capstone Projects and Case Studies
With a strong emphasis on practical application, our course helps students build portfolios through real-time projects, giving them an edge in job interviews and professional scenarios.
Expert Faculty and Personalized Mentoring
We take pride in our experienced faculty, who bring years of industry and academic experience to the classroom. Our instructors not only teach but also mentor students, helping them with resume building, mock interviews, and job placement support. Our small batch sizes ensure personalized attention for every student.
100% Placement Assistance
Being the best data analytics institute in Laxmi Nagar, we offer complete placement support. We have partnerships with leading companies and regularly conduct hiring drives. Our dedicated placement team ensures that you are well-prepared for interviews and job roles, offering guidance every step of the way.
Convenient Location and Flexible Batches
Located in the heart of Laxmi Nagar, our institute is easily accessible by metro and public transport. We offer flexible batch timings — weekday, weekend, and online classes — making it convenient for both students and working professionals.
#Data Analysis#Data Visualization#Big Data#Data Science#Machine Learning#Predictive Analytics#Statistical Analysis#Data Mining#Business Intelligence#Data Modeling
0 notes