#identity function graph
Explore tagged Tumblr posts
Visit Tumblr Blog
Explore Tumblr blogs with no restrictions, modern design and the best experience.
Last Seen Tumblr Blogs


Fun Fact
In 2020, Tumblr had 29.4 million users in the US.
Text
Best Way to Engage Your Audience with Cubera’s Identity Graph Service in Bangalore

Discover the best way to optimize your marketing with Cubera’s Identity Graph Service in Bangalore. Gain a complete view of your customers by integrating data from multiple sources, allowing for precise, personalized campaigns. Boost your targeting accuracy by 30% and increase customer engagement by 40%.
Curious to learn more? Explore Cubera’s Identity Graph and see how unified customer data can transform your marketing strategy today!
#identity graph#deep learning#identity function graph#harness big data#identity graph providers in india#harness data#cookieless world
0 notes
Text
Voltron characters as algebraic expressions/distributions:
PIDGE: the binomial distribution
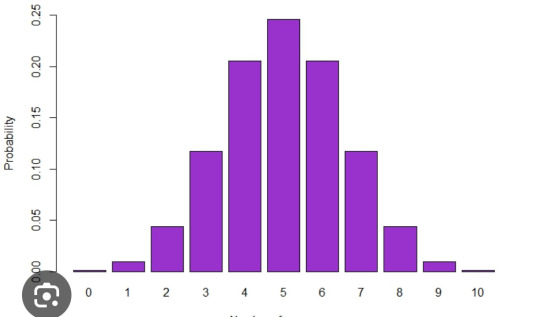
Binomial distributions display probabilities for a set number of binary trials (only two choices) within an experiment. I feel like this represents her because of her experimental nature as well as the two choices she was faced with in s1: saving the universe or leaving to save matt and her dad.
LANCE: sine function
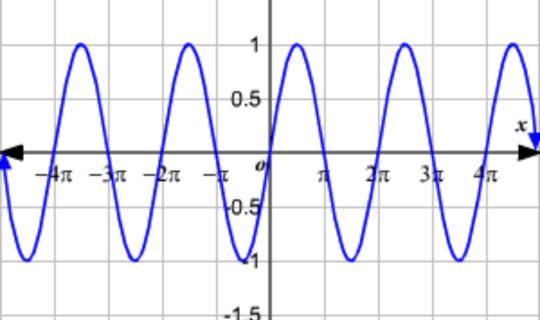
IT'S ALL ABOUT THE WAVES!! Bro is smooth and bro swings both ways. Also, a sine wave is a periodic function, meaning it repeats the same pattern again and again. This can represent how while Lance is moving forward, he feels like is isn't growing or isn't more, but is rather stuck, bouncing between highs and lows.
KEITH: cosecant function
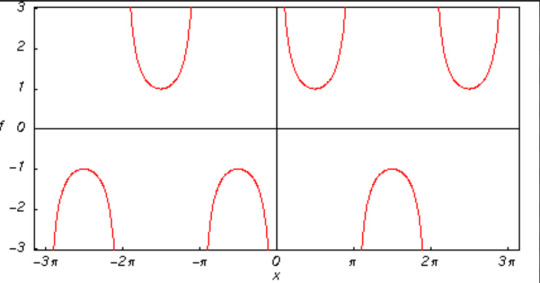
cosecant functions are the reciprocals of sin function (csc=1/sin), so this shows how Keith "reflects" or mirrors Lance. Additionally, the periods of csc functions start at positive or negative infinity and then stray towards the origin, but never quite reach it. This represents how Keith is so far away, and how everytime he comes back he leaves again, and how "home" always feels out of reach for him (csc function approaches horizontal asymptote but never truly gets there)
ALLURA: exponential function
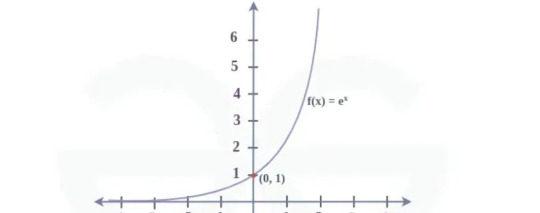
The exponential function starts at an infintessimally small value that is nearly zero, and then rises drastically. The "flatter" values of the graph represent her comatose, and the sudden increase of values reflect her increased power, fight, and drive. It continues to increase forever, which I think can represent her death in canon. She transcends a barrier that the others cannot reach.
CORAN: uniform distribution
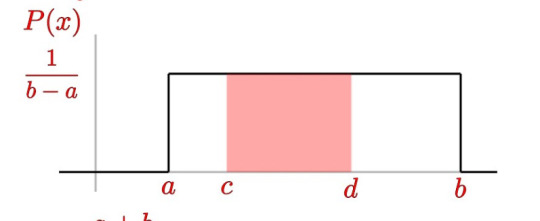
MY BOY Coran is the most unwavering support ever. The key aspect of a uniform distribution is that it is always the same value wherever it exists. It doesn't change or shift, just like how Coran has always, ALWAYS been able to constantly be there for the team and the universe.
HUNK: step function
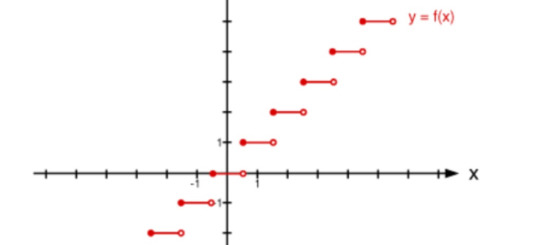
While canon does him dirty, Hunk rises in both confidence and skill throughout the show. He's very methodic and is also a backbone to the team, which is why I gave him a function that's broken so evenly and is still rising. He is the type of character who climbs up. Also, I first used step functions in an engineering class!
SHIRO: hyperbolic function
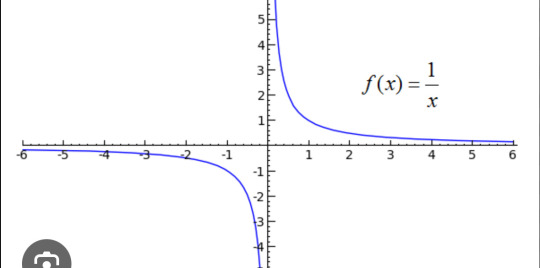
OMG YALL ALR KNOW!! Not all hyperbolic functions map this way fyi, but THESE particular ones are sooooo Shiro. There is two parts of the graph, one positive and one negative. They never touch but they mirror each other identically and they're mapped by the same function. This represents Kuron and Shiro. They're both made from the same DNA, appear identical, but they have different minds and goals (the same way both parts of this function approach different values as x approaches infinity!)
#voltron#voltron brainrot#guys what am I doing#vld#voltron legendary defenders#pidge holt#pidge#pidge gunderson#Lance mcclain#keith kogane#klance#allura#coran#hunk garrett#takashi shirogane#vld headcanons#voltron headcanons#asterikamay#voltron as math functions#incase anyone is fucking looking that up lmao#math functions#probability distributions#so sorry to whoever is looking through math tags for studying or smth and they see VOLTRON#although...why are you studying from tumblr help
97 notes
·
View notes
Text
A guide to chromosomal variations
Over at Instagram Melly the Science Geek has published a mind blowing video about how chromosome decide (or do not the decide) the sex of a person.
The world is a a very complicated place, indeed.
And at this point we have not even begun to talk about gender identity.
The Science Vet on XX, XY and all the other variations
Melly's video reminds us of the very popular twitter thread made by the Science Vet back in 2018.
We take the liberty of republishing that thread here:
So. Hi new people! Apparently, we're gonna talk about sex. Like physical sex! Because... there's some confusion.
First, sex defined: We're talking physical sex here, not gender. Body parts, hormones, and genetics (and more).
BLUF: BIOLOGICAL sex is a spectrum
Ok, everyone's super familiar with the XX/XY dichotomy, right? Yeah, what we all learned in like... 4th grade? And that's great, it gives you a starting point. But it's... well it's only the very starting point.
The IDEA is, XX is girl, XY is boy, right?
Welllll... that's not totally right. There are XY people, who have ovaries! And give birth! AH! And XX people who have male bodies and functional sperm! Double AH!
These are usually written off as "abnormalities" and indeed, some cases have medical issues. But many don't (like the XY woman giving birth). And this is really only the very very tip of the iceberg of "wait, that doesn't fit into our M or F box unless we make it bigger"
There's a WHOLE HOST of things that can cause all sorts of "weird" things to happen, ranging from genetic (XXY, XYY, Y, X, XX with translocation, XY with deletion) to hormonal (Androgen Insensitivity, Estradiol failure), and disruptors like dioxins
So, you're a scientist, and you want to research stuff, right? Which means you have to categorize stuff. Without categories, data is hard! So you take allll these people, including the "weird" ones and you plot them on a graph. Logical!
You use all the differences there are, different genetics, different responses to hormones, different effectiveness in signalling pathways, different sizes in Aanteroventral periventricular nucleus (AVPV) (yeah that's a thing) and give everything numbers, add them up.
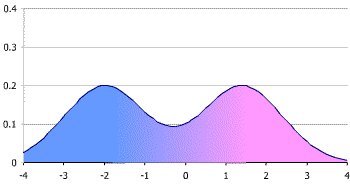
You get what's called a bimodal distribution (mostly, we'll get to that later) Which looks like this. Those two big peaks are what we call "male" and "female" (even conveniently colored pink for boys and blue for girls - we are using victorian gender colors right?)
/8
Now, when you're trying to look at data, we often group stuff. When we do that with a plot like this, it's called a "histogram." Basically we're breaking down a curved line into discrete "bins." Like this (image stolen from the web).
/9
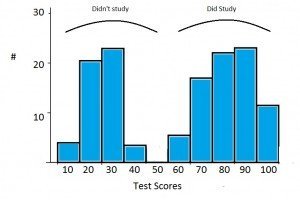
Traditionally, we've used REALLY BIG bins for this when talking about sex. Basically you either group everything vaguely near a peak into the peak, or you just pretend there's nothing else but the biggest peaks. This makes it super easy, because 2 is simple to do data with.
However, as we've gotten to know more and more about signaling and brains and hormones and started to pay more attention to the outliers where standard stuff just didn't seem to work, we discovered that this isn't a great model to use.
Now I'm not talking feelings here. I'm talking about data. As you start to look at anything interesting, like say the effects of 2,3,7,8-Tetrachlorodibenzo-P-dioxin on animals, you start to realize that a 2 bin model doesn't predict your results well.
At first you say, "Well it was just weird." So you redo it, and it still doesn't work. So you look at your model and you say, "Well ok, what if the model's wrong?"
But the model sort of... almost predicts a lot of things, and it worked for years, so...
Some enterprising soul says, "Hey, remember that histogram where we said we'll just model using the peaks?" And everyone goes, "Uh, yeah?" And they say, "What if we... USED that data?" And everyone groans, because complicated data is hard.
But someone sits down and does the work, and lo, wow the model starts to work again. Where TCDD was "randomly" turning some boys into girls but then some girls into boys, now you can see there's a subgroup of what you'd called "female" that responds like the "male"
What's important here is that you haven't MISLABELED males as females. These are functional "females" who can do all the usual "female" things like gestate babies. But they respond to this one endocrine disruptor in a "male" way.
So you add another two categories, call them "Male2" and "Female2" and go on, happy that your model works! You've got 4 sexes now, but you don't really have to tell anyone that, right?
Exceeeept then you remember you've got those XY people that gestate babies. So you add "Intersex1" And then the XX people with penes... and ovaries? Ok, "Intersex2" because all these groups respond differently with signalling and brains when you get into the weeds
And the more you look, the more we LEARN, the more we're able to separate out those fine differences. Depending on what we're doing, we may not care. If a doc is giving you aspirin, it probably isn't a big deal.
But if they're using a steroid on you? Or treating dioxin poisoning? THAT SHIT COULD BE IMPORTANT. It's like saying, "the light's off so the power must not be flowing." It really matters if the light's off because the bulb blew.
If we go back to that histogram plot, we can keep breaking down your biological sex into smaller and smaller differences in brain areas, hormone levels, signalling differences, genetic variances. There's nothing stopping us from binning EVERY INDIVIDUAL into their own bin.
Technically, this wouldn't be "infinite sexes" but 7.4 billion sexes is functionally close for our brains. Now, our medicine isn't advanced enough for THAT level of detail to make any difference. BUT IT MIGHT BE in the future. Individualized medicine!
The thing to remember is that this isn't "new." We're not 'inventing sexes' here. Sex has ALWAYS been this curve. We were just using REALLY BIG bins. And now we're realizing that that's not representative of biology, it's inhibiting understanding of medicine and biology
In case anyone's curious, this isn't ideology. This is because I had to figure out why my data didn't match the prediction. Those rats I mentioned? Yeah, my lab. And lab rats are a really pure genetic monoculture, and they STILL don't fit the two peak model well.
So, since it's come up, an addendum!
Yes, we looked at other things we could do to make our data fit the existing model, that's how science works! The ONLY way the data fit was if we let "sex" be more than just those two narrow peaks.
Models purpose in science is to predict. If they don't predict correctly, first we check if we've measured the data correctly, and repeat the experiment a couple more times. If it still doesn't fit, we have to look at the model.
Intersex! Because I didn't specifically mention this.
"Intersex" is a grouping bin used for a lot of the "middle ground" of the spectrum between the "male" and "female" peaks. Any situation where easily assigning the person to one of those two peaks is challenging.
Intersex! Because I didn't specifically mention this above.
"Intersex" is a term used to collectively speak of the "middle ground" of biology where people can't easily be binned into those two big "male" and "female" peaks. It can include a large range of biology
It is worth noting that I never talk about transgender in this thread. Intersex is not the same as transgender. You can be one without the other, or be both.
For people who think this is just "outliers"
Current estimates are that the intersex population is at least 2%. We know that's low because there are a lot of "invisibly intersex" people. That means AT LEAST 150 million people in the world.
I apologize for the failure to use the word "intersex" higher up in the discussion. Many people in the middle ground (including the XY person who can carry a child, for example) use this term. I cannot go back and edit the thread, and apologize for my overly clinical description.
Part of the purpose of the thread, which may have failed, was to point out that "intersex" is not a condition, it is not a disease. It's natural with a bimodal distribution. Science not only supports this, it suggests that ignoring intersex people makes your conclusions wrong
References at the end of this page.
67 notes
·
View notes
Text
Time for another live study

This time it's for math
Topics to get through:
• Graphs (translations)
• Radian measure
• Functions
• Trigonometric functions
• Trigonometric identities & equations
• Partial fractions & modulus
• Differentiation
• Integration
44 notes
·
View notes
Text
Reading about intersex variations is so fascinating because you start seeing how little distinction there is between certain terms.
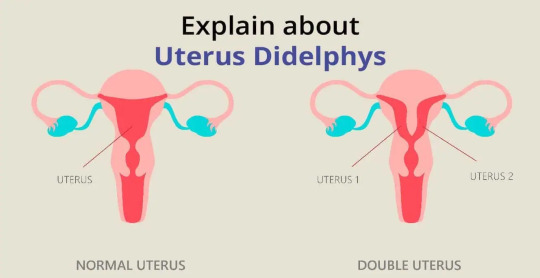
What is the difference between a bicornuate uterus, septate uterus, and uterus didelphys? Well, to some doctors, the diagnosis is completely inconsistent and based on "vibes" basically.
Bicornuate uterus is supposed to be a "heart shaped uterus". Septate uterus is supposed to be a "uterus with a partition down the middle."
Uterus didelphys is meant to be "two distinct uteruses," either separated or fused, but each with their own space.
Now, here are photos of what doctors call "bicornuate." Notice how the "complete bicornuate" is literally two separate uteruses, just fused together.


Here are photos of what doctors call "uterus didelphys." Once again, notice how it can be basically exactly the same as a "complete bicornuate uterus"?

Generally, people don't consider bircornuate uterus or septate uterus to be intersex. However, you can see in these medical graphs that bicornuate uterus, septate uterus, and uterus didelphys can overlap greatly, to the point where they are hardly distinguishable.


Some doctors argue that uterus didelphys is defined by a double vagina or double cervix, but this argument is also extremely inconsistent and there's no established agreement. Some also argue that its when the two uteruses are separated/non-fused, but like...
Look at this. These are examples with a singular cervix.
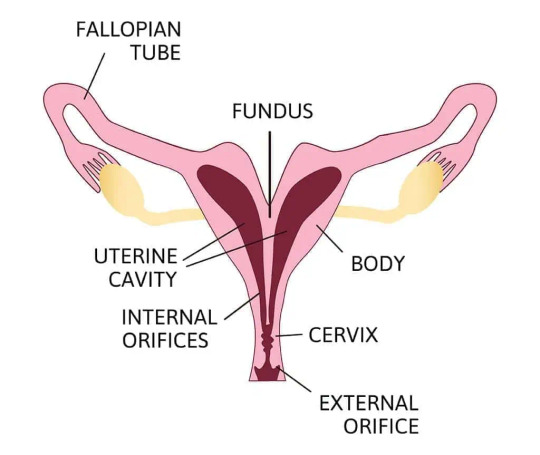
People get diagnosed with bicornuate uterus or septate uterus by some doctors, and uterus didelphys by others, because these structures can look and function in practically identical ways.
In conclusion, if you have a uterine structure that separates it into two fully distinct spaces, we personally think that you can identify with uterus didelphys, and can call yourself intersex. But thats just our own two cents.
We've also seen people in the intersex community discuss this exact topic before and come to the same conclusion. Hence why we fell down the rabbit hole.
#lgbtqia#lgbtq#lgbt#queer#lgbt pride#intersex#intersex community#intersex spectrum#body diversity#educate yourself#intersex awareness#uterus didelphys#bicornuate uterus#septate uterus#double uterus#uterinehealth
17 notes
·
View notes
Text
FOUND IT! these are the ambition ending statistics from a few years back. they've probably changed by now but this is the nicest and clearest graph i can find for them. obvious major spoilers for all four fallen london ambitions under the cut

note that the nemesis resurrection endings are all listed separately even though functionally they're pretty much identical. and the absolutely miniscule amount of people that chose to spare veils the intriguer, apparently. cowards.
#it's okay society of the three fingered hand i still love you. if nothing else you're still in the running for greylu's BaL ending#yin-thoughts#fallen london#fallen london spoilers#light fingers spoilers#nemesis spoilers#bag a legend spoilers#heart's desire spoilers#all four ambition spoilers really#i love this graph. look at all those false stars. and all those cardses. glorious
19 notes
·
View notes
Text
Calculating the theoretical downfall of my shrambling empire
We can do this using a little algebra! :3
First to get the equation for the balance of our shrambing empire balance, this is just a compound interest problem since each bet is 3% of our current balance! We started the season with $1000, but we've since had some wins and losses affect our balance since them, we'll just start with our balance before the first loss of this streak as our principal amount: $955.86 on 2025 Jan 14! (Georgiev's 2nd win as a Shark and the 3rd (and final) game in the Pickles win streak!) (also keeping in mind i forgot to bet on that Boston game ;-; but maybe for the better because they lost that one too lol)
We can pop this into the compound interest formula and get the equation "y = 955.85 * 0.97^x", where "y" = the balance after "x" games played. But for anyone following along who happens to not know this formula we can easily derive it like so:
Let y0 represent the initial balance before any given game and let y1 represent the balance after any given game
y1 is equal to y0, minus the amount of our shrambling bet
The amount of our shrambling bet is 3% of our y0, or "0.03 * y0"
Therefore "y1 = y0 - (0.03 * y0)"
We can rewrite this using the distributive and identity properties as "y1 = (1 * y0) - (0.03 * y0)" -> "y1 = (1 - 0.03) * y0"
Simplify to "y1 = 0.97 * y0" -> here is our recursive function! :D we can use this to get the balance before or after a bet, given we are always betting the max on the sharks and know either the amount before or after!
Since each consecutive balance is the previous one multiplied by 0.97, we can get any balance by multiplying the initial balance (our $955.85) by 0.97, one time per each game played (assuming the loss streak continues) since then!
We can write this rule as a function to make an explicit function for our account balance after any # of games: "y = 955.85 * 0.97^x". ta-daaaa :3 all done!
Here's our function graphed on Desmos, plus a table of some key points on the graph! + a bonus graph of our permitted bet amount (3% of our account balance!)

This model will predict our balance values a little low btw, because our max possible bet has to be rounded down to the nearest cent on NHL66. But I think that the rounding error is negligible for our purposes here
As can be seen in the notes of this post, the people clamor for the downfall of my shrambling empire.... so let's see exactly when we would hit these milestones, assuming the Sharks loss streak continues! :D
Scenario #1: net loss of $500 via @puckpocketed
We can just calculate this from our "y = 955.85 * 0.97^x" equation! Substitute the $500 balance into y, then solve for x games played by dividing the $500 balance by 955.85, then taking the log base 0.97 of 500 divided by 955.85....or convert to log base 10's if your calculator doesn't just have a log base 0.97 function lying around lol
Anyways! Our solution (to the thousandth) is 21.274 losses, and obviously we can't have fractions of games played in terms of bets which are discrete/only counted per whole game played. Thus, we can see on our table that we will have lost $500 (in fact, $510.93!) after 22 games lost in a row! This is possible, as we have bet on 4 losses already, so we need to lose only 18 more bets in a row! :) There are currently 31 games left in the season! :)
Scenario #2: negative balance via @proceedwcandy
Due to the 3% cap on our bets, as our balance gets smaller, so too will our bets.... we will cannot enter shrebt (sharks debt) by this model :(. (We can verify this by attempting to take the x-axis intercept, where y = 0 or any negative value, the same way we did for scenario #1 and we will get an undefined value. Plus we can see from the graph that even if we kept zooming out it would never go to a negative value.... Sad! Such is the nature of an exponential function with no vertical shift down.... u_u)
However! There is a stipulation in NHL66 rules where once the maximum bet amount reaches $2, it will stay there. We can find the balance at which we reach this minimum cap—$2 is 3% of $66.666... going on forever, but we'll round up to the nearest cent at $66.67. We would reach this amount after 87.423 losses, and again we must round up, so after betting on 88 losses in a row (or 84 losses from now) our max bet from then on will be $2!
After that the scenario is represented by a linear function, "y = -2x + 65.51" (65.51 is our balance after this, rounded up to the nearest cent), so we can find the point at which we would go into shrebt! If we have y = $0 and solve for x, we get 32.755 more losses (on top of the 88 losses to get to this threshold) to get to $0, or 33 more losses to get a negative balance! (not that NHL66 will actually let me do this, they'd just cap that last bet at however much I have left :P but we'll ignore that for this hypothetical)
Tl;dr: It would take 121 losses in a row (or 117 more losses) to get a negative balance! We. um. Well, we do not have that many games left in the season to lose! ^_^" but, well.... who am i to doubt the prowess of the psiionic warriors manifesting my downfall...... ">_>
13 notes
·
View notes
Text
Hydrogen bomb vs. coughing baby: graphs and the Yoneda embedding
So we all love applying heavy duty theorems to prove easy results, right? One that caught my attention recently is a cute abstract way of defining graphs (specifically, directed multigraphs a.k.a. quivers). A graph G consists of the following data: a set G(V) of vertices, a set G(A) of arrows, and two functions G(s),G(t): G(A) -> G(V) which pick out the source and target vertex of an arrow. The notation I've used here is purposefully suggestive: the data of a graph is exactly the same as the data of a functor to the category of sets (call it Set) from the category that has two objects, and two parallel morphisms from one object to the other. We can represent this category diagrammatically as ∗⇉∗, but I am just going to call it Q.
The first object of Q we will call V, and the other we will call A. There will be two non-identity morphisms in Q, which we call s,t: V -> A. Note that s and t go from V to A, whereas G(s) and G(t) go from G(A) to G(V). We will define a graph to be a contravariant functor from Q to Set. We can encode this as a standard, covariant functor of type Q^op -> Set, where Q^op is the opposite category of Q. The reason to do this is that a graph is now exactly a presheaf on Q. Note that Q is isomorphic to its opposite category, so this change of perspective leaves the idea of a graph the same.
On a given small category C, the collection of all presheaves (which is in fact a proper class) has a natural structure as a category; the morphisms between two presheaves are the natural transformations between them. We call this category C^hat. In the case of C = Q, we can write down the data of such a natural transformations pretty easily. For two graphs G₁, G₂ in Q^hat, a morphism φ between them consists of a function φ_V: G₁(V) -> G₂(V) and a function φ_A: G₁(A) -> G₂(A). These transformations need to be natural, so because Q has two non-identity morphisms we require that two specific naturality squares commute. This gives us the equations G₂(s) ∘ φ_A = φ_V ∘ G₁(s) and G₂(t) ∘ φ_A = φ_V ∘ G₁(t). In other words, if you have an arrow in G₁ and φ_A maps it onto an arrow in G₂ and then you take the source/target of that arrow, it's the same as first taking the source/target in G₁ and then having φ_V map that onto a vertex of G₂. More explicitly, if v and v' are vertices in G₁(V) and a is an arrow from v to v', then φ_A(a) is an arrow from φ_V(v) to φ_V(v'). This is exactly what we want a graph homomorphism to be.
So Q^hat is the category of graphs and graph homomorphisms. This is where the Yoneda lemma enters the stage. If C is any (locally small) category, then an object C of C defines a presheaf on C in the following way. This functor (call it h_C for now) maps an object X of C onto the set of morphisms Hom(X,C) and a morphism f: X -> Y onto the function Hom(Y,C) -> Hom(X,C) given by precomposition with f. That is, for g ∈ Hom(Y,C) we have that the function h_C(f) maps g onto g ∘ f. This is indeed a contravariant functor from C to Set. Any presheaf that's naturally isomorphic to such a presheaf is called representable, and C is one of its representing objects.
So, if C is small, we have a function that maps objects of C onto objects of C^hat. Can we turn this into a functor C -> C^hat? This is pretty easy actually. For a given morphism f: C -> C' we need to find a natural transformation h_C -> h_C'. I.e., for every object X we need a set function ψ_X: Hom(X,C) -> Hom(X,C') (this is the X-component of the natural transformation) such that, again, various naturality squares commute. I won't beat around the bush too much and just say that this map is given by postcomposition with f. You can do the rest of the verification yourself.
For any small category C we have constructed a (covariant) functor C -> C^hat. A consequence of the Yoneda lemma is that this functor is full and faithful (so we can interpret C as a full subcategory of C^hat). Call it the Yoneda embedding, and denote it よ (the hiragana for 'yo'). Another fact, which Wikipedia calls the density theorem, is that any presheaf on C is, in a canonical way, a colimit (which you can think of as an abstract version of 'quotient of a disjoint union') of representable presheaves. Now we have enough theory to have it tell us something about graphs that we already knew.
Our small category Q has two objects: V and A. They give us two presheaves on Q, a.k.a. graphs, namely よ(V) and よ(A). What are these graphs? Let's calculate. The functor よ(V) maps the object V onto the one point set Hom(V,V) (which contains only id_V) and it maps A onto the empty set Hom(A,V). This already tells us (without calculating the action of よ(V) on s and t) that the graph よ(V) is the graph that consists of a single vertex and no arrows. The functor よ(A) maps V onto the two point set Hom(V,A) and A onto the one point set Hom(A,A). Two vertices (s and t), one arrow (id_A). What does よ(A) do with the Q-morphisms s and t? It should map them onto the functions Hom(A,A) -> Hom(V,A) that map a morphism f onto f ∘ s and f ∘ t, respectively. Because Hom(A,A) contains only id_A, these are the functions that map it onto s and t in Hom(V,A), respectively. So the one arrow in よ(A)(A) has s in よ(A)(V) as its source and t as its target. We conclude that よ(A) is the graph with two vertices and one arrow from one to the other.
We have found the representable presheaves on Q. By the density theorem, any graph is a colimit of よ(V) and よ(A) in a canonical way. Put another way: any graph consists of vertices and arrows between them. I'm sure you'll agree that this was worth the effort.
#math#adventures in cat theory#oh btw bc よ is full and faithful there are exactly two graph homomorphisms よ(V) -> よ(A)#namely よ(s) and よ(t)#which pick out exactly the source and target vertex in よ(A)
100 notes
·
View notes
Text
cw for mentions of abuse, violence, self harm, suicide, substance abuse, etc (none of it goes into detail at all)
Text in images and resources under cut
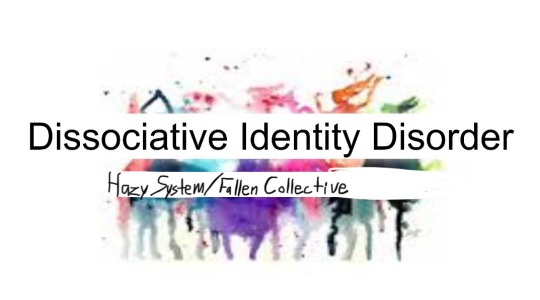
Dissociative Identity Disorder
Hazy System / Fallen Collective
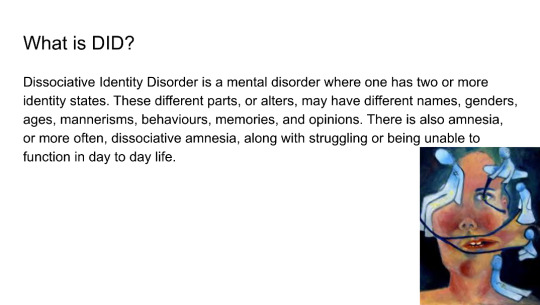
What is DID?
Dissociative Identity Disorder is a mental disorder where one has two or more identity states. These different parts, or alters, may have different names, genders, ages, mannerisms, behaviours, memories, and opinions. There is also amnesia, or more often, dissociative amnesia, along with struggling or being unable to function in day to day life.
(A picture of a fragmented person with smaller humanoid figures is in the bottom right corner)
Causes of DID
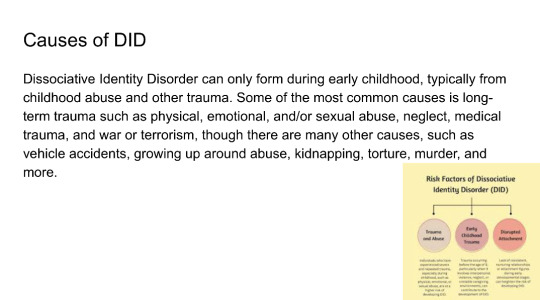
Dissociative Identity Disorder can only form during early childhood, typically from childhood abuse and other trauma. Some of the most common causes is long-term trauma such as physical, emotional, and/or sexual abuse, neglect, medical trauma, and war or terrorism, though there are many other causes, such as vehicle accidents, growing up around abuse, kidnapping, torture, murder, and more.
(A picture that provides a graph titled: Risk Factors of Dissociative
Identity Disorder (DID) then a circle that says: Trauma and Abuse, below it says: Individuals who have experienced severe and repeated trauma, especially during childhood, such as physical, emotional, or sexual abuse, are at a higher risk of developing DID. A second circle says: Early Childhood Trauma, below it says: Trauma occurring before the age of 9, particularly when it involves interpersonal violence, neglect, or unstable caregiving environments, can contribute to the development of DID. A third circle says: Disrupted Attachment, below it says: Lack of consistent, nurturing relationships or attachment figures during early developmental stages can heighten the risk of developing DID.
Symptoms of DID
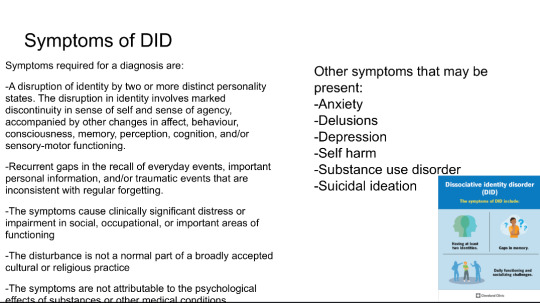
Symptoms required for a diagnosis are:
A disruption of identity by two or more distinct personality states. The disruption in identity involves marked discontinuity in sense of self and sense of agency, accompanied by other changes in affect, behaviour, consciousness, memory, perception, cognition, and/or sensory-motor functioning.
Recurrent gaps in the recall of everyday events, important personal information, and/or traumatic events that are inconsistent with regular forgetting.
The symptoms cause clinically significant distress or impairment in social, occupational, or important areas of functioning
The disturbance is not a normal part of a broadly accepted cultural or religious practice
The symptoms are not attributable to the psychological
effecte of cubstances.or other medical conditions
An image in the bottom right corner is titled: Dissociative identity disorder
(DID)
The symptoms of DID include: Having at least two identities. Gaps in memory. Daily functioning and socializing challenges.
And then at the bottom it gives the resource name, Cleveland Clinic
Prevalence of DID
Most current studies show dissociative identity disorder is diagnosed to 0.1% to 2% of the global population, though a few give estimates to as high as 3%-5%.
DID is often seen as a very rare disorder, but that's not entirely true. If a prevalence rate of 1.5% is accepted for DID, it is comparable to chronic major depressive disorder (1.5%), bulimia nervosa in women (0.46%-1.5%), and obsessive compulsive disorder (1.1%-1.8%); it is more common than intellectual disability (1%), autism spectrum disorder (1%-2% in the United States but 0.62% globally), schizophrenia (0.3%-0.7%), and persistent depressive disorder (dysthymia) (0.5%); and it is only slightly less common than panic disorder (1.7%-3%), adult ADHD (2.5%), and bipolar 1, bipolar 2, and bipolar disorder not otherwise specified combined (1.8%-2.7%)
Treatment
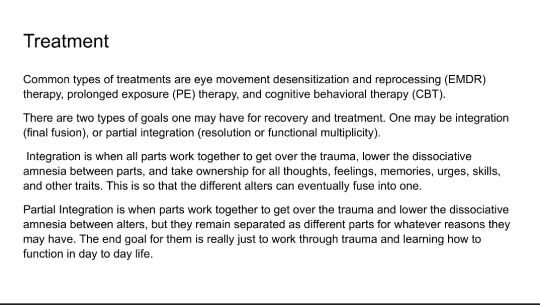
Common types of treatments are eye movement desensitization and reprocessing (EMDR) therapy, prolonged exposure (PE) therapy, and cognitive behavioral therapy (CBT).
There are two types of goals one may have for recovery and treatment. One may be integration (final fusion), or partial integration (resolution or functional multiplicity).
Integration is when all parts work together to get over the trauma, lower the dissociative amnesia between parts, and take ownership for all thoughts, feelings, memories, urges, skills, and other traits. This is so that the different alters can eventually fuse into one.
Partial Integration is when parts work together to get over the trauma and lower the dissociative amnesia between alters, but they remain separated as different parts for whatever reasons they may have. The end goal for them is really just to work through trauma and learning how to function in day to day life.
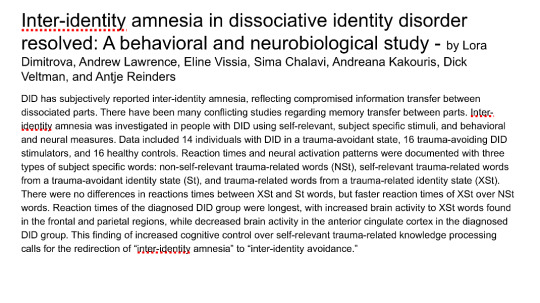
Inter-identity amnesia in dissociative identity disorder resolved: A behavioral and neurobiological study - by Lora Dimitrova, Andrew Lawrence, Eline Vissia, Sima Chalavi, Andreana Kakouris, Dick Veltman, and Antje Reinders
DID has subjectively reported inter-identity amnesia, reflecting compromised information transfer between dissociated parts. There have been many conflicting studies regarding memory transfer between parts. Inter-identity amnesia was investigated in people with DID using self-relevant, subject specific stimuli, and behavioral and neural measures. Data included 14 individuals with DID in a trauma-avoidant state, 16 trauma-avoiding DID stimulators, and 16 healthy controls. Reaction times and neural activation patterns were documented with three types of subject specific words: non-self-relevant trauma-related words (NSt), self-relevant trauma-related words from a trauma-avoidant identity state (St), and trauma-related words from a trauma-related identity state (St).
There were no differences in reactions times between XSt and St words, but faster reaction times of XSt over NSt words. Reaction times of the diagnosed DID group were longest, with increased brain activity to XSt words found in the frontal and parietal regions, while decreased brain activity in the anterior cingulate cortex in the diagnosed DID group. This finding of increased cognitive control over self-relevant trauma-related knowledge processing calls for the redirection of "inter-identity amnesia" to "inter-identity avoidance."
Other Information
Quite a few people believe that DID can make someone violent, but that's not entirely true. Horror movies, and most media overall, that feature characters with DID have contributed to this myth and may even be responsible for it. DID is a controversial diagnosis partially because of the fear of criminals avoiding punishment if it is claimed that another alter did the crime; this is also not something that can happen, because if one part commits a crime, the individual as a whole will face punishment. A 2017 study shows that among 173 individuals with DID in treatment had low involvement with criminal justice system. The myth that people with DID are dangerous only further stigmatizes the disorder.
Other Information
The most probable first documentation of DID was in 1584, by Jeanne Fery.
Though convinced it was possession at the time, her recording of her symptoms match up with those with DID today. She had multiple alters, each with their own name, identity, and identifying features. The parts she documented would today be described as an internal self helper (ISH), persecutory protectors, and child alters. Her alters actions ranged from helping her heal to self harm to disordered eating, could be hear in her head, and could take control of her body, and had changes in knowledge and skills. The alters resulted in childhood physical and possible sexual abuse.
Resources: https://my.clevelandclinic.org/health/diseases/9792-dissociative-identity-disorder-multiple-personality-disorder
#long post#did#dissociative identity disorder#dissociative disorder#cdd#complex dissociative disorder#did info#did information#dissociative identity disorder info#endos dni
9 notes
·
View notes
Text

never ask a cynapspew without a strong sense of identity about identity it will tell you to step outside of time and consider functions.
"do you have a personality" so consider a graph of the function y = 3x + 2
5 notes
·
View notes
Text

By: Colin Wright
Published: Mar 5, 2024
The field of “gender medicine” has been under intense scrutiny in recent years. This attention arises from the sharp increase in the number of children and adolescents—predominantly girls—seeking treatment, with some estimates indicating more than a 40-fold rise since 2010 in many Western countries.

[ Graphs from the��Society for Evidence-based Gender Medicine (SEGM) website. ]
Critics are particularly concerned with this previously overlooked branch of medicine because it treats what is fundamentally a psychological condition with extreme and irreversible body modification procedures that often result in infertility. This practice would be alarming enough if it were limited to adults, but its widespread application to children has prompted widespread alarm.
The World Professional Association for Transgender Health (WPATH) is frequently referenced as the leading authority on transgender medicine, and its Standards of Care (SOC) are considered the gold standard. However, even a cursory examination of this ostensibly serious medical organization reveals significant issues. For instance, the latest version of their standards (SOC8), published in 2022, eliminated recommended minimum age limits for certain interventions, removed the ethics chapter entirely, and introduced a chapter on individuals who identify as eunuchs, exposing WPATH’s radical agenda.
The release of the “WPATH Files” by Environmental Progress delves deeper, exposing the extreme ideology driving the push to transition children, as revealed through WPATH’s internal communications. These documents highlight a discrepancy between the activist doctors’ private agendas and their public statements, suggesting that their outward confidence masks a reality: they are aware they are conducting a vast, troubling experiment on mentally distressed children and adults.
The details of the WPATH Files will be fleshed out in many articles in the coming days and weeks. Rather than rehash the shocking details and revelations, I want to focus on a particularly striking aspect of the Files. This aspect metaphorically resembles a situation where first graders are tasked with overseeing kindergartners.
The section in question, titled “WPATH Knows Children Do Not Understand the Effects of Hormone Therapy,” features video footage from an internal Identity Evolution Workshop held by WPATH on May 6, 2022. During this workshop, panel members candidly discuss, contrary to their Standards of Care, why it isn’t possible to obtain proper informed consent from young patients seeking cross-sex hormones.
Canadian endocrinologist Dr. Daniel Metzger pointed out the difficulty in explaining complex medical information to individuals “who haven’t even had biology in high school yet.” He noted that even adults often lack a basic medical understanding of concepts that medical and mental health professionals consider basic knowledge. He emphasized that children do not comprehend how hormones function, as evidenced by their mistaken belief that they can selectively masculinize or feminize individual traits with cross-sex hormones, not understanding that hormones affect any tissue with the appropriate receptor systemically.
I find it darkly amusing that while these doctors express concern over their patients’ lack of basic biology knowledge regarding hormones, biologists like myself express dismay at the profound ignorance of basic sex biology exhibited by these medical professionals. Indeed, the entire premise of “gender-affirming care” rests on extreme biological pseudoscience.
Proponents of gender medicine hold the belief that each individual has a unique, unchangeable “gender identity,” akin to a soul, that can be discerned as early as three years old, and perhaps even earlier. They argue that biological sex—being male or female—is a social construct rather than a natural fact. According to them, “male” and “female” are merely arbitrary groupings of traits we have culturally labeled as sex-specific. They suggest that rather than individual humans being distinctly male or female, a person’s sex exist on various “levels,” including chromosomes, hormones, genitals, behavior, and even brain structure. Most consequentially, they believe that a person’s sex can vary along a spectrum at each level, potentially leading to discrepancies between them. When a person’s “sex assigned at birth,” based on observing their genitals, does not align with a person’s brain sex (i.e. “gender identity”), this person is deemed transgender.
The objective of gender medicine is to align a person’s physical sex with their self-perceived brain sex through “gender-affirming care,” which may include social transition, puberty blockers, cross-sex hormones, and surgery.

[ A graphic depicting the goal of gender-affirming care. The top scale with a male and female symbol represents a person’s physical sex, and the bottom scale with a pink and blue brain represent a persons “brain sex” (i.e. “gender identity”). In this case, the person has physical traits that place them toward the female end of the physical sex spectrum, but has a “gender identity” that’s closer to the male end of the brain sex spectrum. The goal of gender-affirming care is to modify the body with hormones and surgeries to eliminate the perceived brain/body mismatch. ]
None of this is remotely scientific.
In reality, males and females are real natural categories universally defined by the type of gamete (sperm or ova) an organism has the function to produce, and in humans it cannot be altered with hormones and surgeries.
The controversy surrounding “gender-affirming care,” particularly its impact on children and vulnerable young adults, often overshadows the critical examination of the underlying biological misconceptions. It’s crucial to challenge the flawed premise that sex exists as a spectrum on multiple levels and can be altered through medical intervention. This premise ignores the fundamental biological differences between males and females, which entails that the objectives of gender-affirming care are unattainable. Simply put, you cannot fix a “mismatch” between different levels of sex if those levels do not in fact exist.
Biologists have wrongfully assumed that medicine could not stray far from the biological sciences, given its task in repairing and maintaining healthy human bodies. Fixing gender medicine will require normal biologists to challenge the sex pseudoscience rotting its foundatiocpsn. Until then, we will continue to focus on treating symptoms rather than addressing the core issues.
#Colin Wright#The WPATH Files#WPATH Files#World Professional Association for Transgender Health#gender affirming care#gender affirming healthcare#gender affirmation#affirmation model#medical malpractice#medical scandal#medical corruption#ideological capture#ideological corruption#queer theory#gender identity#gender identity ideology#gender ideology#pseudoscience#cosmetic surgery#religion is a mental illness
9 notes
·
View notes
Text
<<Self-Actualization; #1>>
---------------------------------------- >>Terminal Connected - Welcome to the Omninet<< >>Received . Downloading file.. . . . >>Download Success >>Play? Y/N >>Video playing. >> Length - 5:12:27 >> Speaker - [Unknown] ----------------------------------------
[The video starts from the perspective of a camera, seemingly placed on the wall of a large room. The room is clean and sleek, with little to no decoration; if anything, it looks more like a lab. There are several cloning tubes throughout the room. Evenly spaced, lying in two separate rows.] [In each of these pods, is a human. Nearly identical, each of them, though at different stages of growth. Some are mere children; others are half formed, flesh and viscera visible as muscle slowly builds itself from the constant supply of nutrients. Amongst these incomplete facsimiles of life, there stands a single individual.]
"..Project Apantesis, report 203A-II.. Sr. Researcher [REDACTED]. Flashclones are progressing well, with varied levels of developmental maturation. Incorporated DNA from [REDACTED] shows no signs of making any modifications on the bodies of any clones at this time."
[The researcher pauses, scrolling through a data pad. While the information on the screen is not able to be read from the camera's view, various diagrams, graphs, and charts are visible; presumably for the purpose of tracking the project currently ongoing in this lab.]
[The camera pans across the lab, back and forth as the recording progresses. The researcher is not able to be heard saying anything else beyond the occasional inaudible mutter. They can be seen taking notes on the data pad, walking between each of the cloning tubes and cataloging the progress of each one.]
[After some time of this, the video cuts off, seemingly corrupted in the process of transference over the omni-net. The audio still is playing despite this, with the quiet yet ever present hum of air coolers and fans is able to be heard in the background of the blank recording. After roughly an hour, a loud series of bang can be heard in the distance, followed by shouts, the sound of gunshots, and tearing metal.]
[The camera briefly shows video once more, though it's actively glitching as the recording continues. A mech can be seen ripping through a bulkhead into the lab, followed by a shotgun blast focused on a researcher; presumably the same one from earlier. The video cuts out once more, with distant screams, booms, and gunshots sounding off.]
[Eventually, the recording falls silent, the camera showing only a black screen. The silence continues on for several hours, occasionally cutting out again before returning to functionality, the cycle repeating several times.]
[Finally, video returns to the camera, revealing a darkened, destroyed version of the lab. Red emergency lights can be seen blinking, metal is ripped apart and strewn across the floor, and several of the cloning tubes are broken open, with the incomplete clones lying lifeless on the floor, surrounded by pools of liquid which is still flowing from the pods.]
[In one of the few tubes remaining intact, a delicate looking young woman can be seen, appearing to be in her late teens. She floats precariously in the tube, various wires and tubes attached to her body. Her skin is a dusky brown, with long brown hair flowing behind her. Her identity is unknown, except for that she is a perfect replica of the other flashclones in the lab.] [The camera remains trained on the woman for several minutes, remaining in silence. It's an eerie setting, the cloying dark surrounding the edges of the room, hiding things which may or may not be, which might remain. Flashcloned flesh, now decaying without a proper source of nutrients, coating the floor in viscera and rot.] [A twinge of movement is made; her eyes flash open. The camera goes dark.]
---------------------------------------- >>Omninet Connection Terminated<< ----------------------------------------
P.S. “..."
Signed, <Corpseflower>
----------------------------------------
4 notes
·
View notes
Text
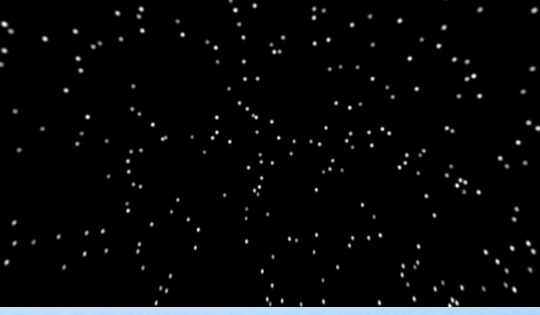
Procedural Skyboxes 2 - Stars


This time I need to credit a second excellent tutorial, this time by Tim Coster. My end result looks very different from this, but the underlying principles were essential.
Process and discussion below the cut.
Mk0 - Voronoi
My first attempt at stars was based off the same tutorial I referenced in the previous post, using Voronoi noise to space the stars. Two inputs control star density and star size.
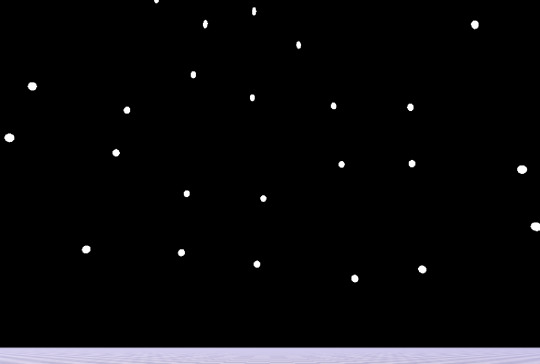

This might work fine for the use case in the tutorial, but in trying to adapt it for mine I immediately encountered some major issues.
the very even spacing feels kinda unnatural, especially with fewer, larger stars
there’s a seam in the sky (probably wouldn’t be visible with smaller stars)
heavy distortion around the sky zenith
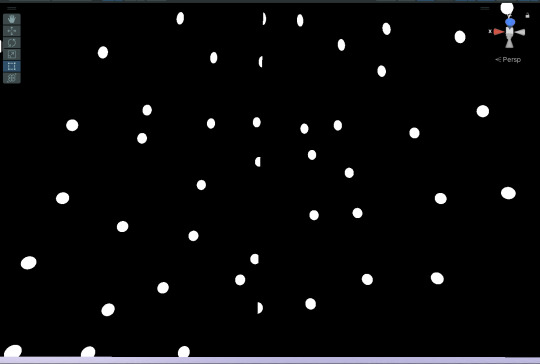
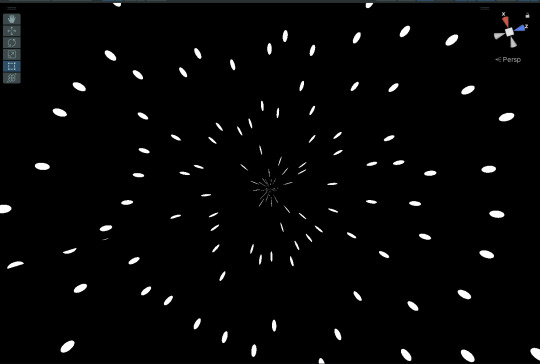
Kinda looks like you're going to hyperspace every time you look up.
The seam and distortion issues are a result of the UVs (the coordinates that determine how the shader wraps around the sky). I solved this by moving to a kinda parachute-shaped UV as outlined in this incredibly helpful post on the Unity forums.
The unnaturally even distribution is a consequence of using Voronoi noise as a base. An entirely new approach was called for, which is where the Coster tutorial comes in.
Mk1 - Tiling with displacement
I skipped the addition of the spiky light flares (not the aesthetic I’m going for) and worked through the tutorial as far as the section on size variation.
The Mk1 shader is a much better fit for the feel I’m looking for, and also looks good when you stare directly up into the sky, not just at the horizons. It also has a lot more controls. Star size remains, and gains an extra control for how much variation in size.


Density now has two controls: one which controls the density of the “tiling” (it’s not a repeating texture, because each tile is randomised, but there is tiling) and one which randomly omits a certain proportion of stars, making the distribution more gappy.

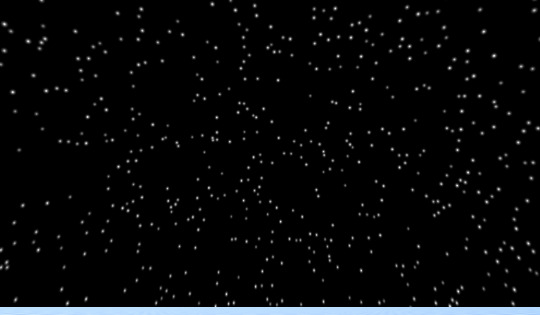

There’s also a control for how randomly the stars are spaced. I probably won’t want to move this much from a value of about 0.8 (1 produces a little more tight bunching than I like), but it’s there.
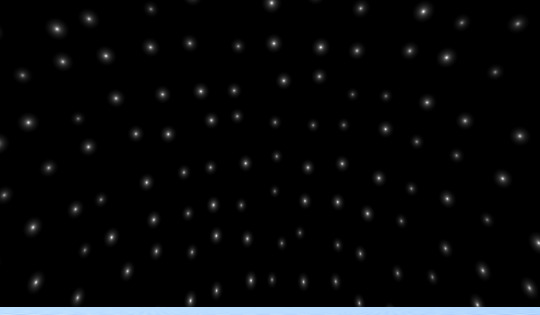
Last but not least, there is a setting for the hardness of the stars. This is going to be important later for modelling the effects of different amounts of atmosphere on the visible starfield.
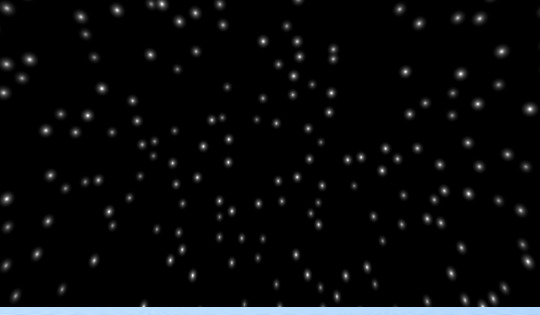

Mk2 - Galaxy Band

In the Mk1 shader, star distribution is even in all directions. The next thing I wanted to add was a band of denser stars across the sky to represent the bulk of the galaxy - as we see the Milky Way as a band across the sky from Earth.
Up to this point I had been using the purely-Shadergraph approach from the tutorial – which involves a very clunky grid of nine nearly-identical subnodes to perform an operation that is much more neatly executed by a for loop in code.
When I started trying to vary star density across the sky, this clunky 9-way graph was no longer adequate. Maybe I could have made it work with the right transformation of inputs, but it reached the point where it made more sense to bite the bullet and learn how to include the HLSL code from the tutorial and edit it to suit.
Once I managed that, feeding in variable density across the sky got a lot easier.
A new control variable, BandIntensity, controls how dramatically stars are grouped into the galactic band.


It was also at this point that I added twinkle, with controls for rate and magnitude. Eventually twinkle and hardness will be tied together, because they’re both functions of amount of atmosphere, but for now they’re separate controls.

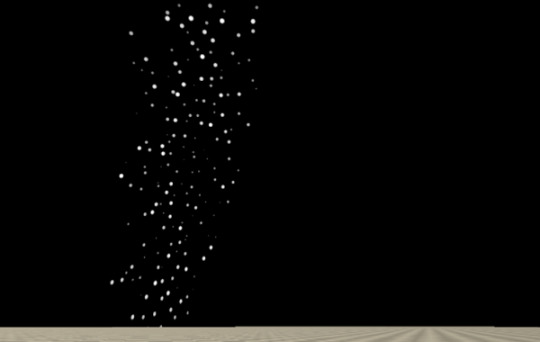
Next I added a band of faint texture behind the stars.
At low hardness, it’s just a soft stripe of Unity’s Gradient Noise. At high hardness, to make it seem “sharper” and more like a dense field of points instead of a smudge, the gradient noise is multiplied by some Simple Noise.


The end result – a pretty good looking, flexible starfield.


Next up, combining it with the atmosphere shader from pt1.
2 notes
·
View notes
Text
Refresh.me is an all-in-one personal financial management tool designed to help users track their finances, manage their investments, monitor credit, and protect their identity. Here is a detailed review of its features and functionalities:
Key Features Account Balance Tracking:
Multi-Account Integration: Refresh.me allows users to connect multiple bank accounts, credit cards, and other financial accounts, providing a comprehensive view of their finances in one place. Real-Time Updates: The platform offers real-time updates on account balances, ensuring users have the most current information at their fingertips. Transaction Monitoring:
Automatic Categorization: Transactions are automatically categorized into predefined categories (e.g., groceries, entertainment, utilities), helping users understand their spending habits.
Custom Tags and Categories: Users can create custom tags and categories to further personalize their transaction tracking. Investment Management:
Portfolio Overview: The tool provides an overview of all investments, including stocks, bonds, mutual funds, and retirement accounts.
Performance Tracking: Users can track the performance of their investments over time, with visual tools such as charts and graphs to illustrate growth and trends.
Credit Monitoring:
Credit Score Updates: Refresh.me offers regular updates on users' credit scores, helping them stay informed about their credit health.
Credit Report Insights: The platform provides insights into factors affecting users' credit scores and offers tips for improvement. Privacy and Identity Protection:
Identity Theft Monitoring: The tool monitors users' personal information for signs of identity theft and provides alerts in case of suspicious activity.
Privacy Controls: Users can manage their privacy settings to control how their data is used and shared, ensuring their information remains secure.
Fraud Resolution Support: In case of identity theft, Refresh.me offers support to help users resolve issues and restore their identity.
Budgeting Tools:
Budget Creation: Users can create budgets based on their income and expenses, setting limits for different spending categories.
Expense Tracking: The platform tracks expenses against the budget, providing alerts when users are nearing their limits.
Financial Planning:
Goal Setting: Users can set financial goals, such as saving for a vacation or paying off debt, and track their progress. Savings Recommendations: The tool offers personalized recommendations for saving money and achieving financial goals faster.
User Interface and Accessibility:
Intuitive Dashboard: The platform features an intuitive and user-friendly dashboard that provides a clear overview of all financial data.
Mobile App: Refresh.me is available as a mobile app, allowing users to manage their finances on the go.
Pros Comprehensive Financial Management: Integrates multiple financial aspects (accounts, transactions, investments, credit, and privacy) into one platform.
Real-Time Data: Provides real-time updates and alerts, ensuring users always have the latest information.
User-Friendly Interface: The intuitive design makes it easy for users to navigate and manage their finances.
Identity Protection: Offers robust tools for monitoring and protecting users' personal information and identity.
Customizable Features: Users can personalize transaction categories, budgets, and financial goals to suit their needs.
Cons Cost: Depending on the pricing structure, the platform may be relatively expensive, especially for premium features.
Learning Curve: New users may require some time to fully understand and utilize all the features effectively.
Data Privacy Concerns: Despite robust privacy controls, some users may have concerns about sharing their financial data with a third-party platform.
Refresh.me is a comprehensive personal financial management tool that provides a holistic approach to managing finances. Its wide range of features, including account tracking, transaction monitoring, investment management, credit monitoring, and identity protection, make it a valuable asset for anyone looking to stay on top of their financial health. While the cost and potential learning curve are considerations, the overall functionality and user-friendly design offer significant value. Refresh.me is an excellent choice for users seeking an all-in-one solution to manage their finances efficiently and securely.
3 notes
·
View notes
Text
The shape of a y=x^2 graph isn't maths. There's no way to prove what it looks like.
Think about when you first learn how to draw a graph: you do it by finding various points on the graph and plotting them, then joining the dots. This plotting is the key to drawing a graph: plotting is a map from abstract mathematical points—really just symbols—to real points, in physical space. And we all learn how to do it early. But there's nothing more right about how we do it than any other way. This might seem obvious—after all, you can plot a polar graph too—that's just a graph from another different way of plotting—there are any number of ways you can parameterize the plane.
One could imagine a completely alien way of plotting points on a page, where straight lines become eldritch monstrosities. This is no more right or wrong than our way of plotting—neither have any justification mathematically—the process of plotting can't even be described mathematically.
One could plot a ZFCircle in this system, and all its properties would translate into properties of the eldritch circle, in just the same way as they do for our circles. ZFCircles don't 'look like' our circles any more than they 'look like' those eldritch circles. All the reasons we say ZFCircles correspond to our circles are also reasons ZFCircles correspond to eldritch circles. Both are equally valid ways of translating ZFCircles to physical space. So I don't see how ZFCircles can be said to capture any notion of shape at all.
You might think we can describe the plotting mathematically: we can model the paper we draw on with R^2 and, for example, plotting as a radial graph is then described by the function: (r, θ) → (r cos θ, r sin θ), and the alien plot is described by the ugliest formula imaginable. The Cartesian plot is described by the identity map. But that's only the case because our starting point is an analogy between R^2 and our graph paper, using the Cartesian plot. If, for example, we thought of R^2 in radial coordinates, we would describe the Cartesian plot as (x, y) → (sqrt(x^2+y^2), arg(x, y)).
So we describe the same plot with a different function depending on which other plot we are used to using. Which means we cannot actually capture the plot itself in maths—only how it relates to other plots—which we capture as the notion of a change of coordinates.
But then, analogizing a plot to a function can't break us out of the purely algebraic world and let us describe shapes. That function that we tried to take as an analogy for the radial plot isn't any more objectively an analogy for the radial plot than any other bijection R^2 → R^2. So studying this function cannot directly tell us anything about the radial plot.
The only way we get information back about the radial plot is by translating algebraic facts about that function into geometric facts using the Cartesian plot we started with—which we were trying to justify in the first place. Attempts to justify the analogy between shapes and algebra mathematically are doomed to always end up just chasing their own tail.
Geometry is founded on faith.
7 notes
·
View notes
Text
Gone Fishin'
I just returned from the Association for Jewish Studies' annual conference, which I very much enjoyed (though unfortunately I had to bail early). A thought I had while I was there -- and in retrospect, I maybe should have asked fellow attendees -- relates to the relationship of Jewish identity and anti-Israel sentiment amongst left-of-center Jews. Basically, my hypothesis is that this relationship looks like a fish hook: anti-Israel sentiment is highest amongst Jews who are least connected to their Jewish identity, drops as one moves to those with some connection, but then goes up again (albeit not as extensively) amongst those who feel very strongly connected to their Jewish identity. Some of this is anecdotal. Certainly, the sense that persons who lack substantial connection to their Jewish identity tend to hold Israel in the lowest regard is well-known. But one also cannot ignore the growing Israel-critical sentiments amongst persons whose Jewish identity is clearly central to their personal and professional lives. The absolute panic one is seeing in some quarters claiming that "Jewish Studies" has become an anti-Israel hot house, though wildly overstated quantitatively, is certainly testament that there's some phenomenon at work here. Here's my theoretical model. Israel, and connection to it, is descriptively speaking an important part of Jewish life even in the diaspora. Disassociating from it therefore comes at a cost for people connected to the Jewish community. For Jews who have relatively little in the way of connection to their Jewish identity, this cost is functionally absent -- they weren't especially linked to the broader Jewish community to begin with, so they aren't really losing anything by dropping this aspect of Jewish identity. For Jews whose Jewish identity is comparatively stronger, by contrast, the sacrifice is real and is substantial, and indeed may be overwhelming for persons whose connections to organized Jewish life are modest. If one does care about one's Jewish identity but does not overflow with avenues for expressing it, losing even one prominent modality of connection to Jewish peoplehood may swamp everything else. But as we move to the most-connected Jews, their Jewish identity is rich and secure enough that they can afford to jettison individual elements that are not working for them. They have plenty of ways of being Jewish that can replace affinity for or connection to Israel. I offer this hypothesis purely descriptively -- I'm not saying any Jew of any level of connection to their Jewish identity is behaving "rightly" or "wrongly" in associating or not with Israel to any particular degree. And so mostly, I'm curious if the hypothesis has descriptive accuracy to it. I know the general data suggests that degree of connectivity to Judaism is negatively associated with anti-Israel sentiment, so I'm really curious if its a pure downward slide or if there is that "fish hook" bump at the right edge of the graph. via The Debate Link https://ift.tt/oWQu7qP
3 notes
·
View notes