#python graphs
Explore tagged Tumblr posts
Visit Tumblr Blog
Explore Tumblr blogs with no restrictions, modern design and the best experience.
Last Seen Tumblr Blogs


Fun Fact
BuzzFeed published a report claiming that Tumblr was utilized as a distribution channel for Russian agents to influence American voting habits during the 2016 presidential election in Feb 2018.
Text
Death by a thousand cuts in my class this week
#please feel free to ignore this#Jake meets world#I'm going to be really busy the next couple of weeks so I've been working ahead#In (almost) all my other classes every assignment except the exams is available right at the start of the semester#so you could theoretically do the whole thing right away#Not this class#The assignments are locked so you can only start them like 2-3 weeks before they're due#And the assignment I'm working on now is so tedious and confusing#Half of the questions are like 'invent a formula! Now optimize it!'#This is not the invent a formula class this is the AI class#I also just hate having to graph really big datasets because it's such a pain lol#Can't really do it in Excel and trying to do it in Python is like trying to force a mouse to be a rabbit#Also for some reason they have a FAQs document separate from the assignment#so you have to like read the assignment and then read the FAQs to make sure you're doing it correctly#Just put the assignment information in the assignment? Modify the instructions to include this?
6 notes
·
View notes
Text
fighting for my life trying to defend python from computer science students. she's my beautiful wife and she makes lovely graphs, don't insult her
#literally everything in physics is done using python and its served us perfectly well >:(#just today i made a beautiful graph of my transmission spectra in python#at least we agree that r sucks. rip to biologists and statisticians
2 notes
·
View notes
Note
just read your charles and carlos comparison and am popping by to say it was excellent keep up the good work! also i know latex formatting when i see it...........
Hi anon I'm glad you enjoyed it! I'm giggling that you managed to pick out the latex content from sight.....just for context, I typed those tables up in the main doc of my thesis because it was the most convenient latex compiling tool I had open at the time...truly a woman in STEM moment if I may say so myself.
#asks#anon#there were also graphs involved that I did some python hijinks with the fastf1 python module but i couldn't get them to portray anything#useful i wasn't already saying#anyway stem moment
14 notes
·
View notes
Text
every time i try to put a god damned legend on this graph with seven lines on it my laptop literally freezes for minutes at a time so i can only click one thing before it goes non-responsive again. which is pretty much a great summary of how this stupid capstone project is going.
#i hate microsoft excel so much#science side of tumblr help me. i’m graphing UV spectra. i need several spectra on one graph. my python is not working for some reason#i mean it won’t open a new notebook. otherwise i would use matplotlib#i don’t know anything else. is there any software i can use#i’m sorry i’m very young and stupid i don’t know why i’m going for a phd either
5 notes
·
View notes
Text

• Music • Xenharmonics • 45 EDO • Isomorphic Keyboard • 31 EDO • Just Intonation • Harmonic Series • Jazz • Saxophone • Composition • Time Signatures • 41/32 • 35/16 • 23/16 • Bytebeats • Math • Calculus • Physics • Geometry • Fractals • Abstract Spaces • Complex Numbers • Fractals • Graph Theory • Graphic Design • Typography • Fonts • Art • Traditional Art • Calligraphy • Pixel Art • Gaming • Game Design • Coding • Python • Character Design • Playing Games • Minecraft • Roblox • Dandy's World • Worldbuilding • Language Creation • Kakaluʒi • Writing • Cryptography • Creating Ciphers • Decoding Ciphers ...and more!
What is your neurodivergent topic of interest?
#music#xenharmonic#just intonation#harmonic series#jazz#saxophone#btyebeat#math#calculus#physics#geometry#fractals#complex numbers#graph theory#graphic design#typography#fonts#calligraphy#gaming#game design#python#python programming#minecraft#roblox#dandy's world#dandy's world roblox#worldbuilding#conlang#conlanging#cryptography
479 notes
·
View notes
Text
third year of the phd and this is the first time i'm implementing functional programming. what have I been DOING until now
#so so so SO fucking useful. I have about 50 graphs coded and in each jupyter notebook repeat the code. changing is a nightmare#and now. i have a functions file. and it's so much FASTER#python and I are unfriends on most days but this has been a big fucking gift
1 note
·
View note
Text
Me when I manage to bypass the obstacles the interface has placed on me and finally gain access to the forbidden texts
(I wasn’t able to install pandas and it took me an hours and multiple YouTube videos to find the problem and just change one property)

#uni talks about the universe#coding#python#pandas#I now realize typing that that it’s probably not going to reach the python and pandas I was intending#eh#also#it might be a stretch#but with the HOURS of videos I have watched and literally only one graph I’ve been able to produce#I don’t think I’m good at coding guys#*looks at the multiple classes that require coding for my degree*#I may have a problem on my hands#but that’s a future me problem#right now me problem is learning what the fuck do I even do with pandas
0 notes
Text
I was looking at the computer science curriculum for 1st year comp sci at my university and as a bioinformatics student the comparison is insane. Ppl who have choose comp sci for their degree have like 4 months to learn how python works where we have 1. They are not taught 4 programming languages per year. They are allowed to acclimatise to the notion that packages exist and sometimes they contain useful functions you don't have to create yourself!
AND YET, WHEN A BIOLOGY PERSON CAN'T INSTANTLY USE PYTHON 1 MONTH INTO A BIOINFORMATICS DEGREE, WE ARE CALLED 'BAD AT PROGRAMMING' --
#personal#the tiny rule follower in my brain is like 'oh but ur doing a master's! you should be able to pick skills up fast!'#but i am still salty that all my classmates use chatgpt and i don't abs yet i was labelled 'bad at programming'#for not being able to pick up perl in a week with zero outside aid#'oh you should be able to use python seamlessly by now' you bastard. you motherfucker. i will recite pH rules to you. fuck u#i adapted to an entirely different country's education system to get a degree in a difficult subject i agreed to do for fun#AND THEN I CAME BACK TO MY COUNTRY OF ORIGIN TO DO AN EVEN MORE DIFFICULT SUBJECT. FOR FUN#i'm NOT fucking stupid. and i'm actually pretty good at programming considering my experience. fuck u#and stop insulting biologists who can't immediately apply graph theory via programming#do you know how many British ppl choose biology so they don't have to do maths past GCSE level. u r so lucky ur french
1 note
·
View note
Text
Devlog 1 - Basic Dice Function (and relevant statistics) (14:17 DST 14/06/2024)
To kickstart my journey let's talk about my dice-rolling function and some very basic and important statistics about fair dice and dice rolls. The core function of any dice-rolling app for any game is the ability to roll fair dice. A six-sided dice (d6 in TTRPG lingo) should give each possible result (i.e. any number from 1-6) 1/6th of the time it is rolled. In principle if you roll the dice six times you should get six different results: 1, 2, 3, 4, 5, and 6. Then if you roll the dice a seventh time you should get a repeat result. Now in practice this won't happen for a small quantity of dice rolls, because the result of a fair dice is random, and so instead the fairness is measure over many, many dice rolls, until eventually it can be said that the dice is fair. Let's consider the actual dice function and how it works. Creating a dice roller is actually rather simple. I made mine by defining a callable function called roll(), with a number of sides that could be inputted (and has a default value of 6 since the purpose of this roller will be for Warhammer). The function then uses a random number generator to generate a number, n, where 0 <= n < 1 (a number between zero and one which could be zero but can't be one). The random number is multiplied by the number of sides which gives a floating point number.
Now for some python syntax. Python contains an in-built function called int(), which converts floating point numbers into integer numbers. It does this through truncation i.e. 0.2 -> 0, 1.4 -> 1, 2.9 -> 2. So our integer result takes a value between 0 and the number of sides minus 1 (for a six-sided dice right now we get 0, 1, 2, 3, 4, or 5). To get valid results for any sided dice we then just add 1 to the random result.
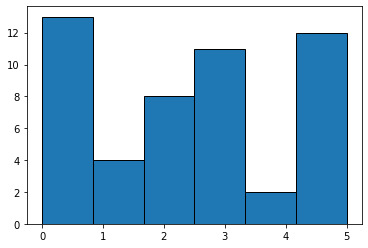
Figure 1. The above shows a histogram of the results of 50 dice rolls before the +1 shift. (Disclaimer: The numbers on the x-axis for all graphs are a mess. Ignore them, each column represents an integer value.)
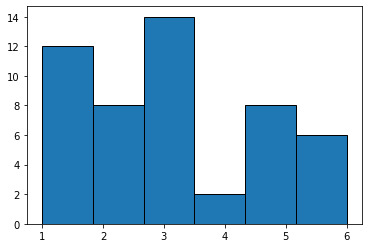
Figure 2. The above shows another histogram of the results of 50 dice rolls this time with the +1 shift. The results are now valid for a d6.
So we have a dice roll function and now we come back to the earlier part of this Devlog, is it fair? Testing this is relatively easy. For a fair dice, if we plot a histogram of a large number of dice rolls (say 5 million), then the resulting graph should show a uniform distribution.
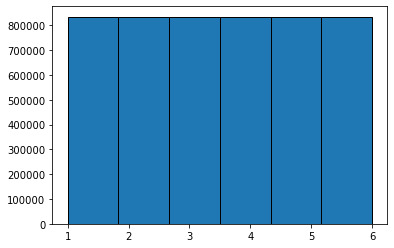
Figure 3. The distribution of results from 5 million dice rolls.
Since this distribution is uniform (there will be fluctuations in each column but they're statistically insignificant when each column contains 800,000+) the dice is fair. But before I sign off this Devlog, lets show one more cool thing about dice. Rolling two dice of the same type (say 2d6) and summing the results gives a normal distribution.
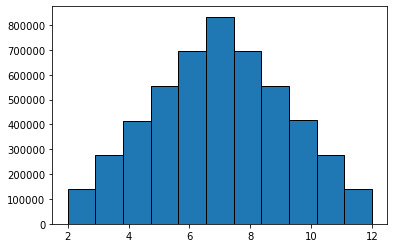
Figure 4. The distribution of 50 million 2d6 rolls.
For anyone wondering why this is cool, this is a little nerdy homage of mine and part of the reason I originally created a dice roller. One of my favourite Dungeons and Dragons youtubers is Matt Colville, who runs a very interesting youtube series called running the game, which teaches people how to Dungeon master. He's also started a board game company spinning off from the channels success who are creating their own TTRPG (which I'm very excited to play). They did a very interesting video about dice a few months ago in which Matt claimed that the result of 2d6 was normally distributed, and me being a nerd I decided I would experimentally test that claim myself rather than taking it on a face value. The result is the original dice roll function and most of the subject of this Devlog. So thank you Matt and the entire team at MCDM.
As a final sign-off from me, I will be uploading the master python file to my GitHub: https://github.com/SamFuller02/WH40kDR. At the moment I'm still figuring out GitHub so for now it may appear a little sloppy but it might improve with time.
Link to the video that inspired me: https://www.youtube.com/watch?v=lvs2OYsJmaY
1 note
·
View note
Text
I (physics student) just helped my computer science student friend with her coding????
#she hates python and python is the only coding language i know lmao#even better shes using it to make graphs which is like the number one thing im good at. matplotlib my beloved
0 notes
Text
0 notes
Text
today i used the fancy graphing calulator (not for graphing but oh well) the last time i needed that thing was 4 years ago...
#my 12 year old 200€ calculator#keeps on trucking no matter how often i let the battery go flat#also funny is that i will accumulate so many calculators once i'm going to be working#for graphing i'm using python now because i actually had to learn that shit so i WILL use it
1 note
·
View note
Text
Bored at work. I just wanna do stats on my own ocs. Let me.
#I wanna use Python and R and make cute graphs for my ocs#I wanna know what my mean height it. do I have outliers?!#my snipping 🦀#my silly ocs
0 notes
Text
Trying to make my graph's legends in matplotlib be consistent is so hard. Why is it that I put the location as lower right it put the legend box on top of the graph???
Screw you matplolib
#coding#codeblr#python#i have so many graphs and tables guys#making them consistent for the report is harder than it should be#seriously considering just editing in like clip studio
0 notes
Text
Did you know you make animations on matplotlib. It blue my mind to realize that and now that I've got a decent grasp on animating plots on matplotlib I can't stop animating any of my plots
60 notes
·
View notes
Text
GRAPHED YOUR HEART — JAKE SIM

## SYNOPSIS. everyone knows that college students are broke. so when jake finds a random graphing calculator (specifically a ti-84 plus ce python edition) on the floor after class, he obviously takes it home with him. after all, it would be stupid to ignore such an expensive calculator. but what happens when y/n notices her name plastered on jake’s new calculator? or rather the very calculator she lost 5 days ago.

PAIRING. college student!jake x fem!reader
GENRE. short smau (like about 20 chapters) + occasional written scenes, strangers to reluctant partners (?) to lovers, one sided beef, humor (like this is literally just for giggles), fluff
WARNINGS. incorrect timestamps, lots of grammar mistakes and typos, there isn’t much plot cause i just thought it was a funny concept, immature humor (deez nuts, ur mom, etc type of jokes), they’re all nerds tbh
STATUS. ongoing! | started 6/12/25
TAGLIST. open! please send an ASK to join. comments will be ignored.
AUTHOR’S NOTE. i came up with this randomly one day after thinking i lost my calculator el oh el anyways i hope you like this <33 (this thing has been hiding in my drafts for almost two years now so … enjoy)
## INTRODUCING THE ELDERY STUDENTS …
PROFILES. hot young and broke 🔥 | women in stem 🔛🔝
FUNCTION #1. #godsfavorite
FUNCTION #2. rip jake the thief 🕊
FUNCTION #3.
PERMANENT TAGLIST (OPEN). @yedamdamn @yujipg @linniely @yebin14 @abdiitcryy @stllsph @valewoos @lovrqis @lilactangerine @amourfae @outrunangelss @flwoie @xiaoderrrr @hsgwrld @ohmykwonsoonyoung @millsielovesgyu @haknom @softpia @squiishymeow @wvnkoi @zi-ever @ml8dy (italics: couldn’t tag)

TAGLIST (OPEN). @yeokii
© 2025 wonieleles. all rights reserved. please do not copy, steal, or repost my works on any platform.
#enhypen smau#enhypen x reader#jake smau#jake x reader#enhypen au#jake au#enhypen imagines#jake imagines#jake x you#jake x y/n#enhypen fluff#jake fluff#enhypen ff#jake ff#enhypen fic#jake fic#enhypen social media au#jake social media au#enhypen scenarios#jake scenarios#enhypen jake#jake sim
170 notes
·
View notes