#How to trade the bearish engulfing pattern
Explore tagged Tumblr posts
Visit Tumblr Blog
Explore Tumblr blogs with no restrictions, modern design and the best experience.
Last Seen Tumblr Blogs


Fun Fact
There were a total of 171.5 billion posts on Tumblr in 2019.
Text
How to Trade the Bearish Engulfing Pattern: Complete Guide with Strategies and Examples
Candlestick patterns are powerful tools in the arsenal of a technical trader. Among the most reliable reversal patterns is the Bearish Engulfing Pattern—a strong signal that can hint at the start of a downward trend. In this guide, we’ll explain how to identify this pattern, why it works, and most importantly, how to trade it effectively with multiple strategies and examples. 📌 What is a Bearish…
#Bearish candle formation#Bearish engulfing candlestick pattern explained#Bearish Engulfing Pattern#Bearish engulfing pattern trading strategy#Bearish reversal pattern#Bearish trend confirmation#Can you trade bearish engulfing in forex?#Candlestick pattern for bearish reversal#candlestick patterns#Confirmation signals for bearish engulfing#EMA confluence with candlestick patterns#Engulfing candle trading rules#Entry and exit with candlestick patterns#Forex bearish engulfing strategy#How to confirm a bearish engulfing signal?#How to trade the bearish engulfing pattern#Is the bearish engulfing pattern reliable?#learn technical analysis#Multi-timeframe candlestick pattern strategy#Price action trading setup#Reversal Candlestick Patterns#Risk management for pattern trading#stock markets#Stock trading with bearish engulfing pattern#support and resistance levels#Swing trading with bearish engulfing#technical analysis#Trading bearish engulfing with moving averages#Trading Strategies#Using bearish engulfing with RSI
0 notes
Text
What to expect from the stock market this week

Last week, the review of the macro market indicators saw with the unofficial start of summer ahead and just 4 trading days left in May, equity markets were mixed with tech strong, large caps flat and small caps lower. Elsewhere looked for Gold ($GLD) to continue to consolidate in the uptrend while Crude Oil ($USO) resumed a short term downtrend. The US Dollar Index ($DXY) might resume the short term move lower while US Treasuries ($TLT) remained in a downtrend. The Shanghai Composite ($ASHR) looked to pause in the short term move higher while Emerging Markets ($EEM) might be confirming a failed break out higher.
The Volatility Index ($VXX) looked to remain very low and stable making the path easier for equity markets to the upside. The charts of the $SPY and $QQQ looked strong, especially on the longer timeframe. On the shorter timeframe the QQQ was also strong with the SPY in consolidation. The $IWM continued to be the outlier, consolidating at a higher range.
The week played out with Gold finding support and holding in a narrow range while Crude Oil consolidated rose early in the week before giving back the gain later. The US Dollar held over support while Treasuries moved higher in the downtrend. The Shanghai Composite held at support while Emerging Markets rocketed to the downside.
Volatility rose up off the recent lows but but only to 14. This put pressure on equities and the large caps and tech names responded with a 4 day move lower. The small caps found support mid week and bounced in consolidation. This resulted in the SPY, IWM and QQQ ending back below their 20 day SMA’s. What does this mean for the coming week? Let’s look at some charts.
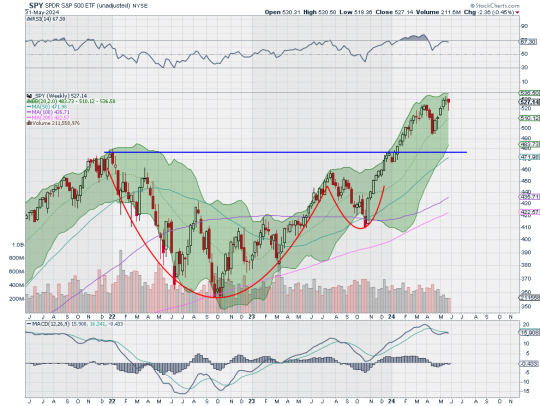
SPY Daily, $SPY

The SPY came into the week consolidating at the all-time high but after a bearish engulfing candle failed to confirm Friday. It held Tuesday and then started to move lower on Wednesday. Thursday it crossed below the 20 day SMA for the first time since May 2nd and dropped again Friday before a strong move higher the last 30 minutes of the day. The RSI is dropping at the midline but in the bullish zone with the MACD crossed down and positive. So far this could just be a momentum reset, with no threat to the uptrend yet.
The weekly chart shows a more damaging pattern as the doji last week is confirmed as a reversal with a move lower this week. This happened as the RSI stalled at a lower high showing a divergence. The price is far from the 20 week SMA and the last pullback found support there. The MACD is crossed down and moving lower but positive. There is support at 520.50 and 517.50 then 513.50 and 510 before 503.50 and 501.50. Resistance higher is at 524.50 and 530. Digestion in Uptrend.
SPY Weekly, $SPY
With the month of May in the books, equity markets showed some signs of weakness following divergences last week. Elsewhere look for Gold to continue its consolidation in the uptrend while Crude Oil consolidates in a narrow range after a pullback. The US Dollar Index continues to drift to in broad consolidation while US Treasuries continue their downtrend. The short term move higher in the Shanghai Composite looks to be at risk of reversing while Emerging Markets enter a short term downtrend.
The Volatility Index looks to remain very low and stable making the path easier for equity markets to the upside. The charts of the SPY and QQQ look strong on the longer timeframe, but with a possible momentum reset continuing in the short run. On the shorter timeframe both the QQQ and SPY have reset to their 20 day SMA’s where they often find support. How they react next week could tell if this week was meaningful or not. The IWM continues to be the laggard, stalled near the top of a 2 year range. Use this information as you prepare for the coming week and trad’em well.
Join the Premium Users and you can view the Full Version with 20 detailed charts and analysis: Macro Week in Review/Preview May 31, 2024
Start of Summer Annual Sale! Hi all the Start of Summer Annual Sale is on at Dragonfly Capital. Get an annual subscription for 38.2% off or pay quarterly for 15% off. Both auto-renew at that discounted rate until you decide to leave.
9 notes
·
View notes
Text
How to read candlestick charts and patterns for better trades?
Candlestick charts are a powerful tool for making better trading decisions. Each candle shows the open, high, low, and close price for a specific time frame. Patterns like Doji, Hammer, Engulfing, and Shooting Star can signal potential reversals or trend continuations.
To read them effectively:
Look for pattern confirmation with volume.
Understand bullish vs. bearish signals.
Combine candlestick analysis with support and resistance levels or indicators like RSI.
Learning to read these patterns takes practice and guided learning. At Empirical Academy, we offer hands-on training in technical analysis, including live candlestick chart reading.
📚 Learn to trade with clarity and confidence. 👉 Enroll now: https://www.empiricalacademy.net
0 notes
Text
Mastering Indian Stock Market Trading & Investing: Technical Analysis for Smart Decisions

If you've ever found yourself staring at stock charts, wondering what those zigzag lines really mean or how seasoned traders predict market moves so accurately—it’s time to dive deep into the fascinating world of technical analysis.
Whether you're a beginner aiming to make your first trade or a budding investor who wants to understand market trends better, technical analysis is your gateway to reading the stock market like a pro. It’s not magic. It’s strategy—and with the right mindset, tools, and a bit of practice, anyone can learn it.
In this guide, we’ll explore what technical analysis is, how it's used in Indian stock market trading, and why mastering it can be a game-changer for your financial future.
What is Technical Analysis, Really?
At its core, technical analysis is about analyzing price movements and patterns. Instead of focusing on a company’s balance sheet or profits (which is fundamental analysis), technical analysis zooms in on stock charts, volume trends, support/resistance levels, and indicators like RSI, MACD, and moving averages.
Here’s the idea: history often repeats itself in the markets. Traders believe that past price movements can provide clues about future behavior.
But don’t worry—it’s not about memorizing hundreds of formulas. It’s about recognizing patterns, understanding market psychology, and using tools that are available to everyone.
Why is Technical Analysis Crucial in Indian Stock Market Trading?
India’s stock market, with major exchanges like NSE and BSE, is vibrant, fast-moving, and full of opportunities. With retail participation increasing and more young investors entering the scene, understanding technical analysis is not just a skill—it’s a competitive edge.
Here's why it matters:
📈 Volatility is Opportunity: Indian stocks often experience sharp movements. Technical analysis helps you time entries and exits better.
🔍 Helps Filter the Noise: News, opinions, and rumors? Technical charts let the price action speak for itself.
🕒 Perfect for Short-term & Swing Trading: Want to catch trends that last a few days or weeks? TA is your best friend.
💼 Complements Long-Term Investing: Even if you’re a long-term investor, knowing when to buy a fundamentally strong stock can greatly enhance returns.
Core Principles of Technical Analysis
To make smart decisions, you need a few essentials in your toolkit. Let’s break them down.
1. Price Discounts Everything
This is the first rule of technical analysis. Every known factor—earnings, news, expectations—is already reflected in the price.
2. Trends are Key
Markets move in trends: upward (bullish), downward (bearish), or sideways. Identifying the trend early can give you a head start.
3. History Tends to Repeat Itself
Humans drive the markets. Emotions like fear and greed lead to recurring price patterns.
Must-Know Tools and Indicators for Beginners
Learning technical analysis doesn’t mean staring blankly at complex graphs. Start with these basic tools:
🟢 Moving Averages (MA)
They smoothen price data to help you identify the trend. A simple 50-day and 200-day MA combo can reveal bullish or bearish signals.
🟣 Relative Strength Index (RSI)
A momentum indicator that tells you if a stock is overbought or oversold. It works on a scale of 0-100. Typically, above 70 means overbought; below 30 means oversold.
🔵 MACD (Moving Average Convergence Divergence)
Used to catch trend reversals. It gives crossover signals that many day traders live by.
🟡 Support and Resistance
Support is a level where buyers enter; resistance is where sellers dominate. Price tends to bounce between these zones.
🔴 Candlestick Patterns
Japanese candlesticks offer visual insights into market psychology. Patterns like Doji, Hammer, and Engulfing tell a story of potential reversals.
A Real-World Example: Let’s Analyze a Stock
Let’s say you’re looking at Infosys. You open the daily chart and notice:
The RSI is around 80 ➜ The stock might be overbought.
It’s near a resistance level it couldn’t cross twice before.
A bearish engulfing candle forms.
This is a potential short signal.
On the flip side, if the stock is near its 200-day MA, RSI is around 35, and a hammer pattern appears near support—you might consider buying.
The beauty of technical analysis? These setups repeat over time.
Day Trading vs Swing Trading vs Investing: How Does TA Fit?
✅ Day Trading
Entry and exit in the same day.
Requires strict discipline and quick decision-making.
TA is essential—especially 5-min, 15-min, hourly charts.
✅ Swing Trading
Positions held for days or weeks.
Based on short-to-medium-term trends.
Ideal for working professionals.
✅ Investing
Long-term horizon, but TA helps in timing your entry.
For example: Buying at a support level during a correction can improve returns significantly.
How to Start Learning Technical Analysis the Smart Way?
The internet is full of content, but not all of it is structured or beginner-friendly. If you’re serious about mastering it, choose a comprehensive, beginner-to-advanced course that focuses on the Indian stock market context.
We highly recommend starting with this Indian Stock Market Trading | Investing: Technical Analysis!! course. It’s perfect for beginners, filled with practical charting tips, live examples, and Indian stock-specific case studies.
Not only will it teach you chart reading, but you’ll also learn how to:
Use charting platforms effectively
Apply 20+ indicators in real-world scenarios
Build your trading strategy
Avoid beginner mistakes
Read volume like a pro
Whether you want to trade Bank Nifty, mid-cap stocks, or explore intraday and positional strategies, this course brings clarity and depth in a step-by-step format.
Common Mistakes New Traders Make (and How to Avoid Them)
Many new traders jump in with high hopes and little prep. Here’s how not to fall into the same traps:
❌ Trading Without a Plan: Always have entry, stop-loss, and target.
❌ Overusing Indicators: More isn’t better. Stick to 2–3 that suit your style.
❌ Ignoring Risk Management: Never risk more than 1–2% of your capital on a single trade.
❌ Letting Emotions Rule: Fear and greed are your biggest enemies.
Consistency comes from mindset, not just methods.
Building Your Trading System with Technical Analysis
Once you get the basics, build your own trading system—a repeatable strategy that aligns with your risk appetite.
Ask yourself:
What’s my trading style? (Scalping, Intraday, Positional)
What’s my entry signal? (Crossover, pattern, breakout)
What’s my stop-loss logic? (Fixed %, below support)
What are my exit rules? (Trailing stop, fixed reward ratio)
Test your system. Backtest it. Paper trade. And once it works—scale it.
Is Technical Analysis Foolproof?
No system is perfect. Technical analysis gives probabilities, not certainties. But when used correctly, it dramatically tilts the odds in your favor.
It's not about predicting the future. It's about reading the present clearly enough to make informed decisions.
That’s the edge that sets apart successful traders from the rest.
Final Thoughts: Why Now is the Best Time to Learn Technical Analysis
With rising retail participation in India’s stock market and easy access to free and paid charting tools, this is the perfect time to learn technical analysis.
Whether you're doing it to:
Create a side income,
Manage your investments better,
Or someday trade full-time,
Mastering technical analysis opens a whole new dimension in your financial journey.
And the best part? You don’t need a finance degree or fancy tools—just curiosity, a good course, and a willingness to learn.
Start your journey with confidence. Explore the Indian Stock Market Trading | Investing: Technical Analysis!! course today and take your first step toward smarter investing.
0 notes
Text
Candlestick Patterns: Mastering Market Moves with Accurate and Profitable Setups
In technical analysis, Candlestick Patterns are among the most powerful tools traders use to predict price movements. These patterns, originating from Japanese rice traders in the 18th century, provide visual cues about market sentiment, momentum, and potential reversals.
While there are dozens of candlestick formations, not all are equally reliable or easy to use. In this guide, we will focus on the most accurate and easy-to-understand candlestick patterns that offer strong profit potential, especially for swing traders and intraday traders.

What Are Candlestick Patterns?
A candlestick represents the price movement of an asset within a specific timeframe (e.g., 5-minute, daily, weekly). Each candlestick shows four key prices:
Open
High
Low
Close
The body (thick part) shows the range between the open and close. The wicks (or shadows) show the highs and lows. A green (or white) body shows a bullish candle, while a red (or black) one shows a bearish candle.
When grouped, Candlestick Patterns reveal momentum, reversals, or continuation of trends—making them highly valuable for timing trades.
1. Bullish Engulfing Pattern – Strong Buy Signal
Structure: A small red candle followed by a larger green candle that completely engulfs the previous day’s red candle.
Meaning: It indicates a strong reversal from bearish to bullish sentiment.
Best Used In: Downtrends or near support zones.
✅ Why It Works: It shows buyers stepping in with strong conviction, overpowering the previous day’s sellers.
2. Bearish Engulfing Pattern – Strong Sell Signal
Structure: A small green candle followed by a larger red candle that engulfs the previous green one.
Meaning: Suggests a reversal from bullish to bearish sentiment.
Best Used In: Uptrends, especially after a rally.
✅ Why It Works: It often signals that buyers are exhausted and sellers are gaining control.
3. Hammer – Bullish Reversal Pattern
Structure: Small body with a long lower wick, usually forming after a downtrend.
Meaning: Buyers rejected lower prices, showing potential for reversal.
Best Used In: Downtrends or oversold markets.
✅ Why It Works: Signals exhaustion of selling pressure and potential entry of buyers.
4. Shooting Star – Bearish Reversal Pattern
Structure: Small body with a long upper wick after an uptrend.
Meaning: Price attempted to rise but failed, indicating weakness.
Best Used In: Uptrends or near resistance.
✅ Why It Works: It highlights a failed rally, often followed by price correction.
5. Doji – Indecision, But Powerful with Confirmation
Structure: Very small body with long wicks, showing close is near the open.
Meaning: Market is undecided—watch for what happens next.
Best Used In: At the top or bottom of trends.
✅ Why It Works: Dojis often precede reversals, especially when followed by strong confirmation candles.
6. Morning Star – Bullish Reversal
Structure: A three-candle pattern: a long red candle, followed by a small body (Doji or Spinning Top), and a strong green candle.
Meaning: Shift from bearish to bullish momentum.
Best Used In: Downtrends or after corrections.
✅ Why It Works: Indicates transition from selling pressure to strong buying.
7. Evening Star – Bearish Reversal
Structure: Long green candle, followed by a small-bodied candle, then a long red candle.
Meaning: Sign of exhaustion in an uptrend, often preceding a downtrend.
Best Used In: Uptrends or after a bullish rally.
✅ Why It Works: Shows that buyers are losing steam and sellers are gaining control.
How to Maximize Profits with Candlestick Patterns
🔎 1. Combine with Support and Resistance
Candlestick patterns are more effective when they occur at key technical levels. For example, a Bullish Engulfing pattern at strong support offers a higher probability of success.
⚙️ 2. Use in Conjunction with Indicators
Pair candlestick patterns with tools like Relative Strength Index (RSI) or Moving Averages to confirm trend reversals or continuations.
⏱️ 3. Focus on Volume Confirmation
High volume on the reversal candle adds credibility to the signal. Volume confirms the participation of institutional players.
📈 4. Time Your Entry and Exit
Don’t trade on the pattern alone. Wait for confirmation candles or enter on the next candle’s break of the reversal level. Set clear stop-losses below/above the pattern for safety.
Final Thoughts
Candlestick Patterns are essential for anyone looking to understand price action and predict market behavior. When used correctly, patterns like the Bullish Engulfing, Hammer, and Morning Star can offer high-probability entry points for profitable trades.
What separates successful traders from the rest is not just identifying patterns but using them in the right context—with support, volume, and indicators backing them up. Simplicity, accuracy, and discipline are the keys to making candlestick patterns a reliable part of your trading strategy.
0 notes
Text
How to Trade Using Candlestick Patterns for Better Trade Decisions
Candlestick patterns are one of the most widely used tools in technical analysis. They provide valuable insights into market sentiment and potential price movements by analyzing the open, close, high, and low of each trading period. By understanding and using candlestick patterns, traders can make more informed decisions, anticipate market reversals, and optimize entry and exit points.
Here’s how you can use candlestick patterns effectively in your trading strategy.
1. What are Candlestick Patterns?
A candlestick pattern is formed by one or more candlesticks that represent price movements within a given timeframe. Each candlestick shows:
Open price: The price at which the asset opened during the time period.
Close price: The price at which the asset closed during the time period.
High price: The highest price reached during the period.
Low price: The lowest price reached during the period.
Candlestick patterns can be either bullish (indicating an upward price movement) or bearish (indicating a downward price movement), depending on the relationship between the open and close prices.
2. Popular Bullish Candlestick Patterns
Bullish candlestick patterns signal potential upward price movement. Here are a few common ones to look out for:
Bullish Engulfing Pattern: This pattern consists of a small bearish candlestick followed by a larger bullish candlestick that completely engulfs the previous one. It indicates strong buying pressure and often signals the beginning of an uptrend.
Hammer: A hammer candlestick has a small body and a long lower shadow, which indicates that sellers tried to push the price lower, but buyers stepped in and drove the price back up. It suggests a potential reversal from a downtrend to an uptrend.
Morning Star: This pattern consists of three candlesticks: a long bearish candlestick, followed by a small-bodied candlestick, and then a long bullish candlestick. The morning star indicates a potential trend reversal from bearish to bullish.
3. Popular Bearish Candlestick Patterns
Bearish candlestick patterns suggest potential downward price movement. Here are a few common bearish patterns to look for:
Bearish Engulfing Pattern: The opposite of the bullish engulfing pattern, the bearish engulfing consists of a small bullish candlestick followed by a larger bearish candlestick that completely engulfs it. This pattern indicates strong selling pressure and often signals the start of a downtrend.
Shooting Star: The shooting star has a small body and a long upper shadow, signaling that buyers tried to push the price higher but were unable to sustain it. This pattern suggests a potential reversal from an uptrend to a downtrend.
Evening Star: The evening star is the opposite of the morning star, consisting of a long bullish candlestick, followed by a small-bodied candlestick, and then a long bearish candlestick. This pattern indicates a potential reversal from bullish to bearish.
4. Using Candlestick Patterns for Entry and Exit
Candlestick patterns can be used to make more informed decisions about when to enter and exit trades:
Entry: When you identify a bullish reversal pattern (like a bullish engulfing or hammer) at support levels, it could be an indication to enter a long position. Similarly, a bearish reversal pattern (like a bearish engulfing or shooting star) at resistance levels could signal a short position.
Exit: Candlestick patterns can also help with determining exit points. For example, if you are in a long position and a bearish reversal pattern (like an evening star) forms near a resistance level, it might be a signal to close your position or set a stop-loss order to protect your profits.
5. Combining Candlestick Patterns with Other Indicators
While candlestick patterns can provide valuable insights, they work best when combined with other technical indicators to confirm the signals. Here are some tools you can use alongside candlestick patterns:
Support and Resistance: Look for candlestick patterns that form at key support or resistance levels. For example, a bullish engulfing pattern at a support level has a higher probability of success.
Moving Averages: Combine candlestick patterns with moving averages (e.g., 50-day or 200-day MA) to confirm the overall trend. A candlestick pattern that aligns with the trend can be more reliable.
RSI (Relative Strength Index): Use RSI to confirm whether an asset is overbought or oversold. A candlestick reversal pattern accompanied by an overbought or oversold condition can strengthen your trade decision.
6. Practice Patience and Wait for Confirmation
Candlestick patterns should never be used in isolation. They work best when you wait for confirmation before entering a trade. For example:
Volume: If a candlestick pattern forms with high volume, it’s a stronger signal. Volume confirmation helps validate the strength of the pattern.
Other Indicators: Look for confirmation from indicators like RSI or moving averages. For example, a bullish engulfing pattern near a moving average support level combined with an RSI showing oversold conditions may provide a more reliable signal.
Waiting for confirmation ensures you’re not jumping into a trade based on an isolated pattern, which could turn out to be a false signal.
Final Thought: Master Candlestick Patterns for Smarter Trading
Candlestick patterns are a powerful tool that can enhance your trading strategy. By understanding and recognizing common bullish and bearish patterns, you can make more informed decisions about entry and exit points, improve timing, and manage risk more effectively.
Ready to trade smarter with expert-backed strategies? Download Univest — the SEBI-registered trading app that helps you identify profitable candlestick patterns, follow expert strategies, and trade with confidence. Stay ahead of the market and improve your trading success.
0 notes
Text
Assessing the Right Time to Invest in Forex: A Comprehensive Guide
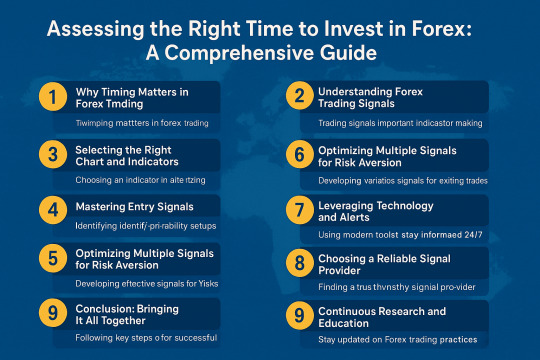
Investing in the foreign exchange (Forex) market can be highly rewarding—but only if you know when and how to enter and exit trades. This guide will walk you through the key steps to assess the optimal time to invest, including understanding trading signals, choosing the right charts, mastering entry and exit indicators, and leveraging technology to stay ahead. Whether you’re a beginner or a seasoned trader, these strategies will help you make informed, logical decisions and minimize risk.
1. Why Timing Matters in Forex Trading
The Forex market operates 24 hours a day, five days a week, with trillions of dollars changing hands daily. Given its continuous nature and high volatility, timing your trades can be the difference between healthy profits and significant losses. Entering at the wrong time may expose you to adverse currency swings, while exiting too early can prevent you from maximizing gains.
A well-timed trade allows you to:
Capitalize on momentum during strong trends
Avoid sharp reversals triggered by economic news
Reduce drawdowns and preserve capital
Improve risk-to-reward ratios on every position
By the end of this article, you’ll have a clear roadmap to pinpoint the best moments to invest and secure consistent returns.
2. Understanding Forex Trading Signals
Trading signals are alerts based on predefined criteria that suggest when to buy or sell a currency pair. They distill vast market data into actionable insights, helping traders spot opportunities without parsing every tick on the chart. Signals can be:
Technical: Generated from mathematical calculations on price and volume (e.g., Moving Averages, RSI, MACD).
Fundamental: Driven by economic events, like interest rate decisions or GDP reports.
Sentiment-based: Reflecting trader positioning and market psychology.
The key is to choose signals that align with your trading style—whether that’s scalping, day trading, swing trading, or longer-term position trading.
3. Selecting the Right Chart and Indicators
Before diving into signals, select a charting platform that offers:
Real-time data feeds for all major and minor currency pairs
Customizable timeframes (from 1-minute to monthly)
Built-in technical indicators and the ability to add custom scripts
Common Forex Charts
Line Chart: Simplest view showing closing prices.
Bar Chart: Displays open, high, low, and close (OHLC) for each period.
Candlestick Chart: Similar to bar charts, but with color-coded bodies—excellent for spotting reversal patterns.
Essential Technical Indicators
Moving Averages (MA): Identify trend direction and dynamic support/resistance.
Relative Strength Index (RSI): Measures overbought/oversold conditions.
Moving Average Convergence Divergence (MACD): Captures trend strength and momentum shifts.
Bollinger Bands: Highlight volatility and potential breakout points.
Stochastic Oscillator: Another momentum tool for spotting reversal zones.
Familiarize yourself with how each indicator behaves across different timeframes. Longer MAs smooth out noise but lag more, while shorter MAs react quickly but can generate false signals.
4. Mastering Entry Signals
An effective entry strategy combines multiple indicators to confirm a high-probability setup. Here’s a step-by-step process:
Trend Confirmation:
Use a 50-period and 200-period MA crossover to determine the primary trend (bullish when 50 above 200; bearish when below).
Momentum Filter:
Check RSI or MACD histogram for momentum alignment. For example, in an uptrend, RSI should be above 50.
Pattern Recognition:
Look for chart patterns (e.g., flags, pennants, head and shoulders) that signal continuation or reversal.
Entry Trigger:
A candlestick pattern (e.g., bullish engulfing) or a break above/below a recent swing high/low.
Volume/Volatility Check:
Confirm with volume spikes or Bollinger Band width expansion to ensure the move is supported by sufficient trading activity.
Example Entry Signal Workflow
Step 1: EUR/USD 4-hour chart shows 50 MA above 200 MA (uptrend).
Step 2: RSI sits at 55, indicating bullish momentum.
Step 3: Price consolidates in a bull flag for three candles.
Step 4: A breakout candle closes above the flag’s top—enter long.
Step 5: Volume increases by 20% above the 20-period average, confirming strength.
5. Optimizing Exit Strategies
Your exit plan is just as important as your entry. There are three common types of exits:
Fixed Stops and Profit Targets:
Predefine a stop-loss level (e.g., 30 pips) and a profit target (e.g., 60 pips) before entering. This guarantees a positive risk-to-reward ratio.
Trailing Stops:
Move your stop-loss in your favor as price advances. Many traders use a moving average or ATR-based trailing stop to capture extended moves.
Limit Exits at Key Levels:
Close positions at significant support/resistance zones or Fibonacci retracement lines.
Short-Term (Scalp/Swing) Exits
For quick trades, focus on “turning points”—repeated short-term patterns that can produce fast reversals. Monitor currency pair swings on 5- to 15-minute charts and set tight limit exits (e.g., 10–15 pips) with equally tight stops.
Real-Time Exit Signals
Many platforms offer real-time alerts—for example, if the MACD line crosses below the signal line or if price breaks below a key moving average. These can automate your exit decisions and reduce emotional bias.
6. Combining Multiple Signals for Risk Aversion
Relying on a single indicator is risky; it can generate false positives or lag behind. Instead, create a signal matrix by:
Overlaying trend, momentum, and volatility indicators
Filtering signals across multiple timeframes (e.g., align a 15-minute entry with a 1-hour trend)
Assigning weights to each signal based on reliability and recent performance
By evaluating multiple Forex signals together, you gain a holistic view of the market and can better anticipate fluctuations. This approach helps you stick to a logical mechanism rather than making random decisions under stress.
7. Leveraging Technology and Alerts
Modern Forex trading thrives on technology. With the right tools, you can analyze markets around the clock and never miss a crucial signal.
Mobile Trading Apps: Execute buy/sell orders and monitor charts on your smartphone—no physical presence required.
Automated Alert Systems: Configure alerts for when indicators meet your predefined parameters (e.g., RSI crosses below 30).
Expert Advisors (EAs): Deploy algorithmic trading systems that scan for signals and place trades automatically.
These innovations ensure that you’re always ready to act on new opportunities, whether you’re at your desk or on the go.
8. Choosing a Reliable Signal Provider
While self-generated signals are ideal, many traders supplement their strategies with professional signal services. To choose a trustworthy provider:
Check Track Record: Look for audited performance over at least six months with clear equity curves.
Read Reviews and Forums: Engage with communities on Forex forums and social media—peer feedback can be invaluable.
Compare Costs vs. Value: Free signals can be high-volume but low-quality, while paid services often offer curated, lower-frequency alerts.
Trial Periods: Opt for services that provide a trial or money-back guarantee so you can test signals risk-free.
Always cross-reference third-party signals with your own analysis to maintain control over your trades.
9. Continuous Research and Education
Forex markets evolve constantly. To stay ahead:
Read Business Newspapers and Magazines: Stay informed on macroeconomic trends that influence currency values.
Participate in Online Forums and Webinars: Exchange ideas with other traders and learn from expert lectures.
Backtest New Strategies: Use historical data and Forex software to simulate performance before risking real capital.
Maintain a Trading Journal: Record each trade’s setup, outcome, and your emotional state to refine your approach over time.
By committing to lifelong learning, you’ll adapt your system to changing market conditions and improve your win rate.
10. Conclusion: Bringing It All Together
Assessing the right time to invest in Forex isn’t about luck—it’s about systematic analysis, disciplined execution, and continuous improvement.
Understand and select the best trading signals for your style.
Choose the right charts and technical indicators.
Master robust entry and exit strategies.
Combine signals across multiple timeframes for enhanced risk aversion.
Leverage technology to automate alerts and execute trades.
Partner with a reputable signal provider, but always validate their calls.
Commit to ongoing research and education to refine your edge.
By following these steps, you’ll position yourself to make well-timed, high-probability trades that align with your goals and risk tolerance. Remember, consistency beats occasional brilliance—stick to your plan, and let your system guide you to long-term success in the Forex market. For more insights: Mastering Forex Trading Psychology: Traits, Emotions, and Mindset for Success Paperback – Large Print, May 20, 2025 by NABAL KISHORE PANDE (Author)
#Forex#TradingSignals#ForexStrategy#ForexIndicators#CurrencyTrading#InvestSmart#MarketTiming#ForexCharts#TradingPsychology#ExitStrategy
0 notes
Video
youtube
Golden Era Scanner in Action Step by Step Forex Scalping Win & Analysis
Join Bill Soriano for a live Forex trading session demonstrating the power and precision of the Golden Era Scanner! In this video, I walk you through identifying trade setups, understanding entry signals (the yellow checkmark!), waiting for candle confirmation, and managing trades using the scanner's invalidation zones and take profit targets.
(What viewers will learn/see) You'll see:
How the Golden Era Scanner identifies potential bullish and bearish engulfing patterns.
The importance of waiting for the 5-minute confirmation candle to close.
Real-time decision-making during Asian session trading.
How the scanner provides clear entry, invalidation, and exit points.
An example of a "no trade" signal (white flag) when price moves too quickly.
A detailed walkthrough of a winning scalping trade on Gold (XAUUSD) resulting in a (DEMO ACCOUNT) profit!
My thoughts on optimal trading sessions for this scanner.
>>> Get Your FREE Golden Era Scanner Overview PDF! <<< Learn more about how this powerful tool can enhance your trading: https://sorianoblueprint.com/GOLDEN-ERA-SCANNER-OVERVIEW.pdf
0 notes
Text
Simple Guide to Candlestick Charts: Read Price Like a Pro
Candlestick Patterns: Your Trading Companion
Let’s be honest — if you’re stepping into the trading world and you still haven’t wrapped your head around candlestick charts, you’re behind. This isn’t a “nice to know.” It’s a non-negotiable skill. Because no matter what market you’re in — forex, stocks, crypto, commodities — candlestick charts, which show the opening price, are the language of price. And if you can’t read that language, you’re trading blind.
Candlestick charts are not just about understanding opening and closing prices; they are about grasping the entire market sentiment. These charts, or candlestick chart patterns, including bearish candlestick patterns originating from Japanese candlestick charting techniques, have been used for centuries to interpret price movements and predict potential trends. Whether it's the bullish engulfing pattern or the bearish engulfing pattern, each candlestick pattern provides insights into the ongoing battle between buyers and sellers.
Now don’t worry — I’m not here to throw technical jargon at you. This is your simple guide to candlestick charts. Whether you're a total beginner or someone who’s been winging it for a while, this breakdown will make it click. Because once you understand how to read candlestick charts, everything on your screen starts making more sense. You’ll learn to spot bullish reversal patterns, including a bullish pattern, and bearish reversal patterns, understand the significance of a morning star pattern or an evening star pattern, and recognize the power of a hammer candlestick pattern or a shooting star pattern.
Understanding these patterns is crucial as they often signal trend reversals or continuation patterns. For instance, a strong bullish candle, represented by a bullish engulfing candlestick pattern after a downtrend, suggests a potential shift in control of the market from sellers to buyers. Similarly, a bearish harami pattern might indicate indecision in the market, often leading to a bearish reversal signal.
By mastering the art of candlestick charting, you equip yourself with the ability to read the market's heartbeat, especially in periods of strong buying pressure, allowing you to anticipate price movements and make informed trading decisions. So, dive in, explore the various candlestick patterns, including common bullish candlestick patterns, and start decoding the bullish candles and bearish candles that narrate the story of the market.
What Is a Candlestick Chart, Really?
Let’s strip it down. A candlestick chart is a visual representation of price action over a specific time period, essential in technical analysis. Each individual “candle” on the chart provides four crucial pieces of information: the open, high, low, and close (OHLC) of that time frame, and what each candlestick represents. These four data points are not just numbers; they tell a compelling story about the ongoing battle between buyers and sellers in the market.
When you see a candle that is green or white, it indicates that the price closed higher than it opened, signaling a bullish candlestick pattern. Conversely, a red or black candle means the price closed lower than it opened, indicating a bearish candlestick pattern. The body of the candle represents the distance between the open and close prices, while the wicks (or shadows) illustrate the highs and lows during that time frame.
Understanding these basics of candlestick formation transforms your perception of price from mere numbers to insights about momentum, hesitation, rejection, and confirmation. This transformation allows your chart to start communicating with you, revealing the underlying market sentiment, especially in relation to the previous candle.
Each candlestick pattern, whether it's a bullish engulfing pattern or a bearish engulfing pattern, provides valuable insights into potential trend reversals or continuation patterns. For example, a bullish engulfing candlestick pattern appearing after a downtrend might suggest a shift in market control from sellers to buyers. Similarly, a bearish harami pattern could indicate indecision in the market, potentially leading to a bearish reversal.
By mastering the art of candlestick charting, you gain the ability to read the market's heartbeat, anticipate price movements, and make informed trading decisions. Dive into the world of various candlestick patterns and start decoding the bullish candles and bearish candles that narrate the story of the market.
For instance, a morning star pattern often signals a bullish reversal, indicating that the selling pressure is waning, and buyers might be taking control. On the other hand, an inverted hammer candlestick pattern can be a bearish reversal pattern, suggesting that the buying momentum is losing steam, and sellers might push the price down.
Moreover, understanding continuation candlestick patterns, including a bearish abandoned baby pattern and bullish continuation patterns like the rising three methods, can help you identify when a current trend is likely to continue, providing opportunities for traders to capitalize on ongoing price movements.
Incorporating these insights into your trading strategy can significantly enhance your ability to predict price movements and understand the market sentiment behind each candlestick pattern. Whether you're analyzing a shooting star candlestick pattern, a hammer candlestick pattern, or a doji candlestick pattern, and understanding how they relate to the closing price can profoundly impact your trading approach.
So, immerse yourself in the fascinating world of candlestick charting and elevate your trading prowess to new heights. By recognizing and understanding the most common candlestick patterns, such as the bullish harami pattern, piercing line pattern, or dark cloud cover pattern, you can better navigate the complexities of the market and make more informed trading decisions.
Why Candlestick Charts Matter?
Here’s the truth: no indicator, no matter how fancy, will ever beat pure price action. And candlestick charts are the foundation of that. They’re the most direct, visual way to see what price is doing, what buyers are trying to do, and how sellers are responding — or vice versa, especially in the context of a strong bearish candle. This makes them an indispensable tool in any trader's arsenal, especially when combined with the analysis of a larger bearish candle.
You’re not just seeing movement. You’re seeing intent. The candlestick technical analysis allows traders to interpret price in real time, offering a window into the market's psyche. Did buyers step in and push the price up, only to get rejected at the top? That long upper wick tells you. Did price consolidate, then burst out with a wide green body? That’s momentum. Are we getting small candles with long wicks in both directions? That’s indecision.
In short, trading with candlestick charts gives you an edge that indicators can’t — because you’re reading the raw data of the market. Not a lagging average. Not a smoothed curve. Just the real heartbeat of price. By understanding the dynamics of various candlestick patterns, such as the long bullish candle represented by bullish engulfing pattern or the bearish engulfing pattern, traders can better anticipate potential trend reversals or continuation patterns.
For instance, a bullish engulfing candlestick pattern after a downtrend suggests a potential shift in control of the market from sellers to buyers. Similarly, a bearish harami pattern might indicate indecision in the market, often leading to a bearish reversal. Recognizing these patterns equips traders with the knowledge to make informed decisions, enhancing their ability to predict price movements and understand market sentiment.
By mastering the art of candlestick charting, you gain the ability to read the market's heartbeat, anticipate price movements, and make informed trading decisions. Dive into the world of various candlestick patterns and start decoding the bullish candles and bearish candles that narrate the story of the market. Whether you are analyzing a morning star pattern, a shooting star pattern, or a hammer candlestick pattern, understanding the implications of each, particularly in the context of bullish sentiment, can significantly impact your trading strategy. So, embrace the power of candlestick charts and elevate your trading game to new heights.
How to Read Candlestick Charts Like a Trader?
Let’s keep it practical. If you want to know how to read candlestick charts, don’t just memorize patterns — learn how to read the story behind the pattern.
A bullish engulfing candle after a downtrend? That tells you buyers just overpowered the sellers. A doji at a resistance zone? That’s hesitation. A long hammer wick after a sharp move down? That’s potential reversal — if followed by confirmation.
There are dozens of types of candlestick patterns out there — pin bars, inside bars, morning stars, evening stars — but the key is understanding why they form. Are they showing strength? Exhaustion? Trap? Rejection? Don’t just name it. Understand it.
Once you get fluent in interpreting candlestick charts, your strategy becomes sharper. You’ll stop taking random trades and start recognizing candlestick chart signals that align with structure, support, resistance, trend, and timing.
Using Candlesticks with Simple Strategies
Here’s where it gets powerful — you don’t need complicated systems to trade. Some of the most effective strategies are simple trading strategies using candlesticks. Let me give you a few I personally use:
Rejection at Key Levels: Wait for price to tap into a support/resistance zone and look for a rejection candle, like a pin bar or engulfing.
Breakout Confirmation: Don’t chase the breakout. Wait for a strong candle to close above the zone, showing conviction.
Trend Continuation: When price pulls back into the trendline or moving average and prints a clean bullish or bearish candle — that’s your signal to re-enter.
You don’t need five indicators or a PhD in technicals. You just need a candlestick chart for beginners, along with an understanding of green candles strong level, and a bit of patience.
Candlestick Charts in Different Markets
1. Universal Application of Candlestick Charts
One of the most remarkable aspects of candlestick charts is their universal applicability. Whether you're analyzing Japanese candlestick charts for currency pairs like USD/JPY, examining price action on the S&P 500, or deciphering Bitcoin’s unpredictable movements, the foundational logic of candlestick charting remains unchanged. This universal nature makes candlestick charts one of the most used tools in technical analysis worldwide.
2. Candlestick Analysis in Forex
In the Forex market, where speed and volatility are the norms, candlestick analysis is invaluable. Traders use candlestick patterns to quickly assess market sentiment and make rapid decisions. Patterns like the bullish engulfing pattern or a bearish pattern such as the bearish engulfing pattern, are particularly useful in identifying potential reversals or continuations amidst fast-moving currency prices.
3. Candlestick Patterns in Stock Trading
When it comes to stocks, candlestick charts help traders spot volume-based breakouts or reactions to earnings reports. For instance, a bullish engulfing candlestick pattern following a period of consolidation might signal a strong buying opportunity. Similarly, a bearish harami pattern could indicate a potential downturn, allowing traders to adjust their positions accordingly.
4. Candlestick Charting in Cryptocurrency
In the volatile world of cryptocurrency, candlestick charts are a trader’s best ally. Given the market's tendency to print fakeouts frequently, understanding patterns like the morning star pattern, the evening star pattern, or the long-legged doji pattern can help traders navigate these false signals. The shooting star candlestick pattern and the hammer candlestick pattern are also crucial for identifying potential reversals in crypto trading.
5. The Role of Market Sentiment
Across all markets, candlestick charts provide insights into the underlying market sentiment. By interpreting patterns, traders can gauge whether the market is experiencing strong buying or selling pressure, indecision, or a potential shift in momentum. This understanding allows for more informed and strategic trading decisions.
6. The Versatility of Candlestick Charts
The versatility of candlestick charts lies in their ability to communicate the market's story, regardless of the asset class. By mastering these patterns, traders can better anticipate price movements, understand the dynamics of bullish and bearish candles, and enhance their overall trading strategy. Whether you're trading Forex, stocks, or cryptocurrencies, candlestick charts are an indispensable tool in your technical analysis toolkit.
Start With the Candle, Build the Picture
If you want to become a confident, independent trader, start with this: learn candlestick charts inside out. Don’t just watch YouTube patterns. Pull up your chart. Study real-time reactions. Screenshot your trades. Ask: What were buyers doing here? Where did they fail? Where did they win?
This isn’t about finding a magic pattern. This is about building a conversation with price. When you understand that, every candle becomes a sentence. Every setup becomes a story. And every trade you take starts to make sense.
So, yeah — indicators are great. But candlesticks? They’re the roots.
By delving deeper into candlestick charting, you unlock the ability to interpret the subtle nuances of market movements. Each candlestick pattern, including the third candle in a sequence such as the bullish engulfing pattern or the bearish engulfing pattern, serves as a chapter in the ongoing narrative of market sentiment. As you become more adept at reading these patterns, you'll start to recognize when a bullish reversal pattern is forming or when a bearish continuation pattern might signal further declines.
Moreover, understanding the implications of a morning star pattern or the significance of a shooting star candlestick pattern can provide you with a strategic edge. These patterns are not just abstract concepts; they are reflections of the market's psychology, revealing moments of indecision or shifts in momentum.
Engage actively with your charts, and you'll soon be able to anticipate potential trend reversals or identify continuation patterns with greater accuracy. This deeper comprehension allows you to make informed trading decisions, enhancing your ability to predict price movements and respond effectively to market dynamics. Embrace the power of candlestick charts, and let them guide you to becoming a more proficient and confident trader.
1 note
·
View note
Text
How Many Candlestick Patterns Are There

How Many Candlestick Patterns Are There? A Friendly Guide to Understanding the Basics
Understanding the world of trading can feel like learning a new language. And if you’ve ever seen a candlestick chart, you might’ve wondered, “What am I even looking at?” Don’t worry—you're not alone! Whether you're someone just getting into trading or simply curious about how it all works, this article will walk you through the mysterious world of candlestick patterns. We’ll break it down in a way that makes sense, no financial dictionary required.
Imagine candlestick patterns like traffic signals on the road of trading—they give hints about what might happen next. Some say, “Hey, the market might go up!” Others hint, “Watch out, things could go south.” So, how many candlestick patterns are there? Great question—let’s find out.
Learn how many candlestick patterns are there, different types of candlestick patterns, and what is candlestick patterns in simple language for beginners.
Introduction to Candlestick Patterns
Let’s start at the beginning. If you’ve ever seen a stock or cryptocurrency chart, you’ve probably noticed those little red and green rectangles—they're called candlesticks. They're not just colorful bars; they tell a story about price movement.
What is Candlestick Patterns?
Candlestick patterns are specific formations of these candles on a chart. Think of them as facial expressions of the market. Just like a smile can tell you someone’s happy, a certain pattern in candles can suggest whether the market is feeling bullish (going up) or bearish (going down).
Each candlestick gives four main pieces of information:
Open Price
Close Price
High Price
Low Price
Why Are Candlestick Patterns Important?
Imagine driving with your eyes closed. Sounds scary, right? That’s what trading without understanding patterns is like. Candlestick patterns act like headlights—they help traders see where the road might lead. While they don't guarantee success, they give valuable clues that many traders use to make decisions.
How Many Candlestick Patterns Are There?
Here’s the big question: how many candlestick patterns are there? Well, in total, there are more than 50 recognized patterns, but most traders focus on about 30 key ones. These patterns are grouped into:
Single Candlestick Patterns
Double Candlestick Patterns
Triple Candlestick Patterns
Each category offers insight into different possible future movements of the market.
Types of Candlestick Patterns
To make things easier, let’s break them down:
Single Candlestick Patterns
These involve just one candlestick. They're quick and simple.
Double Candlestick Patterns
These involve two candles and often signal a trend reversal.
Triple Candlestick Patterns
These use three candles to tell a more complete story about what the market might do next.
Let’s dig deeper into each one.
Single Candlestick Patterns
These are the building blocks of chart reading. They’re easy to spot and understand.
Doji
A Doji looks like a cross. It happens when the open and close prices are almost the same. It shows market indecision—like the market saying, “I’m not sure which way to go.”
Hammer
A Hammer looks like—you guessed it—a hammer! It has a small body with a long lower wick. It usually shows up at the bottom of a downtrend, signaling a potential reversal upward.
Inverted Hammer
Similar to the Hammer, but flipped upside down. It also signals a possible trend reversal, but needs confirmation from the next candles.
Double Candlestick Patterns
These patterns give a stronger message since they involve two candles working together.
Bullish Engulfing
This happens when a small red candle is followed by a big green candle that completely “engulfs” it. It signals a potential move upward.
Bearish Engulfing
The opposite of bullish. A small green candle is followed by a larger red one. This can signal a downward move ahead.
Tweezer Tops and Bottoms
These are two candles with matching highs (tops) or lows (bottoms). They can suggest that a trend is losing strength.
Triple Candlestick Patterns
When three candles join forces, the pattern becomes even stronger and more reliable.
Morning Star
This is a bullish reversal pattern made of three candles: a bearish candle, a small-bodied candle (which can be a Doji), and a bullish candle. It's like a sunrise—things are looking up!
Evening Star
The opposite of Morning Star. It begins with a bullish candle, followed by a small one, and ends with a bearish candle. It's a sign the sun is setting on an uptrend.
Three White Soldiers
This pattern consists of three strong green candles in a row. It’s a very bullish sign, showing continued buying pressure.
Three Black Crows
You guessed it—this one's bearish. It’s made of three long red candles in a row, suggesting strong selling pressure.
Common Mistakes When Reading Patterns
Let’s face it, we all mess up sometimes. Here are some pitfalls to avoid:
Relying on patterns alone: Always use other tools too.
Ignoring the bigger trend: A bullish pattern in a strong downtrend may not hold up.
Overtrading: Just because you see a pattern doesn’t mean you must act on it.
Tips for Learning Candlestick Patterns
Learning candlestick patterns is like learning to read emotions. Start small:
Practice with paper trading.
Use flashcards to memorize patterns.
Review historical charts to see how patterns played out.
Keep a trading journal to track your learning.
Conclusion
So, how many candlestick patterns are there? There are over 50—but don’t panic! You really only need to master about 30 core patterns to start making smarter decisions. Whether you’re an aspiring trader or just a curious learner, understanding these patterns is like having a window into the market’s soul.
Remember, candlestick patterns are tools—not magic tricks. Use them wisely, and always double-check with other indicators and research.
FAQs
How many candlestick patterns are there?
There are over 50 recognized candlestick patterns, but traders mostly use 30 key ones regularly.
What is candlestick patterns in simple terms?
They are visual representations of price movements in a chart. Each pattern gives clues about where the market might go next.
Are candlestick patterns accurate?
They can be helpful, but no pattern is 100% accurate. They're best used with other tools and indicators.
Can beginners learn candlestick patterns easily?
Absolutely! With practice, even beginners can understand and use them to make better trading choices.
What's the difference between bullish and bearish patterns?
Bullish patterns suggest prices may rise, while bearish patterns indicate a possible decline in prices.
#how many candlestick patterns are there#what is candlestick patterns#how to read candlestick pattern#types of candlestick patterns
1 note
·
View note
Text
How to Trade the Bullish Engulfing Pattern: Complete Guide with Strategies
In the world of candlestick trading, price action patterns offer invaluable insights into market sentiment and potential reversals. One of the most powerful and frequently observed reversal patterns is the Bullish Engulfing Pattern. This pattern signals a shift from bearish to bullish sentiment, often preceding a strong upward move. In this blog post, we’ll explore: What the Bullish Engulfing…
#Best candlestick patterns for trading#Bullish Candlestick Patterns#Bullish Engulfing confirmation#Bullish Engulfing in downtrend#Bullish Engulfing in intraday trading#Bullish Engulfing Pattern#Bullish Engulfing pattern explained with examples#Bullish Engulfing setup#Bullish Engulfing trading strategy#Bullish Engulfing vs Bearish Engulfing#candlestick chart patterns#Candlestick reversal patterns#EMA bounce with candlestick patterns#engulfing candle setup#Engulfing candle trading strategy#Entry and exit strategy for Bullish Engulfing#High volume Bullish Engulfing#How to identify a Bullish Engulfing pattern#How to Trade Bullish Engulfing#intraday trading strategy#learn technical analysis#Price Action Strategy#Profitable Bullish Engulfing strategy for beginners#reversal trading signals#RSI and Bullish Engulfing#Stock trading patterns#Support and resistance trading#Swing trading with Bullish Engulfing#technical analysis#Technical Analysis Patterns
0 notes
Text
Certificate in Technical Analysis - Master Market Trends with Empirical Academy
Whether you are a beginner or an experienced trader, mastering technical analysis can significantly improve your ability to navigate the financial markets. In this blog, we will explore the fundamentals of technical analysis and the advantages of taking an advanced certification course.
Key Concepts of Technical Analysis
Price Trends: The market moves in trends — upward (bullish), downward (bearish), or sideways (consolidation). Identifying these trends helps traders make informed decisions.
Support and Resistance Levels: These are key price levels where buying or selling pressure increases, influencing market direction.
Chart Patterns: Traders analyze patterns such as head and shoulders, double tops, and triangles to anticipate price movements.
Technical Indicators: Tools like moving averages, RSI (Relative Strength Index), MACD (Moving Average Convergence Divergence), and Bollinger Bands help traders identify potential entry and exit points.
Candlestick Patterns: Patterns like doji, hammer, and engulfing provide insights into market sentiment and possible reversals.
Why Enroll in a Technical Analysis Certification Course?
A structured certification course provides in-depth knowledge and hands-on experience with technical analysis tools. Here are a few reasons why enrolling in a Technical Analysis Certification Course can benefit you:
Comprehensive Learning: Covers everything from the basics to advanced concepts.
Practical Application: Real-world case studies and live market analysis.
Trading Strategies: Learn tested and effective trading strategies.
Risk Management: Understand how to manage risks and minimize losses.
Industry Recognition: A certification enhances your credibility as a trader or investor.
Advanced Technical Analysis: Taking Your Trading to the Next Level
For seasoned traders looking to refine their skills, an Advanced Technical Analysis Course offers deeper insights. Here’s what you can expect:
Advanced Charting Techniques: Mastering Fibonacci retracement, Elliott Wave theory, and Gann analysis.
Algorithmic Trading: Learning how to automate trading strategies using algorithms.
Market Psychology: Understanding the psychology behind price movements.
Intermarket Analysis: Studying the relationship between stocks, commodities, and forex markets.
Volume Analysis: Learning how to use volume data for better decision-making.
Conclusion
Technical analysis is a valuable skill that can help traders make more informed and strategic decisions in the stock market. Whether a beginner or an advanced trader, taking a Technical Analysis Certification Course can give you the tools and knowledge needed to succeed. If you’re serious about improving your trading skills, explore Empirical Academy’s courses and take the first step towards becoming a professional trader.
Start your journey today and unlock the power of technical analysis!
0 notes
Text
Best Crypto Charts for Traders in 2025 📊📈
Crypto traders know that reading price movements is key to making informed decisions. Whether you're a beginner or a seasoned trader, using the best crypto charts in 2025 can help you analyze trends, predict market shifts, and optimize your strategy.
🔍 What Are Crypto Charts?
Crypto charts are visual tools that display cryptocurrency price movements over time. They help traders identify trends, spot potential entry/exit points, and refine their trading strategies.
Among the different chart types, candlestick charts are the most popular due to their detailed price representation. Let’s explore some of the best charting platforms available for 2025.
📊 Best Crypto Charting Tools for 2025
🔥 TradingView – The Market Leader
One of the most popular platforms, TradingView offers both free and premium plans, supporting crypto, stocks, forex, and more. It provides customizable charts with 12+ formats and an active trading community to share strategies.
⚡ Bitbo – Bitcoin Specialists
For those focused on Bitcoin trading, Bitbo delivers 90+ Bitcoin price projection & on-chain charts, along with custom alerts and premium analysis tools.
📉 Coinigy – Advanced Crypto Trading
Coinigy is a powerful option that connects to 45+ exchanges, including DeFi platforms. It features AES 256-bit encryption for security and is ideal for portfolio tracking & trade execution.
📈 GoCharting – Multi-Asset Support
GoCharting offers 15+ chart formats, including candlestick, OHLC, and Renko. It’s great for traders involved in US & Indian markets, with extra features like paper trading & an educational academy.
🔄 CryptoView – Integrated Trading & Analytics
CryptoView is designed for serious traders, powered by TradingView charts. It supports multi-screen setups, portfolio sharing, and enterprise-grade security with API encryption.
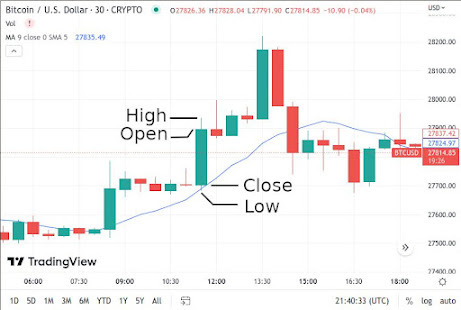
📖 How to Read Crypto Candlestick Charts
Candlestick charts are the most widely used crypto chart format because they show detailed price changes over a specific timeframe.
Each candlestick consists of:
Open price – the starting value of a crypto asset
High price – the peak value within the timeframe
Low price – the lowest value in that period
Close price – the final value before a new candlestick begins
📊 Understanding Candlestick Colors
🟢 Green Candle = Price closed higher than it opened (Bullish)
🔴 Red Candle = Price closed lower than it opened (Bearish)
📏 Analyzing Wick & Body Lengths
Long bodies → Strong trend (bullish or bearish)
Short bodies → Possible market indecision
Long wicks → Price volatility
Short wicks → Price stability
📌 Recognizing Crypto Chart Patterns
Bullish Patterns (Uptrend Signals)
Bullish Engulfing → Large green candle overtakes a smaller red candle
Rising Three → Three small red candles followed by a large green candle
Bullish Harami → Small green candle inside a larger red candle
Bearish Patterns (Downtrend Signals)
Bearish Engulfing → Large red candle overtakes a smaller green candle
Shooting Star → Long upper wick, small lower body (indicating reversal)
Bearish Harami → Small red candle inside a larger green candle
🛠 Alternative Crypto Analysis Methods
Besides candlestick charts, traders also use: ✅ Fundamental Analysis – Evaluates a crypto project’s whitepaper, team, partnerships, and market adoption ✅ On-Chain Analysis – Uses blockchain data to assess market sentiment and investor behavior ✅ Sentiment Analysis – Tracks social media trends & market psychology
🚀 Final Thoughts
Mastering crypto charts and analysis is crucial for making smarter trading decisions. Whether you use TradingView, Bitbo, Coinigy, GoCharting, or CryptoView, selecting the right charting tool can help you track trends and develop winning strategies.
What’s your go-to crypto charting tool? Let’s discuss! ⬇️💬
0 notes
Text
Master Technical Analysis: Your Guide to the Indian Stock Market

Navigating the Indian stock market can feel overwhelming. With thousands of stocks and constant fluctuations, how do you make informed decisions? Technical analysis offers a way to understand market movements through charts and indicators. This guide will help you get a grip on the essentials of technical analysis, making it easier to trade wisely.
The Allure and Challenges of the Indian Stock Market
The Indian stock market has its own excitement. Investors are drawn to the potential for great returns. However, with opportunity comes risk. The market is volatile, and prices can change quickly. Understanding the tools available can help traders to manage that risk effectively.
Why Technical Analysis is Crucial for Indian Traders
Technical analysis simplifies the process of Stock Marketing Trading. It focuses on price movements and volume rather than company fundamentals. By studying price charts and patterns, traders can make predictions about future market behavior. This method helps reduce emotional decision-making and allows for a more disciplined approach.
Setting the Stage: What This Guide Covers
This guide covers key aspects of technical analysis, including:
Chart Patterns
Technical Indicators
Candlestick Patterns
Risk Management
Advanced Techniques
Each section aims to provide clear insights and actionable strategies for traders in the Indian market.
Chart Patterns: Deciphering Market Signals
Identifying Trend Reversals: Head and Shoulders, Double Tops/Bottoms
Chart patterns are graphical representations of price movements. Recognizing these patterns can signal potential trend reversals:
Head and Shoulders: Indicates a reversal from bullish to bearish.
Double Tops: Signals a peak before a downward trend.
Double Bottoms: Suggests a potential upward movement.
Spotting Continuation Patterns: Flags, Pennants, Wedges
Continuation patterns suggest that a trend will continue. Key patterns to watch include:
Flags: Short-term consolidation before a continuation.
Pennants: Small symmetrical triangles after a sharp price movement.
Wedges: Indicates a potential reversal in a strong trend.
Practical Application: Real-world examples of pattern recognition in Indian stocks
For example, if an Indian stock like Reliance Industries shows a head and shoulders pattern, it might indicate a shift from a bullish trend to a bearish one, guiding traders to adjust their positions accordingly.
Technical Indicators: Unveiling Market Momentum
Moving Averages: Simple, Exponential, Weighted – Explained
Moving averages smooth out price data to identify trends over a specific period. Key types:
Simple Moving Average (SMA): Averages prices over a set time.
Exponential Moving Average (EMA): Gives more weight to recent prices.
Weighted Moving Average (WMA): Assigns different weights to prices based on their age.
Relative Strength Index (RSI): Gauging Market Strength and Weakness
The RSI is a momentum oscillator that ranges from 0 to 100. It helps traders spot overbought or oversold conditions:
Above 70: Indicates overbought conditions.
Below 30: Suggests oversold conditions.
MACD: Identifying Momentum Shifts and Potential Trading Signals
The Moving Average Convergence Divergence (MACD) can identify shifts in momentum. When the MACD line crosses above the signal line, it may indicate a buy signal, and vice versa.
Candlestick Patterns: Unlocking Price Action Insights
Understanding Candlestick Formation and Interpretation
Candlestick charts provide visual insights into price movements. Each candle shows the open, close, high, and low prices for a specific time period.
Powerful Candlestick Patterns: Doji, Hammer, Engulfing Patterns
Some key candlestick patterns include:
Doji: Indicates indecision in the market.
Hammer: Suggests potential bullish reversal.
Engulfing Patterns: Signals strong shifts in market sentiment.
Combining Candlestick Patterns with Indicators for Enhanced Accuracy
By pairing candlestick patterns with indicators like RSI or MACD, traders can enhance their analysis and improve trade accuracy.
Risk Management and Position Sizing in the Indian Context
Defining Your Risk Tolerance and Setting Stop-Loss Orders
Understanding personal risk tolerance is crucial. Setting stop-loss orders helps limit potential losses. For example, if a trader is willing to risk 2% of their portfolio on a trade, they should set a stop-loss accordingly.
Position Sizing Strategies for Indian Stock Market Trading
Calculating position sizes based on risk tolerance aids better capital management. A common method is the fixed percentage approach, allowing traders to determine how much to invest in each trade.
Adapting Risk Management to the Unique Characteristics of Indian Markets
Consider the high volatility in Indian stocks. Adjust risk management practices to protect capital during price swings.
Advanced Technical Analysis Techniques
Fibonacci Retracements and Extensions: Identifying Support and Resistance Levels
Fibonacci levels are used to identify potential retracement levels. Traders often look for support or resistance at these levels during price corrections.
Elliott Wave Theory: Understanding Market Cycles and Trends
Elliott Wave Theory suggests markets move in predictable cycles. Identifying these waves helps traders anticipate future price movements.
Combining Multiple Techniques for Comprehensive Market Analysis
Using multiple technical analysis tools together provides a fuller picture. For instance, analyzing chart patterns alongside indicators can enhance trading decisions.
Conclusion: Mastering Technical Analysis for Sustainable Success
Key Takeaways: Actionable Steps for Indian Stock Market Traders
Focus on mastering chart patterns and technical indicators.
Incorporate risk management strategies tailored to the Indian market.
Continuously learn and adapt to market changes.
Continuous Learning and Adaptation in the Dynamic Indian Market
The Indian stock market is ever-changing. Stay updated with market trends and refine your strategies regularly.
Resources for Further Learning and Development
Books, online courses, and webinars can enhance your understanding. Explore resources like financial news platforms, stock market blogs, and trading forums to continue your education in technical analysis.
By mastering technical analysis, you position yourself for success in the dynamic Indian stock market. Embrace the tools and strategies outlined in this guide to make informed trading decisions. Start analyzing today!
0 notes
Text
Candlestick Patterns and Their Role in Trading
In the world of trading, understanding and predicting market movements is crucial for success. Among the various tools available to traders, candlestick patterns stand out as one of the most powerful and widely used methods for technical analysis. Candlestick patterns not only help traders anticipate market trends but also offer valuable insights into the psychology of market participants. This article delves into what candlestick patterns are, their significance in trading, and how traders can use them to make more informed decisions.

What Are Candlestick Patterns?
Candlestick patterns are a type of chart pattern that originated in Japan in the 18th century. They were first used by Japanese rice traders to track and predict price movements. Over time, these patterns gained popularity in the Western world and have become an essential tool for modern traders.
Each candlestick on a chart represents the price movement for a specific time frame, such as one minute, one hour, or one day. A single candlestick is composed of four key pieces of information:
Open Price – The price at which the trading period started.
Close Price – The price at which the trading period ended.
High Price – The highest price reached during the trading period.
Low Price – The lowest price reached during the trading period.
The body of the candlestick (the rectangular part) shows the range between the open and close prices, while the thin lines above and below (called wicks or shadows) represent the high and low prices.
Bullish vs. Bearish Candlesticks
Bullish Candlestick: Indicates that the closing price is higher than the opening price. It’s often colored green or white and signifies upward price movement.
Bearish Candlestick: Indicates that the closing price is lower than the opening price. It’s often colored red or black and signifies downward price movement.
Understanding how to read individual candlesticks is the foundation for recognizing more complex candlestick patterns.
Why Are Candlestick Patterns Important?
Candlestick patterns provide valuable insights into market sentiment and potential future price movements. Unlike other technical indicators that rely on calculations and formulas, candlestick patterns offer a visual representation of the battle between buyers and sellers.
These patterns can:
Identify market reversals: Some patterns signal that a trend may be about to reverse direction.
Confirm existing trends: Others confirm the continuation of an ongoing trend.
Provide entry and exit points: Candlestick patterns help traders time their trades effectively.
Enhance decision-making: By understanding market psychology, traders can make more informed decisions.
Popular Candlestick Patterns Every Trader Should Know
There are numerous candlestick patterns, but some are more reliable and commonly used than others. These patterns can be broadly classified into two categories: reversal patterns and continuation patterns.
Reversal Patterns
Reversal patterns indicate a potential change in the current trend direction.
Hammer
Description: A single candlestick with a small body and a long lower wick.
Significance: Appears at the bottom of a downtrend, signaling a potential reversal to the upside.
Example: A hammer indicates that sellers pushed the price lower during the session, but buyers regained control before the close.
Shooting Star
Description: A single candlestick with a small body and a long upper wick.
Significance: Appears at the top of an uptrend, indicating a potential reversal to the downside.
Engulfing Pattern
Bullish Engulfing: A larger green candlestick completely engulfs the previous red candlestick, signaling a potential upward reversal.
Bearish Engulfing: A larger red candlestick engulfs the previous green candlestick, signaling a potential downward reversal.
Morning Star and Evening Star
Morning Star: A three-candlestick pattern that signals a bullish reversal. It consists of a bearish candle, a small indecisive candle, and a bullish candle.
Evening Star: The bearish counterpart of the Morning Star, signaling a potential downward reversal.
Continuation Patterns
Continuation patterns indicate that the current trend is likely to continue.
Doji
Description: A candlestick with an almost equal open and close price, resulting in a very small body.
Significance: Reflects market indecision. Depending on its position in the trend, it can either signal a continuation or a potential reversal.
Three White Soldiers
Description: Three consecutive bullish candlesticks with higher closes each time.
Significance: A strong bullish continuation pattern.
Three Black Crows
Description: Three consecutive bearish candlesticks with lower closes each time.
Significance: A strong bearish continuation pattern.
Rising and Falling Three Methods
Rising Three Methods: A bullish continuation pattern consisting of several small bearish candles followed by a large bullish candle.
Falling Three Methods: The bearish counterpart of the Rising Three Methods.
How to Use Candlestick Patterns in Trading
Recognizing candlestick patterns is only the first step. To use them effectively, traders must combine them with other technical indicators and strategies. Here are some practical tips for incorporating candlestick patterns into your trading plan:
Combine with Support and Resistance Levels Candlestick patterns are more reliable when they appear near significant support or resistance levels. For instance, a bullish engulfing pattern at a strong support level is a more reliable buy signal.
Use Multiple Time Frames Analyzing candlestick patterns across multiple time frames can provide a clearer picture of market trends. A pattern that appears on a daily chart is generally more significant than one on a five-minute chart.
Confirm with Technical Indicators Indicators such as the Relative Strength Index (RSI), Moving Averages, and Bollinger Bands can help confirm the signals provided by candlestick patterns.
Practice Risk Management No pattern guarantees success. Always use stop-loss orders and maintain a disciplined approach to risk management.
Monitor Market Context Always consider the broader market context. A candlestick pattern that appears during a news event or high-volatility period may behave differently than one in a stable market.
Common Mistakes to Avoid
While candlestick patterns can be powerful, they are not foolproof. Here are some common mistakes traders should avoid:
Over-reliance on a single pattern: Always seek confirmation from other indicators or patterns.
Ignoring the trend: Patterns are more reliable when traded in the direction of the prevailing trend.
Forgetting risk management: Even the most reliable patterns can fail, so proper risk management is essential.
Failing to practice: New traders should practice identifying and interpreting candlestick patterns using demo accounts before trading with real money.
Conclusion
Candlestick patterns are a valuable tool for traders seeking to anticipate market movements and improve their decision-making. At Shenzhou Capital, we believe that understanding the various patterns and how to use them effectively can give traders a significant edge in the markets. However, it’s essential to remember that no pattern is foolproof, and combining candlestick analysis with other technical tools and strategies is key to long-term success.
Whether you’re a beginner or an experienced trader, mastering candlestick patterns can enhance your trading journey and help you navigate the complexities of financial markets with greater confidence.
#CandlestickPatterns#TradingStrategies#TechnicalAnalysis#ForexTrading#StockMarket#CryptoTrading#MarketTrends#BullishPatterns#BearishPatterns#TradingTips
1 note
·
View note
Text
Mastering Candlestick Patterns: A Beginner’s Guide for Forex Traders
Candlestick patterns are powerful tools for Forex trading, providing crucial insights into price action and market sentiment. This beginner-friendly guide explains how to identify and use basic patterns like bullish and bearish engulfing, doji, hammer, and shooting star to predict market movements. Combining candlestick analysis with technical indicators, understanding market context, and practicing risk management can enhance your trading strategies. Whether you’re new to Forex trading or looking to refine your approach, mastering candlestick patterns is essential. Partnering with the Best Forex Broker ensures access to the right tools, educational resources, and a reliable trading platform for long-term success.
0 notes