#Optimize Database Performance SQL
Explore tagged Tumblr posts
Visit Tumblr Blog
Explore Tumblr blogs with no restrictions, modern design and the best experience.
Last Seen Tumblr Blogs


Fun Fact
1,644 Tumblr posts in 1 second.
Text
Managing SQL Server 2022 Workloads with Resource Governor: A Practical Guide
In the ever-evolving landscape of database management, ensuring optimal performance and resource allocation for SQL Server instances is paramount. The Resource Governor, an invaluable feature in SQL Server 2022, stands out as a critical tool for administrators seeking to maintain equilibrium in multi-workload environments. This guide delves into the practical aspects of utilizing the Resource…

View On WordPress
#Manage SQL Workloads SQL Server#Optimize Database Performance SQL#SQL Server 2022 Resource Governor#SQL Server CPU Memory Management#SQL Server Workload Classification
0 notes
Text
🚀 Struggling to balance transactional (OLTP) & analytical (OLAP) workloads? Microsoft Fabric SQL Database is the game-changer! In this blog, I’ll share best practices, pitfalls to avoid, and optimization tips to help you master Fabric SQL DB. Let’s dive in! 💡💬 #MicrosoftFabric #SQL
#Data management#Database Benefits#Database Optimization#Database Tips#Developer-Friendly#Fabric SQL Database#Microsoft Fabric#SQL database#SQL Performance#Transactional Workloads#Unlock SQL Potential
0 notes
Text
Python Libraries to Learn Before Tackling Data Analysis
To tackle data analysis effectively in Python, it's crucial to become familiar with several libraries that streamline the process of data manipulation, exploration, and visualization. Here's a breakdown of the essential libraries:
1. NumPy
- Purpose: Numerical computing.
- Why Learn It: NumPy provides support for large multi-dimensional arrays and matrices, along with a collection of mathematical functions to operate on these arrays efficiently.
- Key Features:
- Fast array processing.
- Mathematical operations on arrays (e.g., sum, mean, standard deviation).
- Linear algebra operations.
2. Pandas
- Purpose: Data manipulation and analysis.
- Why Learn It: Pandas offers data structures like DataFrames, making it easier to handle and analyze structured data.
- Key Features:
- Reading/writing data from CSV, Excel, SQL databases, and more.
- Handling missing data.
- Powerful group-by operations.
- Data filtering and transformation.
3. Matplotlib
- Purpose: Data visualization.
- Why Learn It: Matplotlib is one of the most widely used plotting libraries in Python, allowing for a wide range of static, animated, and interactive plots.
- Key Features:
- Line plots, bar charts, histograms, scatter plots.
- Customizable charts (labels, colors, legends).
- Integration with Pandas for quick plotting.
4. Seaborn
- Purpose: Statistical data visualization.
- Why Learn It: Built on top of Matplotlib, Seaborn simplifies the creation of attractive and informative statistical graphics.
- Key Features:
- High-level interface for drawing attractive statistical graphics.
- Easier to use for complex visualizations like heatmaps, pair plots, etc.
- Visualizations based on categorical data.
5. SciPy
- Purpose: Scientific and technical computing.
- Why Learn It: SciPy builds on NumPy and provides additional functionality for complex mathematical operations and scientific computing.
- Key Features:
- Optimized algorithms for numerical integration, optimization, and more.
- Statistics, signal processing, and linear algebra modules.
6. Scikit-learn
- Purpose: Machine learning and statistical modeling.
- Why Learn It: Scikit-learn provides simple and efficient tools for data mining, analysis, and machine learning.
- Key Features:
- Classification, regression, and clustering algorithms.
- Dimensionality reduction, model selection, and preprocessing utilities.
7. Statsmodels
- Purpose: Statistical analysis.
- Why Learn It: Statsmodels allows users to explore data, estimate statistical models, and perform tests.
- Key Features:
- Linear regression, logistic regression, time series analysis.
- Statistical tests and models for descriptive statistics.
8. Plotly
- Purpose: Interactive data visualization.
- Why Learn It: Plotly allows for the creation of interactive and web-based visualizations, making it ideal for dashboards and presentations.
- Key Features:
- Interactive plots like scatter, line, bar, and 3D plots.
- Easy integration with web frameworks.
- Dashboards and web applications with Dash.
9. TensorFlow/PyTorch (Optional)
- Purpose: Machine learning and deep learning.
- Why Learn It: If your data analysis involves machine learning, these libraries will help in building, training, and deploying deep learning models.
- Key Features:
- Tensor processing and automatic differentiation.
- Building neural networks.
10. Dask (Optional)
- Purpose: Parallel computing for data analysis.
- Why Learn It: Dask enables scalable data manipulation by parallelizing Pandas operations, making it ideal for big datasets.
- Key Features:
- Works with NumPy, Pandas, and Scikit-learn.
- Handles large data and parallel computations easily.
Focusing on NumPy, Pandas, Matplotlib, and Seaborn will set a strong foundation for basic data analysis.
8 notes
·
View notes
Text
Unlocking the Power of Data: Essential Skills to Become a Data Scientist

In today's data-driven world, the demand for skilled data scientists is skyrocketing. These professionals are the key to transforming raw information into actionable insights, driving innovation and shaping business strategies. But what exactly does it take to become a data scientist? It's a multidisciplinary field, requiring a unique blend of technical prowess and analytical thinking. Let's break down the essential skills you'll need to embark on this exciting career path.
1. Strong Mathematical and Statistical Foundation:
At the heart of data science lies a deep understanding of mathematics and statistics. You'll need to grasp concepts like:
Linear Algebra and Calculus: Essential for understanding machine learning algorithms and optimizing models.
Probability and Statistics: Crucial for data analysis, hypothesis testing, and drawing meaningful conclusions from data.
2. Programming Proficiency (Python and/or R):
Data scientists are fluent in at least one, if not both, of the dominant programming languages in the field:
Python: Known for its readability and extensive libraries like Pandas, NumPy, Scikit-learn, and TensorFlow, making it ideal for data manipulation, analysis, and machine learning.
R: Specifically designed for statistical computing and graphics, R offers a rich ecosystem of packages for statistical modeling and visualization.
3. Data Wrangling and Preprocessing Skills:
Raw data is rarely clean and ready for analysis. A significant portion of a data scientist's time is spent on:
Data Cleaning: Handling missing values, outliers, and inconsistencies.
Data Transformation: Reshaping, merging, and aggregating data.
Feature Engineering: Creating new features from existing data to improve model performance.
4. Expertise in Databases and SQL:
Data often resides in databases. Proficiency in SQL (Structured Query Language) is essential for:
Extracting Data: Querying and retrieving data from various database systems.
Data Manipulation: Filtering, joining, and aggregating data within databases.
5. Machine Learning Mastery:
Machine learning is a core component of data science, enabling you to build models that learn from data and make predictions or classifications. Key areas include:
Supervised Learning: Regression, classification algorithms.
Unsupervised Learning: Clustering, dimensionality reduction.
Model Selection and Evaluation: Choosing the right algorithms and assessing their performance.
6. Data Visualization and Communication Skills:
Being able to effectively communicate your findings is just as important as the analysis itself. You'll need to:
Visualize Data: Create compelling charts and graphs to explore patterns and insights using libraries like Matplotlib, Seaborn (Python), or ggplot2 (R).
Tell Data Stories: Present your findings in a clear and concise manner that resonates with both technical and non-technical audiences.
7. Critical Thinking and Problem-Solving Abilities:
Data scientists are essentially problem solvers. You need to be able to:
Define Business Problems: Translate business challenges into data science questions.
Develop Analytical Frameworks: Structure your approach to solve complex problems.
Interpret Results: Draw meaningful conclusions and translate them into actionable recommendations.
8. Domain Knowledge (Optional but Highly Beneficial):
Having expertise in the specific industry or domain you're working in can give you a significant advantage. It helps you understand the context of the data and formulate more relevant questions.
9. Curiosity and a Growth Mindset:
The field of data science is constantly evolving. A genuine curiosity and a willingness to learn new technologies and techniques are crucial for long-term success.
10. Strong Communication and Collaboration Skills:
Data scientists often work in teams and need to collaborate effectively with engineers, business stakeholders, and other experts.
Kickstart Your Data Science Journey with Xaltius Academy's Data Science and AI Program:
Acquiring these skills can seem like a daunting task, but structured learning programs can provide a clear and effective path. Xaltius Academy's Data Science and AI Program is designed to equip you with the essential knowledge and practical experience to become a successful data scientist.
Key benefits of the program:
Comprehensive Curriculum: Covers all the core skills mentioned above, from foundational mathematics to advanced machine learning techniques.
Hands-on Projects: Provides practical experience working with real-world datasets and building a strong portfolio.
Expert Instructors: Learn from industry professionals with years of experience in data science and AI.
Career Support: Offers guidance and resources to help you launch your data science career.
Becoming a data scientist is a rewarding journey that blends technical expertise with analytical thinking. By focusing on developing these key skills and leveraging resources like Xaltius Academy's program, you can position yourself for a successful and impactful career in this in-demand field. The power of data is waiting to be unlocked – are you ready to take the challenge?
3 notes
·
View notes
Text

Wielding Big Data Using PySpark
Introduction to PySpark
PySpark is the Python API for Apache Spark, a distributed computing framework designed to process large-scale data efficiently. It enables parallel data processing across multiple nodes, making it a powerful tool for handling massive datasets.
Why Use PySpark for Big Data?
Scalability: Works across clusters to process petabytes of data.
Speed: Uses in-memory computation to enhance performance.
Flexibility: Supports various data formats and integrates with other big data tools.
Ease of Use: Provides SQL-like querying and DataFrame operations for intuitive data handling.
Setting Up PySpark
To use PySpark, you need to install it and set up a Spark session. Once initialized, Spark allows users to read, process, and analyze large datasets.
Processing Data with PySpark
PySpark can handle different types of data sources such as CSV, JSON, Parquet, and databases. Once data is loaded, users can explore it by checking the schema, summary statistics, and unique values.
Common Data Processing Tasks
Viewing and summarizing datasets.
Handling missing values by dropping or replacing them.
Removing duplicate records.
Filtering, grouping, and sorting data for meaningful insights.
Transforming Data with PySpark
Data can be transformed using SQL-like queries or DataFrame operations. Users can:
Select specific columns for analysis.
Apply conditions to filter out unwanted records.
Group data to find patterns and trends.
Add new calculated columns based on existing data.
Optimizing Performance in PySpark
When working with big data, optimizing performance is crucial. Some strategies include:
Partitioning: Distributing data across multiple partitions for parallel processing.
Caching: Storing intermediate results in memory to speed up repeated computations.
Broadcast Joins: Optimizing joins by broadcasting smaller datasets to all nodes.
Machine Learning with PySpark
PySpark includes MLlib, a machine learning library for big data. It allows users to prepare data, apply machine learning models, and generate predictions. This is useful for tasks such as regression, classification, clustering, and recommendation systems.
Running PySpark on a Cluster
PySpark can run on a single machine or be deployed on a cluster using a distributed computing system like Hadoop YARN. This enables large-scale data processing with improved efficiency.
Conclusion
PySpark provides a powerful platform for handling big data efficiently. With its distributed computing capabilities, it allows users to clean, transform, and analyze large datasets while optimizing performance for scalability.
For Free Tutorials for Programming Languages Visit-https://www.tpointtech.com/
2 notes
·
View notes
Text
My Experience with Database Homework Help from DatabaseHomeworkHelp.com
As a student majoring in computer science, managing the workload can be daunting. One of the most challenging aspects of my coursework has been database management. Understanding the intricacies of SQL, ER diagrams, normalization, and other database concepts often left me overwhelmed. That was until I discovered Database Homework Help from DatabaseHomeworkHelp.com. This service has been a lifesaver, providing me with the support and guidance I needed to excel in my studies.
The Initial Struggle
When I first started my database course, I underestimated the complexity of the subject. I thought it would be as straightforward as other programming courses I had taken. However, as the semester progressed, I found myself struggling with assignments and projects. My grades were slipping, and my confidence was waning. I knew I needed help, but I wasn't sure where to turn.
I tried getting assistance from my professors during office hours, but with so many students needing help, the time available was limited. Study groups with classmates were somewhat helpful, but they often turned into social gatherings rather than focused study sessions. I needed a more reliable and structured form of support.
Discovering DatabaseHomeworkHelp.com
One evening, while frantically searching for online resources to understand an especially tricky ER diagram assignment, I stumbled upon DatabaseHomeworkHelp.com. The website promised expert help on a wide range of database topics, from basic queries to advanced database design and implementation. Skeptical but hopeful, I decided to give it a try. It turned out to be one of the best decisions I’ve made in my academic career.
First Impressions
The first thing that struck me about DatabaseHomeworkHelp.com was the user-friendly interface. The website was easy to navigate, and I quickly found the section where I could submit my assignment. The process was straightforward: I filled out a form detailing my assignment requirements, attached the relevant files, and specified the deadline.
Within a few hours, I received a response from one of their database experts. The communication was professional and reassuring. They asked a few clarifying questions to ensure they fully understood my needs, which gave me confidence that I was in good hands.
The Quality of Help
What impressed me the most was the quality of the assistance I received. The expert assigned to my task not only completed the assignment perfectly but also provided a detailed explanation of the solutions. This was incredibly helpful because it allowed me to understand the concepts rather than just submitting the work.
For example, in one of my assignments, I had to design a complex database schema. The expert not only provided a well-structured schema but also explained the reasoning behind each table and relationship. This level of detail helped me grasp the fundamental principles of database design, something I had been struggling with for weeks.
Learning and Improvement
With each assignment I submitted, I noticed a significant improvement in my understanding of database concepts. The experts at DatabaseHomeworkHelp.com were not just solving problems for me; they were teaching me how to solve them myself. They broke down complex topics into manageable parts and provided clear, concise explanations.
I particularly appreciated their help with SQL queries. Writing efficient and effective SQL queries was one of the areas I found most challenging. The expert guidance I received helped me understand how to approach query writing logically. They showed me how to optimize queries for better performance and how to avoid common pitfalls.
Timely Delivery
Another aspect that stood out was their commitment to deadlines. As a student, timely submission of assignments is crucial. DatabaseHomeworkHelp.com always delivered my assignments well before the deadline, giving me ample time to review the work and ask any follow-up questions. This reliability was a significant relief, especially during times when I had multiple assignments due simultaneously.
Customer Support
The customer support team at DatabaseHomeworkHelp.com deserves a special mention. They were available 24/7, and I never had to wait long for a response. Whether I had a question about the pricing, needed to clarify the assignment details, or required an update on the progress, the support team was always there to assist me promptly and courteously.
Affordable and Worth Every Penny
As a student, budget is always a concern. I was worried that professional homework help would be prohibitively expensive. However, I found the pricing at DatabaseHomeworkHelp.com to be reasonable and affordable. They offer different pricing plans based on the complexity and urgency of the assignment, making it accessible for students with varying budgets.
Moreover, considering the quality of help I received and the improvement in my grades, I can confidently say that their service is worth every penny. The value I got from their expert assistance far outweighed the cost.
A Lasting Impact
Thanks to DatabaseHomeworkHelp.com, my grades in the database course improved significantly. But beyond the grades, the most valuable takeaway has been the knowledge and confidence I gained. I now approach database assignments with a clearer understanding and a more structured method. This confidence has also positively impacted other areas of my studies, as I am less stressed and more organized.
Final Thoughts
If you're a student struggling with database management assignments, I highly recommend Database Homework Help from DatabaseHomeworkHelp.com. Their expert guidance, timely delivery, and excellent customer support can make a significant difference in your academic journey. They don’t just provide answers; they help you understand the material, which is crucial for long-term success.
In conclusion, my experience with DatabaseHomeworkHelp.com has been overwhelmingly positive. The support I received has not only helped me improve my grades but also enhanced my overall understanding of database concepts. I am grateful for their assistance and will undoubtedly continue to use their services as I progress through my computer science degree.

7 notes
·
View notes
Text
Why Tableau is Essential in Data Science: Transforming Raw Data into Insights

Data science is all about turning raw data into valuable insights. But numbers and statistics alone don’t tell the full story—they need to be visualized to make sense. That’s where Tableau comes in.
Tableau is a powerful tool that helps data scientists, analysts, and businesses see and understand data better. It simplifies complex datasets, making them interactive and easy to interpret. But with so many tools available, why is Tableau a must-have for data science? Let’s explore.
1. The Importance of Data Visualization in Data Science
Imagine you’re working with millions of data points from customer purchases, social media interactions, or financial transactions. Analyzing raw numbers manually would be overwhelming.
That’s why visualization is crucial in data science:
Identifies trends and patterns – Instead of sifting through spreadsheets, you can quickly spot trends in a visual format.
Makes complex data understandable – Graphs, heatmaps, and dashboards simplify the interpretation of large datasets.
Enhances decision-making – Stakeholders can easily grasp insights and make data-driven decisions faster.
Saves time and effort – Instead of writing lengthy reports, an interactive dashboard tells the story in seconds.
Without tools like Tableau, data science would be limited to experts who can code and run statistical models. With Tableau, insights become accessible to everyone—from data scientists to business executives.
2. Why Tableau Stands Out in Data Science
A. User-Friendly and Requires No Coding
One of the biggest advantages of Tableau is its drag-and-drop interface. Unlike Python or R, which require programming skills, Tableau allows users to create visualizations without writing a single line of code.
Even if you’re a beginner, you can:
✅ Upload data from multiple sources
✅ Create interactive dashboards in minutes
✅ Share insights with teams easily
This no-code approach makes Tableau ideal for both technical and non-technical professionals in data science.
B. Handles Large Datasets Efficiently
Data scientists often work with massive datasets—whether it’s financial transactions, customer behavior, or healthcare records. Traditional tools like Excel struggle with large volumes of data.
Tableau, on the other hand:
Can process millions of rows without slowing down
Optimizes performance using advanced data engine technology
Supports real-time data streaming for up-to-date analysis
This makes it a go-to tool for businesses that need fast, data-driven insights.
C. Connects with Multiple Data Sources
A major challenge in data science is bringing together data from different platforms. Tableau seamlessly integrates with a variety of sources, including:
Databases: MySQL, PostgreSQL, Microsoft SQL Server
Cloud platforms: AWS, Google BigQuery, Snowflake
Spreadsheets and APIs: Excel, Google Sheets, web-based data sources
This flexibility allows data scientists to combine datasets from multiple sources without needing complex SQL queries or scripts.
D. Real-Time Data Analysis
Industries like finance, healthcare, and e-commerce rely on real-time data to make quick decisions. Tableau’s live data connection allows users to:
Track stock market trends as they happen
Monitor website traffic and customer interactions in real time
Detect fraudulent transactions instantly
Instead of waiting for reports to be generated manually, Tableau delivers insights as events unfold.
E. Advanced Analytics Without Complexity
While Tableau is known for its visualizations, it also supports advanced analytics. You can:
Forecast trends based on historical data
Perform clustering and segmentation to identify patterns
Integrate with Python and R for machine learning and predictive modeling
This means data scientists can combine deep analytics with intuitive visualization, making Tableau a versatile tool.
3. How Tableau Helps Data Scientists in Real Life
Tableau has been adopted by the majority of industries to make data science more impactful and accessible. This is applied in the following real-life scenarios:
A. Analytics for Health Care
Tableau is deployed by hospitals and research institutions for the following purposes:
Monitor patient recovery rates and predict outbreaks of diseases
Analyze hospital occupancy and resource allocation
Identify trends in patient demographics and treatment results
B. Finance and Banking
Banks and investment firms rely on Tableau for the following purposes:
✅ Detect fraud by analyzing transaction patterns
✅ Track stock market fluctuations and make informed investment decisions
✅ Assess credit risk and loan performance
C. Marketing and Customer Insights
Companies use Tableau to:
✅ Track customer buying behavior and personalize recommendations
✅ Analyze social media engagement and campaign effectiveness
✅ Optimize ad spend by identifying high-performing channels
D. Retail and Supply Chain Management
Retailers leverage Tableau to:
✅ Forecast product demand and adjust inventory levels
✅ Identify regional sales trends and adjust marketing strategies
✅ Optimize supply chain logistics and reduce delivery delays
These applications show why Tableau is a must-have for data-driven decision-making.
4. Tableau vs. Other Data Visualization Tools
There are many visualization tools available, but Tableau consistently ranks as one of the best. Here’s why:
Tableau vs. Excel – Excel struggles with big data and lacks interactivity; Tableau handles large datasets effortlessly.
Tableau vs. Power BI – Power BI is great for Microsoft users, but Tableau offers more flexibility across different data sources.
Tableau vs. Python (Matplotlib, Seaborn) – Python libraries require coding skills, while Tableau simplifies visualization for all users.
This makes Tableau the go-to tool for both beginners and experienced professionals in data science.
5. Conclusion
Tableau has become an essential tool in data science because it simplifies data visualization, handles large datasets, and integrates seamlessly with various data sources. It enables professionals to analyze, interpret, and present data interactively, making insights accessible to everyone—from data scientists to business leaders.
If you’re looking to build a strong foundation in data science, learning Tableau is a smart career move. Many data science courses now include Tableau as a key skill, as companies increasingly demand professionals who can transform raw data into meaningful insights.
In a world where data is the driving force behind decision-making, Tableau ensures that the insights you uncover are not just accurate—but also clear, impactful, and easy to act upon.
#data science course#top data science course online#top data science institute online#artificial intelligence course#deepseek#tableau
3 notes
·
View notes
Text
Use DBCC SQLPerf (logspace) to monitor and optimize database performance in SQL Server. Let's Explore: Let's Explore:
https://madesimplemssql.com/dbcc-sqlperf-logspace/
Please follow us on FB: https://www.facebook.com/profile.php?id=100091338502392
OR
Join our Group: https://www.facebook.com/groups/652527240081844

2 notes
·
View notes
Text
Maximizing Business Insights with Power BI: A Comprehensive Guide for Small Businesses
Maximizing Business Insights Small businesses often face the challenge of making data-driven decisions without the resources of larger enterprises. Power BI, Microsoft's powerful analytics tool, can transform how small businesses use data, turning raw numbers into actionable insights. Here's a comprehensive guide to maximizing business insights with Power BI.
Introduction to Power BI
Power BI is a business analytics service by Microsoft that provides interactive visualizations and business intelligence capabilities. With an interface simple enough for end users to create their own reports and dashboards, it connects to a wide range of data sources.
Benefits for Small Businesses
1. User-Friendly Interface: Power BI's drag-and-drop functionality makes it accessible for users without technical expertise.
2. Cost-Effective: Power BI offers a free version with substantial features and a scalable pricing model for additional needs.
3. Real-Time Data: Businesses can monitor their operations with real-time data, enabling quicker and more informed decision-making.
Setting Up Power BI
1. Data Sources: Power BI can connect to various data sources such as Excel, SQL databases, and cloud services like Azure.
2. Data Modeling: Use Power BI to clean and transform data, creating a cohesive data model that forms the foundation of your reports.
3. Visualizations: Choose from a wide array of visualizations to represent your data. Customize these visuals to highlight the most critical insights.
Customizing Dashboards
1. Tailor to Needs: Customize dashboards to reflect the unique needs of your business, focusing on key performance indicators (KPIs) relevant to your goals.
2. Interactive Reports:Create interactive reports that allow users to explore data more deeply, providing a clearer understanding of underlying trends.
Real-World Examples
Several small businesses have successfully implemented Power BI to gain a competitive edge:
1. Retail: A small retail store used Power BI to track sales trends, optimize inventory, and identify peak shopping times.
2. Finance:A small financial advisory firm employed Power BI to analyze client portfolios, improving investment strategies and client satisfaction.
Integration with Existing Tools
Power BI seamlessly integrates with other Microsoft products such as Excel and Azure, as well as third-party applications, ensuring a smooth workflow and enhanced productivity.
Best Practices
1. Data Accuracy: Ensure data accuracy by regularly updating your data sources.
2. Training: Invest in training your team to use Power BI effectively.
3. Security: Implement robust security measures to protect sensitive data.
Future Trends
Power BI continues to evolve, with future updates likely to include more advanced AI features and enhanced data processing capabilities, keeping businesses at the forefront of technology.
Conclusion
Power BI offers small businesses a powerful tool to transform their data into meaningful insights. By adopting Power BI, businesses can improve decision-making, enhance operational efficiency, and gain a competitive advantage. Partnering with Vbeyond Digital ensures a smooth and successful implementation, maximizing the benefits of Power BI for your business. with Power BI: A Comprehensive Guide for Small Businesses
3 notes
·
View notes
Text
Can I use Python for big data analysis?
Yes, Python is a powerful tool for big data analysis. Here’s how Python handles large-scale data analysis:
Libraries for Big Data:
Pandas:
While primarily designed for smaller datasets, Pandas can handle larger datasets efficiently when used with tools like Dask or by optimizing memory usage..
NumPy:
Provides support for large, multi-dimensional arrays and matrices, along with a collection of mathematical functions to operate on these arrays.
Dask:
A parallel computing library that extends Pandas and NumPy to larger datasets. It allows you to scale Python code from a single machine to a distributed cluster
Distributed Computing:
PySpark:
The Python API for Apache Spark, which is designed for large-scale data processing. PySpark can handle big data by distributing tasks across a cluster of machines, making it suitable for large datasets and complex computations.
Dask:
Also provides distributed computing capabilities, allowing you to perform parallel computations on large datasets across multiple cores or nodes.
Data Storage and Access:
HDF5:
A file format and set of tools for managing complex data. Python’s h5py library provides an interface to read and write HDF5 files, which are suitable for large datasets.
Databases:
Python can interface with various big data databases like Apache Cassandra, MongoDB, and SQL-based systems. Libraries such as SQLAlchemy facilitate connections to relational databases.
Data Visualization:
Matplotlib, Seaborn, and Plotly: These libraries allow you to create visualizations of large datasets, though for extremely large datasets, tools designed for distributed environments might be more appropriate.
Machine Learning:
Scikit-learn:
While not specifically designed for big data, Scikit-learn can be used with tools like Dask to handle larger datasets.
TensorFlow and PyTorch:
These frameworks support large-scale machine learning and can be integrated with big data processing tools for training and deploying models on large datasets.
Python’s ecosystem includes a variety of tools and libraries that make it well-suited for big data analysis, providing flexibility and scalability to handle large volumes of data.
Drop the message to learn more….!
2 notes
·
View notes
Text
Breaking Homework Barriers: Journey to Database Brilliance

In the fast-paced world of academia, students often find themselves grappling with the intricacies of database management and SQL homework. The challenges posed by these assignments can be daunting, leaving many seeking a guiding light to navigate the complexities of database design, queries, and optimization. If you're one of those students desperately searching for "help with mySQL homework," you've come to the right place. This blog will serve as your roadmap, guiding you through the journey to unlock the secrets of database brilliance.
Unraveling the Mysteries of mySQL Homework
Help with mySQL homework is more than just a search query; it's a plea for assistance in unraveling the mysteries of structured query language and database management systems. As you embark on your academic quest, you'll encounter challenges that test your understanding of data modeling, SQL syntax, and the nuances of optimizing database performance. Fear not, for every hurdle you face is an opportunity to grow and master the art of database design.
Navigating the Database Landscape
To embark on this journey, it's crucial to understand the landscape you're navigating. Databases are the backbone of modern applications, storing and managing vast amounts of information. SQL, or Structured Query Language, serves as the key to interacting with these databases, allowing you to retrieve, insert, update, and delete data seamlessly. However, the road to becoming proficient in SQL can be winding, filled with challenges that demand attention to detail and a deep understanding of database concepts.
The Role of Expert Guidance
In your quest for database brilliance, seeking expert guidance is akin to having a seasoned navigator on your journey. Platforms like DatabaseHomeworkHelp.com are designed to provide comprehensive help with mySQL homework. These services offer a lifeline for students drowning in assignments, providing expert assistance that goes beyond mere completion to ensure understanding and mastery of database principles.
Tailored Solutions for Individual Needs
One size does not fit all, especially when it comes to mastering database concepts. Help with mySQL homework should be tailored to your individual needs and learning style. A reliable service will not only assist with assignment completion but also provide detailed explanations, clarifying doubts and reinforcing your understanding of SQL. This personalized approach is the key to breaking down barriers and fostering true brilliance in database management.
Overcoming Common Challenges
As you delve into the world of databases, you'll likely encounter common challenges that can be stumbling blocks in your academic journey. Whether it's understanding normalization, crafting complex queries, or optimizing database performance, expert assistance can make all the difference. These challenges, when conquered with the right guidance, become stepping stones to a deeper understanding of database management.
Building a Foundation for Future Success
The journey to database brilliance is not just about completing assignments; it's about building a solid foundation for future success. The skills you acquire in navigating SQL and database design will prove invaluable in real-world scenarios. As industries increasingly rely on data-driven decision-making, your proficiency in database management will set you apart in the job market.
Embracing the Learning Process
Every stumble, every challenge, and every "help with mySQL homework" query is an integral part of your learning process. Embrace the journey, knowing that each assignment is an opportunity to enhance your skills. Don't shy away from seeking assistance when needed, as it's a sign of strength to recognize your limitations and actively work towards overcoming them.
Conclusion: Your Path to Database Brilliance
In conclusion, the journey to database brilliance is not a solitary one; it's a collaborative effort that involves seeking guidance, overcoming challenges, and embracing the learning process. When faced with the complexities of SQL homework, remember that help with mySQL homework is readily available. Take advantage of the resources at your disposal, and soon you'll find yourself not just completing assignments but mastering the art of database management. Your path to brilliance starts now.
10 notes
·
View notes
Text
Converting Nonclustered Primary Keys
Say you have inherited a SQL Server database with numerous nonclustered primary keys (PKs) and few clustered indexes experiencing suboptimal query performance. In this situation, adding clustered indexes or rebuilding PKs as clustered can potentially improve query speed. However, there are some important considerations to keep in mind. Understanding Clustered Indexes Clustered indexes…
View On WordPress
#clustered indexes#database management#primary key optimization#query efficiency enhancement#SQL Server performance
0 notes
Text
Empower Data Analysis with Materialized Views in Databricks SQL
Envision a realm where your data is always ready for querying, with intricate queries stored in a format primed for swift retrieval and analysis. Picture a world where time is no longer a constraint, where data handling is both rapid and efficient.
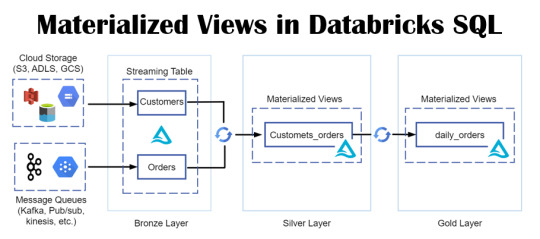
View On WordPress
#Azure#Azure SQL Database#data#Database#Database Management#Databricks#Databricks CLI#Databricks Delta Live Table#Databricks SQL#Databricks Unity catalog#Delta Live#Materialized Views#Microsoft#microsoft azure#Optimization#Performance Optimization#queries#SQL#SQL database#Streaming tables#tables#Unity Catalog#views
0 notes
Text
From Zero to Hero: Grow Your Data Science Skills
Understanding the Foundations of Data Science
We produce around 2.5 quintillion bytes of data worldwide, which is enough to fill 10 million DVDs! That huge amount of data is more like a goldmine for data scientists, they use different tools and complex algorithms to find valuable insights.
Here's the deal: data science is all about finding valuable insights from the raw data. It's more like playing a jigsaw puzzle with a thousand parts and figuring out how they all go together. Begin with the basics, Learn how to gather, clean, analyze, and present data in a straightforward and easy-to-understand way.
Here Are The Skill Needed For A Data Scientists
Okay, let’s talk about the skills you’ll need to be a pro in data science. First up: programming. Python is your new best friend, it is powerful and surprisingly easy to learn. By using the libraries like Pandas and NumPy, you can manage the data like a pro.
Statistics is another tool you must have a good knowledge of, as a toolkit that will help you make sense of all the numbers and patterns you deal with. Next is machine learning, and here you train the data model by using a huge amount of data and make predictions out of it.
Once you analyze and have insights from the data, and next is to share this valuable information with others by creating simple and interactive data visualizations by using charts and graphs.
The Programming Language Every Data Scientist Must Know
Python is the language every data scientist must know, but there are some other languages also that are worth your time. R is another language known for its statistical solid power if you are going to deal with more numbers and data, then R might be the best tool for you.
SQL is one of the essential tools, it is the language that is used for managing the database, and if you know how to query the database effectively, then it will make your data capturing and processing very easy.
Exploring Data Science Tools and Technologies
Alright, so you’ve got your programming languages down. Now, let’s talk about tools. Jupyter Notebooks are fantastic for writing and sharing your code. They let you combine code, visualizations, and explanations in one place, making it easier to document your work and collaborate with others.
To create a meaningful dashboard Tableau is the tool most commonly used by data scientists. It is a tool that can create interactive dashboards and visualizations that will help you share valuable insights with people who do not have an excellent technical background.
Building a Strong Mathematical Foundation
Math might not be everyone’s favorite subject, but it’s a crucial part of data science. You’ll need a good grasp of statistics for analyzing data and drawing conclusions. Linear algebra is important for understanding how the algorithms work, specifically in machine learning. Calculus helps optimize algorithms, while probability theory lets you handle uncertainty in your data. You need to create a mathematical model that helps you represent and analyze real-world problems. So it is essential to sharpen your mathematical skills which will give you a solid upper hand in dealing with complex data science challenges.
Do Not Forget the Data Cleaning and Processing Skills
Before you can dive into analysis, you need to clean the data and preprocess the data. This step can feel like a bit of a grind, but it’s essential. You’ll deal with missing data and decide whether to fill in the gaps or remove them. Data transformation normalizing and standardizing the data to maintain consistency in the data sets. Feature engineering is all about creating a new feature from the existing data to improve the models. Knowing this data processing technique will help you perform a successful analysis and gain better insights.
Diving into Machine Learning and AI
Machine learning and AI are where the magic happens. Supervised learning involves training models using labeled data to predict the outcomes. On the other hand, unsupervised learning assists in identifying patterns in data without using predetermined labels. Deep learning comes into play when dealing with complicated patterns and producing correct predictions, which employs neural networks. Learn how to use AI in data science to do tasks more efficiently.
How Data Science Helps To Solve The Real-world Problems
Knowing the theory is great, but applying what you’ve learned to real-world problems is where you see the impact. Participate in data science projects to gain practical exposure and create a good portfolio. Look into case studies to see how others have tackled similar issues. Explore how data science is used in various industries from healthcare to finance—and apply your skills to solve real-world challenges.
Always Follow Data Science Ethics and Privacy
Handling data responsibly is a big part of being a data scientist. Understanding the ethical practices and privacy concerns associated with your work is crucial. Data privacy regulations, such as GDPR, set guidelines for collecting and using data. Responsible AI practices ensure that your models are fair and unbiased. Being transparent about your methods and accountable for your results helps build trust and credibility. These ethical standards will help you maintain integrity in your data science practice.
Building Your Data Science Portfolio and Career
Let’s talk about careers. Building a solid portfolio is important for showcasing your skills and projects. Include a variety of projects that showcase your skills to tackle real-world problems. The data science job market is competitive, so make sure your portfolio is unique. Earning certifications can also boost your profile and show your dedication in this field. Networking with other data professionals through events, forums, and social media can be incredibly valuable. When you are facing job interviews, preparation is critical. Practice commonly asked questions to showcase your expertise effectively.
To Sum-up
Now you have a helpful guideline to begin your journey in data science. Always keep yourself updated in this field to stand out if you are just starting or want to improve. Check this blog to find the best data science course in Kolkata. You are good to go on this excellent career if you build a solid foundation to improve your skills and apply what you have learned in real life.
2 notes
·
View notes
Text
Business Analytics vs. Data Science: Understanding the Key Differences

In today's data-driven world, terms like "business analytics" and "data science" are often used interchangeably. However, while they share a common goal of extracting insights from data, they are distinct fields with different focuses and methodologies. Let's break down the key differences to help you understand which path might be right for you.
Business Analytics: Focusing on the Present and Past
Business analytics primarily focuses on analyzing historical data to understand past performance and inform current business decisions. It aims to answer questions like:
What happened?
Why did it happen?
What is happening now?
Key characteristics of business analytics:
Descriptive and Diagnostic: It uses techniques like reporting, dashboards, and data visualization to summarize and explain past trends.
Structured Data: It often works with structured data from databases and spreadsheets.
Business Domain Expertise: A strong understanding of the specific business domain is crucial.
Tools: Business analysts typically use tools like Excel, SQL, Tableau, and Power BI.
Focus: Optimizing current business operations and improving efficiency.
Data Science: Predicting the Future and Building Models
Data science, on the other hand, focuses on building predictive models and developing algorithms to forecast future outcomes. It aims to answer questions like:
What will happen?
How can we make it happen?
Key characteristics of data science:
Predictive and Prescriptive: It uses machine learning, statistical modeling, and AI to predict future trends and prescribe optimal actions.
Unstructured and Structured Data: It can handle both structured and unstructured data from various sources.
Technical Proficiency: Strong programming skills (Python, R) and a deep understanding of machine learning algorithms are essential.
Tools: Data scientists use programming languages, machine learning libraries, and big data technologies.
Focus: Developing innovative solutions, building AI-powered products, and driving long-term strategic initiatives.
Key Differences Summarized:

Which Path is Right for You?
Choose Business Analytics if:
You are interested in analyzing past data to improve current business operations.
You have a strong understanding of a specific business domain.
You prefer working with structured data and using visualization tools.
Choose Data Science if:
You are passionate about building predictive models and developing AI-powered solutions.
You have a strong interest in programming and machine learning.
You enjoy working with both structured and unstructured data.
Xaltius Academy's Data Science & AI Course:
If you're leaning towards data science and want to delve into machine learning and AI, Xaltius Academy's Data Science & AI course is an excellent choice. This program equips you with the necessary skills and knowledge to become a proficient data scientist, covering essential topics like:
Python programming
Machine learning algorithms
Data visualization
And much more!
By understanding the distinct roles of business analytics and data science, you can make an informed decision about your career path and leverage the power of data to drive success.
2 notes
·
View notes
Text
5 useful tools for engineers! Introducing recommendations to improve work efficiency
Engineers have to do a huge amount of coding. It’s really tough having to handle other duties and schedule management at the same time. Having the right tools is key to being a successful engineer.
Here are some tools that will help you improve your work efficiency.
1.SourceTree
“SourceTree” is free Git client software provided by Atlassian. It is a tool for source code management and version control for developers and teams using the version control system called Git. When developers and teams use Git to manage projects, it supports efficient development work by providing a visualized interface and rich functionality.
2.Charles
“Charles” is an HTTP proxy tool for web development and debugging, and a debugging proxy tool for capturing HTTP and HTTPS traffic, visualizing and analyzing communication between networks. This allows web developers and system administrators to observe requests and responses for debugging, testing, performance optimization, and more.
3.iTerm2
“iTerm2” is a highly functional terminal emulator for macOS, and is an application that allows terminal operations to be performed more comfortably and efficiently. It offers more features than the standard Terminal application. It has rich features such as tab splitting, window splitting, session management, customizable appearance, and script execution.
4.Navicat
Navicat is an integrated tool for performing database management and development tasks and supports many major database systems (MySQL, PostgreSQL, SQLite, Oracle, SQL Server, etc.). Using Navicat, you can efficiently perform tasks such as database structure design, data editing and management, SQL query execution, data modeling, backup and restore.
5.CodeLF
CodeLF (Code Language Framework) is a tool designed to help find, navigate, and understand code within large source code bases. Key features include finding and querying symbols such as functions, variables, and classes in your codebase, viewing code snippets, and visualizing relationships between code. It can aid in efficient code navigation and understanding, increasing productivity in the development process.
2 notes
·
View notes