#spark sql dataframes
Explore tagged Tumblr posts
Visit Tumblr Blog
Explore Tumblr blogs with no restrictions, modern design and the best experience.
Last Seen Tumblr Blogs


Fun Fact
Tumblr has been providing a Korean-language service since 2013.
Text
Exploring the Latest Features of Apache Spark 3.4 for Databricks Runtime
In the dynamic landscape of big data and analytics, staying at the forefront of technology is essential for organizations aiming to harness the full potential of their data-driven initiatives.

View On WordPress
#Apache Spark#API#Databricks#databricks apache spark#Databricks SQL#Dataframe#Developers#Filter Join#pyspark#pyspark for beginners#pyspark for data engineers#pyspark in azure databricks#Schema#Software Developers#Spark Cluster#Spark Connect#SQL#SQL SELECT#SQL Server
0 notes
Text

Wielding Big Data Using PySpark
Introduction to PySpark
PySpark is the Python API for Apache Spark, a distributed computing framework designed to process large-scale data efficiently. It enables parallel data processing across multiple nodes, making it a powerful tool for handling massive datasets.
Why Use PySpark for Big Data?
Scalability: Works across clusters to process petabytes of data.
Speed: Uses in-memory computation to enhance performance.
Flexibility: Supports various data formats and integrates with other big data tools.
Ease of Use: Provides SQL-like querying and DataFrame operations for intuitive data handling.
Setting Up PySpark
To use PySpark, you need to install it and set up a Spark session. Once initialized, Spark allows users to read, process, and analyze large datasets.
Processing Data with PySpark
PySpark can handle different types of data sources such as CSV, JSON, Parquet, and databases. Once data is loaded, users can explore it by checking the schema, summary statistics, and unique values.
Common Data Processing Tasks
Viewing and summarizing datasets.
Handling missing values by dropping or replacing them.
Removing duplicate records.
Filtering, grouping, and sorting data for meaningful insights.
Transforming Data with PySpark
Data can be transformed using SQL-like queries or DataFrame operations. Users can:
Select specific columns for analysis.
Apply conditions to filter out unwanted records.
Group data to find patterns and trends.
Add new calculated columns based on existing data.
Optimizing Performance in PySpark
When working with big data, optimizing performance is crucial. Some strategies include:
Partitioning: Distributing data across multiple partitions for parallel processing.
Caching: Storing intermediate results in memory to speed up repeated computations.
Broadcast Joins: Optimizing joins by broadcasting smaller datasets to all nodes.
Machine Learning with PySpark
PySpark includes MLlib, a machine learning library for big data. It allows users to prepare data, apply machine learning models, and generate predictions. This is useful for tasks such as regression, classification, clustering, and recommendation systems.
Running PySpark on a Cluster
PySpark can run on a single machine or be deployed on a cluster using a distributed computing system like Hadoop YARN. This enables large-scale data processing with improved efficiency.
Conclusion
PySpark provides a powerful platform for handling big data efficiently. With its distributed computing capabilities, it allows users to clean, transform, and analyze large datasets while optimizing performance for scalability.
For Free Tutorials for Programming Languages Visit-https://www.tpointtech.com/
2 notes
·
View notes
Text
The Best Open-Source Tools for Data Science in 2025

Data science in 2025 is thriving, driven by a robust ecosystem of open-source tools that empower professionals to extract insights, build predictive models, and deploy data-driven solutions at scale. This year, the landscape is more dynamic than ever, with established favorites and emerging contenders shaping how data scientists work. Here’s an in-depth look at the best open-source tools that are defining data science in 2025.
1. Python: The Universal Language of Data Science
Python remains the cornerstone of data science. Its intuitive syntax, extensive libraries, and active community make it the go-to language for everything from data wrangling to deep learning. Libraries such as NumPy and Pandas streamline numerical computations and data manipulation, while scikit-learn is the gold standard for classical machine learning tasks.
NumPy: Efficient array operations and mathematical functions.
Pandas: Powerful data structures (DataFrames) for cleaning, transforming, and analyzing structured data.
scikit-learn: Comprehensive suite for classification, regression, clustering, and model evaluation.
Python’s popularity is reflected in the 2025 Stack Overflow Developer Survey, with 53% of developers using it for data projects.
2. R and RStudio: Statistical Powerhouses
R continues to shine in academia and industries where statistical rigor is paramount. The RStudio IDE enhances productivity with features for scripting, debugging, and visualization. R’s package ecosystem—especially tidyverse for data manipulation and ggplot2 for visualization—remains unmatched for statistical analysis and custom plotting.
Shiny: Build interactive web applications directly from R.
CRAN: Over 18,000 packages for every conceivable statistical need.
R is favored by 36% of users, especially for advanced analytics and research.
3. Jupyter Notebooks and JupyterLab: Interactive Exploration
Jupyter Notebooks are indispensable for prototyping, sharing, and documenting data science workflows. They support live code (Python, R, Julia, and more), visualizations, and narrative text in a single document. JupyterLab, the next-generation interface, offers enhanced collaboration and modularity.
Over 15 million notebooks hosted as of 2025, with 80% of data analysts using them regularly.
4. Apache Spark: Big Data at Lightning Speed
As data volumes grow, Apache Spark stands out for its ability to process massive datasets rapidly, both in batch and real-time. Spark’s distributed architecture, support for SQL, machine learning (MLlib), and compatibility with Python, R, Scala, and Java make it a staple for big data analytics.
65% increase in Spark adoption since 2023, reflecting its scalability and performance.
5. TensorFlow and PyTorch: Deep Learning Titans
For machine learning and AI, TensorFlow and PyTorch dominate. Both offer flexible APIs for building and training neural networks, with strong community support and integration with cloud platforms.
TensorFlow: Preferred for production-grade models and scalability; used by over 33% of ML professionals.
PyTorch: Valued for its dynamic computation graph and ease of experimentation, especially in research settings.
6. Data Visualization: Plotly, D3.js, and Apache Superset
Effective data storytelling relies on compelling visualizations:
Plotly: Python-based, supports interactive and publication-quality charts; easy for both static and dynamic visualizations.
D3.js: JavaScript library for highly customizable, web-based visualizations; ideal for specialists seeking full control.
Apache Superset: Open-source dashboarding platform for interactive, scalable visual analytics; increasingly adopted for enterprise BI.
Tableau Public, though not fully open-source, is also popular for sharing interactive visualizations with a broad audience.
7. Pandas: The Data Wrangling Workhorse
Pandas remains the backbone of data manipulation in Python, powering up to 90% of data wrangling tasks. Its DataFrame structure simplifies complex operations, making it essential for cleaning, transforming, and analyzing large datasets.
8. Scikit-learn: Machine Learning Made Simple
scikit-learn is the default choice for classical machine learning. Its consistent API, extensive documentation, and wide range of algorithms make it ideal for tasks such as classification, regression, clustering, and model validation.
9. Apache Airflow: Workflow Orchestration
As data pipelines become more complex, Apache Airflow has emerged as the go-to tool for workflow automation and orchestration. Its user-friendly interface and scalability have driven a 35% surge in adoption among data engineers in the past year.
10. MLflow: Model Management and Experiment Tracking
MLflow streamlines the machine learning lifecycle, offering tools for experiment tracking, model packaging, and deployment. Over 60% of ML engineers use MLflow for its integration capabilities and ease of use in production environments.
11. Docker and Kubernetes: Reproducibility and Scalability
Containerization with Docker and orchestration via Kubernetes ensure that data science applications run consistently across environments. These tools are now standard for deploying models and scaling data-driven services in production.
12. Emerging Contenders: Streamlit and More
Streamlit: Rapidly build and deploy interactive data apps with minimal code, gaining popularity for internal dashboards and quick prototypes.
Redash: SQL-based visualization and dashboarding tool, ideal for teams needing quick insights from databases.
Kibana: Real-time data exploration and monitoring, especially for log analytics and anomaly detection.
Conclusion: The Open-Source Advantage in 2025
Open-source tools continue to drive innovation in data science, making advanced analytics accessible, scalable, and collaborative. Mastery of these tools is not just a technical advantage—it’s essential for staying competitive in a rapidly evolving field. Whether you’re a beginner or a seasoned professional, leveraging this ecosystem will unlock new possibilities and accelerate your journey from raw data to actionable insight.
The future of data science is open, and in 2025, these tools are your ticket to building smarter, faster, and more impactful solutions.
#python#r#rstudio#jupyternotebook#jupyterlab#apachespark#tensorflow#pytorch#plotly#d3js#apachesuperset#pandas#scikitlearn#apacheairflow#mlflow#docker#kubernetes#streamlit#redash#kibana#nschool academy#datascience
0 notes
Text
Lightning Engine: A New Era for Apache Spark Speed

Apache Spark analyses enormous data sets for ETL, data science, machine learning, and more. Scaled performance and cost efficiency may be issues. Users often experience resource utilisation, data I/O, and query execution bottlenecks, which slow processing and increase infrastructure costs.
Google Cloud knows these issues well. Lightning Engine (preview), the latest and most powerful Spark engine, unleashes your lakehouse's full potential and provides best-in-class Spark performance.
Lightning Engine?
Lightning Engine prioritises file-system layer and data-access connector optimisations as well as query and execution optimisations.
Lightning Engine enhances Spark query speed by 3.6x on TPC-H workloads at 10TB compared to open source Spark on equivalent equipment.
Lightning Engine's primary advancements are shown above:
Lightning Engine's Spark optimiser is improved by Google's F1 and Procella experience. This advanced optimiser includes adaptive query execution for join removal and exchange reuse, subquery fusion to consolidate scans, advanced inferred filters for semi-join pushdowns, dynamic in-filter generation for effective row-group pruning in Iceberg and Delta tables, optimising Bloom filters based on listing call statistics, and more. Scan and shuffle savings are significant when combined.
Lightning Engine's execution engine boosts performance with a native Apache Gluten and Velox implementation designed for Google's hardware. This uses unified memory management to switch between off-heap and on-heap memory without changing Spark settings. Lightning Engine now supports operators, functions, and Spark data types and can automatically detect when to use the native engine for pushdown results.
Lightning Engine employs columnar shuffle with an optimised serializer-deserializer to decrease shuffle data.
Lightning Engine uses a parquet parser for prefetching, caching, and in-filtering to reduce data scans and metadata operations.
Lightning Engine increases BigQuery and Google Cloud Storage connection to speed up its native engine. An optimised file output committer boosts Spark application performance and reliability, while the upgraded Cloud Storage connection reduces metadata operations to save money. By providing data directly to the engine in Apache Arrow format and eliminating row-to-columnar conversions, the new native BigQuery connection simplifies data delivery.
Lightning Engine works with SQL APIs and Apache Spark DataFrame, so workloads run seamlessly without code changes.
Lightning Engine—why?
Lightning Engine outperforms cloud Spark competitors and is cheaper. Open formats like Apache Iceberg and Delta Lake can boost business efficiency using BigQuery and Google Cloud's cutting-edge AI/ML.
Lightning Engine outperforms DIY Spark implementations, saving you money and letting you focus on your business challenges.
Advantages
Main lightning engine benefits
Faster query performance: Uses a new Spark processing engine with vectorised execution, intelligent caching, and optimised storage I/O.
Leading industry price-performance ratio: Allows customers to manage more data for less money by providing superior performance and cost effectiveness.
Intelligible Lakehouse integration: Integrates with Google Cloud services including BigQuery, Vertex AI, Apache Iceberg, and Delta Lake to provide a single data analytics and AI platform.
Optimised BigQuery and Cloud Storage connections increase data access latency, throughput, and metadata operations.
Flexible deployments: Cluster-based and serverless.
Lightning Engine boosts performance, although the impact depends on workload. It works well for compute-intensive Spark Dataframe API and Spark SQL queries, not I/O-bound tasks.
Spark's Google Cloud future
Google Cloud is excited to apply Google's size, performance, and technical prowess to Apache Spark workloads with the new Lightning Engine data query engine, enabling developers worldwide. It wants to speed it up in the following months, so this is just the start!
Google Cloud Serverless for Apache Spark and Dataproc on Google Compute Engine premium tiers demonstrate Lightning Engine. Both services offer GPU support for faster machine learning and task monitoring for operational efficiency.
#ApacheSpark#LightningEngine#BigQuery#CloudStorage#ApacheSparkDataFrame#Sparkengine#technology#technews#technologynews#news#govindhtech
0 notes
Text
PySpark SQL: Introduction & Basic Queries
Introduction
In today’s data-driven world, the volume and variety of data have exploded. Traditional tools often struggle to process and analyze massive datasets efficiently. That’s where Apache Spark comes into the picture — a lightning-fast, unified analytics engine for big data processing.
For Python developers, PySpark — the Python API for Apache Spark — offers an intuitive way to work with Spark. Among its powerful modules, PySpark SQL stands out. It enables you to query structured data using SQL syntax or DataFrame operations. This hybrid capability makes it easy to blend the power of Spark with the familiarity of SQL.
In this blog, we'll explore what PySpark SQL is, why it’s so useful, how to set it up, and cover the most essential SQL queries with examples — perfect for beginners diving into big data with Python.
Agenda
Here's what we'll cover:
What is PySpark SQL?
Why should you use PySpark SQL?
Installing and setting up PySpark
Basic SQL queries in PySpark
Best practices for working efficiently
Final thoughts
What is PySpark SQL?
PySpark SQL is a module of Apache Spark that enables querying structured data using SQL commands or a more programmatic DataFrame API. It offers:
Support for SQL-style queries on large datasets.
A seamless bridge between relational logic and Python.
Optimizations using the Catalyst query optimizer and Tungsten execution engine for efficient computation.
In simple terms, PySpark SQL lets you use SQL to analyze big data at scale — without needing traditional database systems.
Why Use PySpark SQL?
Here are a few compelling reasons to use PySpark SQL:
Scalability: It can handle terabytes of data spread across clusters.
Ease of use: Combines the simplicity of SQL with the flexibility of Python.
Performance: Optimized query execution ensures fast performance.
Interoperability: Works with various data sources — including Hive, JSON, Parquet, and CSV.
Integration: Supports seamless integration with DataFrames and MLlib for machine learning.
Whether you're building dashboards, ETL pipelines, or machine learning workflows — PySpark SQL is a reliable choice.
Setting Up PySpark
Let’s quickly set up a local PySpark environment.
1. Install PySpark:
pip install pyspark
2. Start a Spark session:
from pyspark.sql import SparkSession spark = SparkSession.builder \ .appName("PySparkSQLExample") \ .getOrCreate()
3. Create a DataFrame:
data = [("Alice", 25), ("Bob", 30), ("Clara", 35)] columns = ["Name", "Age"] df = spark.createDataFrame(data, columns) df.show()
4. Create a temporary view to run SQL queries:
df.createOrReplaceTempView("people")
Now you're ready to run SQL queries directly!
Basic PySpark SQL Queries
Let’s look at the most commonly used SQL queries in PySpark.
1. SELECT Query
spark.sql("SELECT * FROM people").show()
Returns all rows from the people table.
2. WHERE Clause (Filtering Rows)
spark.sql("SELECT * FROM people WHERE Age > 30").show()
Filters rows where Age is greater than 30.
3. Adding a Derived Column
spark.sql("SELECT Name, Age, Age + 5 AS AgeInFiveYears FROM people").show()
Adds a new column AgeInFiveYears by adding 5 to the current age.
4. GROUP BY and Aggregation
Let’s update the data with multiple entries for each name:
data2 = [("Alice", 25), ("Bob", 30), ("Alice", 28), ("Bob", 35), ("Clara", 35)] df2 = spark.createDataFrame(data2, columns) df2.createOrReplaceTempView("people")
Now apply aggregation:
spark.sql(""" SELECT Name, COUNT(*) AS Count, AVG(Age) AS AvgAge FROM people GROUP BY Name """).show()
This groups records by Name and calculates the number of records and average age.
5. JOIN Between Two Tables
Let’s create another table:
jobs_data = [("Alice", "Engineer"), ("Bob", "Designer"), ("Clara", "Manager")] df_jobs = spark.createDataFrame(jobs_data, ["Name", "Job"]) df_jobs.createOrReplaceTempView("jobs")
Now perform an inner join:
spark.sql(""" SELECT p.Name, p.Age, j.Job FROM people p JOIN jobs j ON p.Name = j.Name """).show()
This joins the people and jobs tables on the Name column.
Tips for Working Efficiently with PySpark SQL
Use LIMIT for testing: Avoid loading millions of rows in development.
Cache wisely: Use .cache() when a DataFrame is reused multiple times.
Check performance: Use .explain() to view the query execution plan.
Mix APIs: Combine SQL queries and DataFrame methods for flexibility.
Conclusion
PySpark SQL makes big data analysis in Python much more accessible. By combining the readability of SQL with the power of Spark, it allows developers and analysts to process massive datasets using simple, familiar syntax.
This blog covered the foundational aspects: setting up PySpark, writing basic SQL queries, performing joins and aggregations, and a few best practices to optimize your workflow.
If you're just starting out, keep experimenting with different queries, and try loading real-world datasets in formats like CSV or JSON. Mastering PySpark SQL can unlock a whole new level of data engineering and analysis at scale.
PySpark Training by AccentFuture
At AccentFuture, we offer customizable online training programs designed to help you gain practical, job-ready skills in the most in-demand technologies. Our PySpark Online Training will teach you everything you need to know, with hands-on training and real-world projects to help you excel in your career.
What we offer:
Hands-on training with real-world projects and 100+ use cases
Live sessions led by industry professionals
Certification preparation and career guidance
🚀 Enroll Now: https://www.accentfuture.com/enquiry-form/
📞 Call Us: +91–9640001789
📧 Email Us: [email protected]
🌐 Visit Us: AccentFuture
1 note
·
View note
Text
Top 8 Data Science Tools Everyone Should Know

In the dynamic world of data science, having the right tools at your disposal is crucial for success. From handling massive datasets to building sophisticated AI models, the data science ecosystem offers a plethora of powerful software and platforms. Whether you're a budding enthusiast or an experienced professional, mastering these top 8 data science tools will significantly enhance your capabilities.
1. Python: The Versatile Workhorse
Category: Exploratory Data Analysis, Data Modelling, Scripting, Automation
Why it's essential: Python's simplicity, extensive libraries (NumPy, Pandas, Scikit-learn, TensorFlow, PyTorch), and strong community support make it the go-to language for most data science tasks. From data manipulation and statistical analysis to building complex machine learning models, Python's versatility is unmatched.
2. R: The Statistical Maestro
Category: Exploratory Data Analysis, Data Modelling, Statistical Computing, Data Visualization
Why it's essential: R's strength lies in its rich collection of packages specifically designed for statistical analysis, econometric modelling, and creating publication-quality visualizations. It's a favorite among researchers and analysts in academic and industry settings.
3. SQL: The Data Whisperer (Data Storage & EDA)
Category: Data Storage, Exploratory Data Analysis
Why it's essential: SQL (Structured Query Language) is the fundamental language for interacting with relational databases, where a significant portion of business data resides. Mastering SQL allows you to efficiently extract, filter, and manipulate data for analysis and model building.
4. Apache Spark: Big Data Powerhouse (Data Storage & Modelling)
Category: Data Storage (for large datasets), Data Modelling (scalable machine learning)
Why it's essential: With the exponential growth of data, Spark has become indispensable for processing and analyzing large, distributed datasets. Its in-memory processing capabilities significantly speed up ETL (Extract, Transform, Load) operations and enable scalable machine learning.
5. Pandas (Python Library): Your Data Manipulation Hub (EDA)
Category: Exploratory Data Analysis
Why it's essential: Built on top of Python, Pandas provides powerful and easy-to-use data structures (DataFrames) for data manipulation, cleaning, and analysis. It's a cornerstone for any data scientist working with tabular data.
6. Scikit-learn (Python Library): The Machine Learning Toolkit (Data Modelling)
Category: Data Modelling
Why it's essential: Scikit-learn offers a comprehensive set of efficient tools for machine learning tasks, including classification, regression, clustering, dimensionality reduction, and model selection. Its user-friendly 1 API makes it a popular choice for both beginners and experienced practitioners.
7. Tableau/Power BI: Visualizing Insights (Data Visualization)
Category: Data Visualization
Why it's essential: Transforming raw data into compelling and understandable visualizations is crucial for communicating insights effectively. Tableau and Power BI are leading business intelligence tools widely used by organizations to create interactive dashboards and reports.
8. Matplotlib & Seaborn (Python Libraries): The Art of Data Representation (Data Visualization)
Category: Data Visualization
Why it's essential: For more granular control over visualizations within the Python ecosystem, Matplotlib and Seaborn are essential libraries. They allow data scientists to create customized charts and plots for exploratory analysis and presentations.
Level Up Your Data Science Prowess with Xaltius Academy's Data Science and AI Program:
To truly master these essential data science tools and thrive in the data-driven landscape, consider enrolling in Xaltius Academy's Data Science and AI program. Our comprehensive curriculum is designed to equip you with the practical skills and theoretical knowledge needed to excel.
Here's how our program empowers you:
Hands-on Training: Gain practical experience using Python, R, SQL, and visualization tools through real-world case studies and projects.
In-depth Coverage: Develop a strong understanding of data storage solutions, exploratory data analysis techniques, and various data modeling algorithms.
Focus on Industry Best Practices: Learn to leverage these tools effectively to solve real business challenges.
Expert Guidance: Benefit from instruction by experienced data scientists and AI professionals.
Career Support: Receive dedicated support to help you launch or advance your data science career.
Conclusion:
Mastering these top 8 data science tools will significantly enhance your ability to extract meaningful insights from data and drive impactful decisions in today's rapidly evolving technological landscape. Embrace these tools, continuously learn, and consider the comprehensive training offered by Xaltius Academy's Data Science and AI program to arm yourself for a successful data science journey.
0 notes
Text
Just wrapped up Module 5 of the #DEZoomcamp by @DataTalksClub! Here’s what I learned about Batch Processing :
1.Connecting Spark to Big Query 2. Setting up a Dataproc Cluster 3.Creating a Local Spark Cluster 4. Connecting Spark to Google Cloud Storage 5. Operations on Spark Resilient Distributed Datasets 6.Spark RDD mapPartition 7.Anatomy of a Spark Cluster 8.SQL with Spark 9. GroupBy and Joins in Spark 9.Spark Dataframes 10. First Look at Spark/PySpark and Batch Processing
0 notes
Text
Your Essential Guide to Python Libraries for Data Analysis
Here’s an essential guide to some of the most popular Python libraries for data analysis:
1. Pandas
- Overview: A powerful library for data manipulation and analysis, offering data structures like Series and DataFrames.
- Key Features:
- Easy handling of missing data
- Flexible reshaping and pivoting of datasets
- Label-based slicing, indexing, and subsetting of large datasets
- Support for reading and writing data in various formats (CSV, Excel, SQL, etc.)
2. NumPy
- Overview: The foundational package for numerical computing in Python. It provides support for large multi-dimensional arrays and matrices.
- Key Features:
- Powerful n-dimensional array object
- Broadcasting functions to perform operations on arrays of different shapes
- Comprehensive mathematical functions for array operations
3. Matplotlib
- Overview: A plotting library for creating static, animated, and interactive visualizations in Python.
- Key Features:
- Extensive range of plots (line, bar, scatter, histogram, etc.)
- Customization options for fonts, colors, and styles
- Integration with Jupyter notebooks for inline plotting
4. Seaborn
- Overview: Built on top of Matplotlib, Seaborn provides a high-level interface for drawing attractive statistical graphics.
- Key Features:
- Simplified syntax for complex visualizations
- Beautiful default themes for visualizations
- Support for statistical functions and data exploration
5. SciPy
- Overview: A library that builds on NumPy and provides a collection of algorithms and high-level commands for mathematical and scientific computing.
- Key Features:
- Modules for optimization, integration, interpolation, eigenvalue problems, and more
- Tools for working with linear algebra, Fourier transforms, and signal processing
6. Scikit-learn
- Overview: A machine learning library that provides simple and efficient tools for data mining and data analysis.
- Key Features:
- Easy-to-use interface for various algorithms (classification, regression, clustering)
- Support for model evaluation and selection
- Preprocessing tools for transforming data
7. Statsmodels
- Overview: A library that provides classes and functions for estimating and interpreting statistical models.
- Key Features:
- Support for linear regression, logistic regression, time series analysis, and more
- Tools for statistical tests and hypothesis testing
- Comprehensive output for model diagnostics
8. Dask
- Overview: A flexible parallel computing library for analytics that enables larger-than-memory computing.
- Key Features:
- Parallel computation across multiple cores or distributed systems
- Integrates seamlessly with Pandas and NumPy
- Lazy evaluation for optimized performance
9. Vaex
- Overview: A library designed for out-of-core DataFrames that allows you to work with large datasets (billions of rows) efficiently.
- Key Features:
- Fast exploration of big data without loading it into memory
- Support for filtering, aggregating, and joining large datasets
10. PySpark
- Overview: The Python API for Apache Spark, allowing you to leverage the capabilities of distributed computing for big data processing.
- Key Features:
- Fast processing of large datasets
- Built-in support for SQL, streaming data, and machine learning
Conclusion
These libraries form a robust ecosystem for data analysis in Python. Depending on your specific needs—be it data manipulation, statistical analysis, or visualization—you can choose the right combination of libraries to effectively analyze and visualize your data. As you explore these libraries, practice with real datasets to reinforce your understanding and improve your data analysis skills!
1 note
·
View note
Text
BigQuery Studio From Google Cloud Accelerates AI operations

Google Cloud is well positioned to provide enterprises with a unified, intelligent, open, and secure data and AI cloud. Dataproc, Dataflow, BigQuery, BigLake, and Vertex AI are used by thousands of clients in many industries across the globe for data-to-AI operations. From data intake and preparation to analysis, exploration, and visualization to ML training and inference, it presents BigQuery Studio, a unified, collaborative workspace for Google Cloud’s data analytics suite that speeds up data to AI workflows. It enables data professionals to:
Utilize BigQuery’s built-in SQL, Python, Spark, or natural language capabilities to leverage code assets across Vertex AI and other products for specific workflows.
Improve cooperation by applying best practices for software development, like CI/CD, version history, and source control, to data assets.
Enforce security standards consistently and obtain governance insights within BigQuery by using data lineage, profiling, and quality.
The following features of BigQuery Studio assist you in finding, examining, and drawing conclusions from data in BigQuery:
Code completion, query validation, and byte processing estimation are all features of this powerful SQL editor.
Colab Enterprise-built embedded Python notebooks. Notebooks come with built-in support for BigQuery DataFrames and one-click Python development runtimes.
You can create stored Python procedures for Apache Spark using this PySpark editor.
Dataform-based asset management and version history for code assets, including notebooks and stored queries.
Gemini generative AI (Preview)-based assistive code creation in notebooks and the SQL editor.
Dataplex includes for data profiling, data quality checks, and data discovery.
The option to view work history by project or by user.
The capability of exporting stored query results for use in other programs and analyzing them by linking to other tools like Looker and Google Sheets.
Follow the guidelines under Enable BigQuery Studio for Asset Management to get started with BigQuery Studio. The following APIs are made possible by this process:
To use Python functions in your project, you must have access to the Compute Engine API.
Code assets, such as notebook files, must be stored via the Dataform API.
In order to run Colab Enterprise Python notebooks in BigQuery, the Vertex AI API is necessary.
Single interface for all data teams
Analytics experts must use various connectors for data intake, switch between coding languages, and transfer data assets between systems due to disparate technologies, which results in inconsistent experiences. The time-to-value of an organization’s data and AI initiatives is greatly impacted by this.
By providing an end-to-end analytics experience on a single, specially designed platform, BigQuery Studio tackles these issues. Data engineers, data analysts, and data scientists can complete end-to-end tasks like data ingestion, pipeline creation, and predictive analytics using the coding language of their choice with its integrated workspace, which consists of a notebook interface and SQL (powered by Colab Enterprise, which is in preview right now).
For instance, data scientists and other analytics users can now analyze and explore data at the petabyte scale using Python within BigQuery in the well-known Colab notebook environment. The notebook environment of BigQuery Studio facilitates data querying and transformation, autocompletion of datasets and columns, and browsing of datasets and schema. Additionally, Vertex AI offers access to the same Colab Enterprise notebook for machine learning operations including MLOps, deployment, and model training and customisation.
Additionally, BigQuery Studio offers a single pane of glass for working with structured, semi-structured, and unstructured data of all types across cloud environments like Google Cloud, AWS, and Azure by utilizing BigLake, which has built-in support for Apache Parquet, Delta Lake, and Apache Iceberg.
One of the top platforms for commerce, Shopify, has been investigating how BigQuery Studio may enhance its current BigQuery environment.
Maximize productivity and collaboration
By extending software development best practices like CI/CD, version history, and source control to analytics assets like SQL scripts, Python scripts, notebooks, and SQL pipelines, BigQuery Studio enhances cooperation among data practitioners. To ensure that their code is always up to date, users will also have the ability to safely link to their preferred external code repositories.
BigQuery Studio not only facilitates human collaborations but also offers an AI-powered collaborator for coding help and contextual discussion. BigQuery’s Duet AI can automatically recommend functions and code blocks for Python and SQL based on the context of each user and their data. The new chat interface eliminates the need for trial and error and document searching by allowing data practitioners to receive specialized real-time help on specific tasks using natural language.
Unified security and governance
By assisting users in comprehending data, recognizing quality concerns, and diagnosing difficulties, BigQuery Studio enables enterprises to extract reliable insights from reliable data. To assist guarantee that data is accurate, dependable, and of high quality, data practitioners can profile data, manage data lineage, and implement data-quality constraints. BigQuery Studio will reveal tailored metadata insights later this year, such as dataset summaries or suggestions for further investigation.
Additionally, by eliminating the need to copy, move, or exchange data outside of BigQuery for sophisticated workflows, BigQuery Studio enables administrators to consistently enforce security standards for data assets. Policies are enforced for fine-grained security with unified credential management across BigQuery and Vertex AI, eliminating the need to handle extra external connections or service accounts. For instance, Vertex AI’s core models for image, video, text, and language translations may now be used by data analysts for tasks like sentiment analysis and entity discovery over BigQuery data using straightforward SQL in BigQuery, eliminating the need to share data with outside services.
Read more on Govindhtech.com
#BigQueryStudio#BigLake#AIcloud#VertexAI#BigQueryDataFrames#generativeAI#ApacheSpark#MLOps#news#technews#technology#technologynews#technologytrends#govindhtech
0 notes
Text
What is PySpark? A Beginner’s Guide
Introduction
The digital era gives rise to continuous expansion in data production activities. Organizations and businesses need processing systems with enhanced capabilities to process large data amounts efficiently. Large datasets receive poor scalability together with slow processing speed and limited adaptability from conventional data processing tools. PySpark functions as the data processing solution that brings transformation to operations.
The Python Application Programming Interface called PySpark serves as the distributed computing framework of Apache Spark for fast processing of large data volumes. The platform offers a pleasant interface for users to operate analytics on big data together with real-time search and machine learning operations. Data engineering professionals along with analysts and scientists prefer PySpark because the platform combines Python's flexibility with Apache Spark's processing functions.
The guide introduces the essential aspects of PySpark while discussing its fundamental elements as well as explaining operational guidelines and hands-on usage. The article illustrates the operation of PySpark through concrete examples and predicted outputs to help viewers understand its functionality better.
What is PySpark?
PySpark is an interface that allows users to work with Apache Spark using Python. Apache Spark is a distributed computing framework that processes large datasets in parallel across multiple machines, making it extremely efficient for handling big data. PySpark enables users to leverage Spark’s capabilities while using Python’s simple and intuitive syntax.
There are several reasons why PySpark is widely used in the industry. First, it is highly scalable, meaning it can handle massive amounts of data efficiently by distributing the workload across multiple nodes in a cluster. Second, it is incredibly fast, as it performs in-memory computation, making it significantly faster than traditional Hadoop-based systems. Third, PySpark supports Python libraries such as Pandas, NumPy, and Scikit-learn, making it an excellent choice for machine learning and data analysis. Additionally, it is flexible, as it can run on Hadoop, Kubernetes, cloud platforms, or even as a standalone cluster.
Core Components of PySpark
PySpark consists of several core components that provide different functionalities for working with big data:
RDD (Resilient Distributed Dataset) – The fundamental unit of PySpark that enables distributed data processing. It is fault-tolerant and can be partitioned across multiple nodes for parallel execution.
DataFrame API – A more optimized and user-friendly way to work with structured data, similar to Pandas DataFrames.
Spark SQL – Allows users to query structured data using SQL syntax, making data analysis more intuitive.
Spark MLlib – A machine learning library that provides various ML algorithms for large-scale data processing.
Spark Streaming – Enables real-time data processing from sources like Kafka, Flume, and socket streams.
How PySpark Works
1. Creating a Spark Session
To interact with Spark, you need to start a Spark session.

Output:

2. Loading Data in PySpark
PySpark can read data from multiple formats, such as CSV, JSON, and Parquet.

Expected Output (Sample Data from CSV):

3. Performing Transformations
PySpark supports various transformations, such as filtering, grouping, and aggregating data. Here’s an example of filtering data based on a condition.

Output:

4. Running SQL Queries in PySpark
PySpark provides Spark SQL, which allows you to run SQL-like queries on DataFrames.

Output:
5. Creating a DataFrame Manually
You can also create a PySpark DataFrame manually using Python lists.

Output:

Use Cases of PySpark
PySpark is widely used in various domains due to its scalability and speed. Some of the most common applications include:
Big Data Analytics – Used in finance, healthcare, and e-commerce for analyzing massive datasets.
ETL Pipelines – Cleans and processes raw data before storing it in a data warehouse.
Machine Learning at Scale – Uses MLlib for training and deploying machine learning models on large datasets.
Real-Time Data Processing – Used in log monitoring, fraud detection, and predictive analytics.
Recommendation Systems – Helps platforms like Netflix and Amazon offer personalized recommendations to users.
Advantages of PySpark
There are several reasons why PySpark is a preferred tool for big data processing. First, it is easy to learn, as it uses Python’s simple and intuitive syntax. Second, it processes data faster due to its in-memory computation. Third, PySpark is fault-tolerant, meaning it can automatically recover from failures. Lastly, it is interoperable and can work with multiple big data platforms, cloud services, and databases.
Getting Started with PySpark
Installing PySpark
You can install PySpark using pip with the following command:

To use PySpark in a Jupyter Notebook, install Jupyter as well:

To start PySpark in a Jupyter Notebook, create a Spark session:

Conclusion
PySpark is an incredibly powerful tool for handling big data analytics, machine learning, and real-time processing. It offers scalability, speed, and flexibility, making it a top choice for data engineers and data scientists. Whether you're working with structured data, large-scale machine learning models, or real-time data streams, PySpark provides an efficient solution.
With its integration with Python libraries and support for distributed computing, PySpark is widely used in modern big data applications. If you’re looking to process massive datasets efficiently, learning PySpark is a great step forward.
youtube
#pyspark training#pyspark coutse#apache spark training#apahe spark certification#spark course#learn apache spark#apache spark course#pyspark certification#hadoop spark certification .#Youtube
0 notes
Text

Separei os 5 melhores projetos nossos Todos são gratuitos e estão em nosso Youtube 1) Como criar do ZERO um Lakehouse (Nota 9.94): Quer dominar conceitos como Lake House, Data Mesh e arquitetura de dados? Neste workshop, Nilton traz para você a palestra de destaque que conquistou os maiores eventos de Data & AI no Brasil. Aproveite a oportunidade para se atualizar sobre as tendências discutidas pelas principais lideranças do setor! Participação Nilton Kazuyuki U. https://lnkd.in/dRM8eaXj 2) Qualidade de dados em ETL com Pandera (Nota 9.80): Pandera é uma biblioteca para validação de dados em pipelines ETL, permitindo definir e aplicar regras de validação em DataFrames do Pandas (Spark) para garantir a integridade e qualidade dos dados. Participação do Renan Heckert https://lnkd.in/dKCeF_vv 3) DW completo com SQL, Airflow, dbt e Airbyte (Nota 9.78): Desenvolva um Data Warehouse completo utilizando SQL para manipulação de dados, Airflow para orquestração de workflows, dbt para transformação de dados e Airbyte para integração de dados. Participação da lenda Marc Lamberti https://lnkd.in/dbPQmxMs 4) Crie pipelines CI/CD com dbt e GitHub Actions (Nota 9.77): Aprenda a configurar pipelines de Integração e Entrega Contínua (CI/CD) utilizando dbt e GitHub Actions, automatizando testes, deploys e garantindo a qualidade do código em projetos de dados. Participação do Bruno Souza de Lima https://lnkd.in/ddYWa5xP 5) Pipeline Black Friday com Python, SQL e AI: Dias 8, 9 e 10 de Outubro às 20h. Prepare-se para aumentar suas vendas da Black Friday com uma pipeline de dados completa! Ao longo de três dias, você aprenderá a extrair, transformar e carregar dados, utilizando Python, SQL, DBT e Inteligência Artificial. Esta é uma oportunidade única para dominar as ferramentas essenciais para automação e otimização de processos de vendas. Já curte e se inscreve no canal para não perder Participação do Fabio Cantarim Melo https://lnkd.in/dYwzHiY5
0 notes
Text
Big Data vs. Traditional Data: Understanding the Differences and When to Use Python

In the evolving landscape of data science, understanding the nuances between big data and traditional data is crucial. Both play pivotal roles in analytics, but their characteristics, processing methods, and use cases differ significantly. Python, a powerful and versatile programming language, has become an indispensable tool for handling both types of data. This blog will explore the differences between big data and traditional data and explain when to use Python, emphasizing the importance of enrolling in a data science training program to master these skills.
What is Traditional Data?
Traditional data refers to structured data typically stored in relational databases and managed using SQL (Structured Query Language). This data is often transactional and includes records such as sales transactions, customer information, and inventory levels.
Characteristics of Traditional Data:
Structured Format: Traditional data is organized in a structured format, usually in rows and columns within relational databases.
Manageable Volume: The volume of traditional data is relatively small and manageable, often ranging from gigabytes to terabytes.
Fixed Schema: The schema, or structure, of traditional data is predefined and consistent, making it easy to query and analyze.
Use Cases of Traditional Data:
Transaction Processing: Traditional data is used for transaction processing in industries like finance and retail, where accurate and reliable records are essential.
Customer Relationship Management (CRM): Businesses use traditional data to manage customer relationships, track interactions, and analyze customer behavior.
Inventory Management: Traditional data is used to monitor and manage inventory levels, ensuring optimal stock levels and efficient supply chain operations.
What is Big Data?
Big data refers to extremely large and complex datasets that cannot be managed and processed using traditional database systems. It encompasses structured, unstructured, and semi-structured data from various sources, including social media, sensors, and log files.
Characteristics of Big Data:
Volume: Big data involves vast amounts of data, often measured in petabytes or exabytes.
Velocity: Big data is generated at high speed, requiring real-time or near-real-time processing.
Variety: Big data comes in diverse formats, including text, images, videos, and sensor data.
Veracity: Big data can be noisy and uncertain, requiring advanced techniques to ensure data quality and accuracy.
Use Cases of Big Data:
Predictive Analytics: Big data is used for predictive analytics in fields like healthcare, finance, and marketing, where it helps forecast trends and behaviors.
IoT (Internet of Things): Big data from IoT devices is used to monitor and analyze physical systems, such as smart cities, industrial machines, and connected vehicles.
Social Media Analysis: Big data from social media platforms is analyzed to understand user sentiments, trends, and behavior patterns.
Python: The Versatile Tool for Data Science
Python has emerged as the go-to programming language for data science due to its simplicity, versatility, and robust ecosystem of libraries and frameworks. Whether dealing with traditional data or big data, Python provides powerful tools and techniques to analyze and visualize data effectively.
Python for Traditional Data:
Pandas: The Pandas library in Python is ideal for handling traditional data. It offers data structures like DataFrames that facilitate easy manipulation, analysis, and visualization of structured data.
SQLAlchemy: Python's SQLAlchemy library provides a powerful toolkit for working with relational databases, allowing seamless integration with SQL databases for querying and data manipulation.
Python for Big Data:
PySpark: PySpark, the Python API for Apache Spark, is designed for big data processing. It enables distributed computing and parallel processing, making it suitable for handling large-scale datasets.
Dask: Dask is a flexible parallel computing library in Python that scales from single machines to large clusters, making it an excellent choice for big data analytics.
When to Use Python for Data Science
Understanding when to use Python for different types of data is crucial for effective data analysis and decision-making.
Traditional Data:
Business Analytics: Use Python for traditional data analytics in business scenarios, such as sales forecasting, customer segmentation, and financial analysis. Python's libraries, like Pandas and Matplotlib, offer comprehensive tools for these tasks.
Data Cleaning and Transformation: Python is highly effective for data cleaning and transformation, ensuring that traditional data is accurate, consistent, and ready for analysis.
Big Data:
Real-Time Analytics: When dealing with real-time data streams from IoT devices or social media platforms, Python's integration with big data frameworks like Apache Spark enables efficient processing and analysis.
Large-Scale Machine Learning: For large-scale machine learning projects, Python's compatibility with libraries like TensorFlow and PyTorch, combined with big data processing tools, makes it an ideal choice.
The Importance of Data Science Training Programs
To effectively navigate the complexities of both traditional data and big data, it is essential to acquire the right skills and knowledge. Data science training programs provide comprehensive education and hands-on experience in data science tools and techniques.
Comprehensive Curriculum: Data science training programs cover a wide range of topics, including data analysis, machine learning, big data processing, and data visualization, ensuring a well-rounded education.
Practical Experience: These programs emphasize practical learning through projects and case studies, allowing students to apply theoretical knowledge to real-world scenarios.
Expert Guidance: Experienced instructors and industry mentors offer valuable insights and support, helping students master the complexities of data science.
Career Opportunities: Graduates of data science training programs are in high demand across various industries, with opportunities to work on innovative projects and drive data-driven decision-making.
Conclusion
Understanding the differences between big data and traditional data is fundamental for any aspiring data scientist. While traditional data is structured, manageable, and used for transaction processing, big data is vast, varied, and requires advanced tools for real-time processing and analysis. Python, with its robust ecosystem of libraries and frameworks, is an indispensable tool for handling both types of data effectively.
Enrolling in a data science training program equips you with the skills and knowledge needed to navigate the complexities of data science. Whether you're working with traditional data or big data, mastering Python and other data science tools will enable you to extract valuable insights and drive innovation in your field. Start your journey today and unlock the potential of data science with a comprehensive training program.
#Big Data#Traditional Data#Data Science#Python Programming#Data Analysis#Machine Learning#Predictive Analytics#Data Science Training Program#SQL#Data Visualization#Business Analytics#Real-Time Analytics#IoT Data#Data Transformation
0 notes
Text
[Fabric] Leer PowerBi data con Notebooks - Semantic Link
El nombre del artículo puede sonar extraño puesto que va en contra del flujo de datos que muchos arquitectos pueden pensar para el desarrollo de soluciones. Sin embargo, las puertas a nuevos modos de conectividad entre herramientas y conjuntos de datos pueden ayudarnos a encontrar nuevos modos que fortalezcan los análisis de datos.
En este post vamos a mostrar dos sencillos modos que tenemos para leer datos de un Power Bi Semantic Model desde un Fabric Notebook con Python y SQL.
¿Qué son los Semantic Links? (vínculo semántico)
Como nos gusta hacer aquí en LaDataWeb, comencemos con un poco de teoría de la fuente directa.
Definición Microsoft: Vínculo semántico es una característica que permite establecer una conexión entre modelos semánticos y Ciencia de datos de Synapse en Microsoft Fabric. El uso del vínculo semántico solo se admite en Microsoft Fabric.
Dicho en criollo, nos facilita la conectividad de datos para simplificar el acceso a información. Si bién Microsoft lo enfoca como una herramienta para Científicos de datos, no veo porque no puede ser usada por cualquier perfil que tenga en mente la resolución de un problema leyendo datos limpios de un modelo semántico.
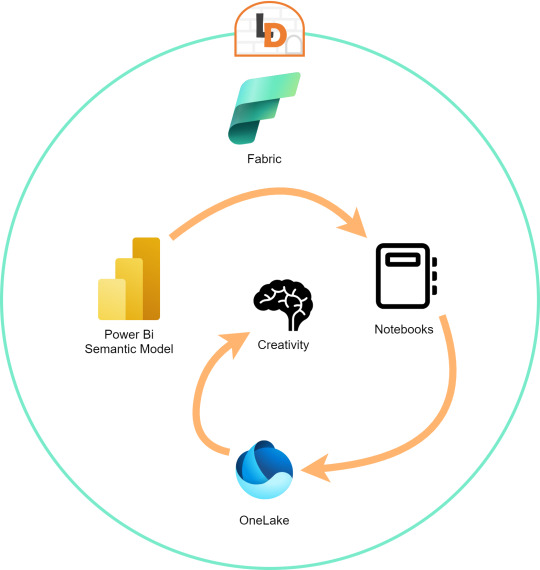
El límite será nuestra creatividad para resolver problemas que se nos presenten para responder o construir entorno a la lectura de estos modelos con notebooks que podrían luego volver a almacenarse en Onelake con un nuevo procesamiento enfocado en la solución.
Semantic Links ofrecen conectividad de datos con el ecosistema de Pandas de Python a través de la biblioteca de Python SemPy. SemPy proporciona funcionalidades que incluyen la recuperación de datos de tablas , cálculo de medidas y ejecución de consultas DAX y metadatos.
Para usar la librería primero necesitamos instalarla:
%pip install semantic-link
Lo primero que podríamos hacer es ver los modelos disponibles:
import sempy.fabric as fabric df_datasets = fabric.list_datasets()
Entrando en más detalle, también podemos listar las tablas de un modelo:
df_tables = fabric.list_tables("Nombre Modelo Semantico", include_columns=True)
Cuando ya estemos seguros de lo que necesitamos, podemos leer una tabla puntual:
df_table = fabric.read_table("Nombre Modelo Semantico", "Nombre Tabla")
Esto genera un FabricDataFrame con el cual podemos trabajar libremente.
Nota: FabricDataFrame es la estructura de datos principal de vínculo semántico. Realiza subclases de DataFrame de Pandas y agrega metadatos, como información semántica y linaje
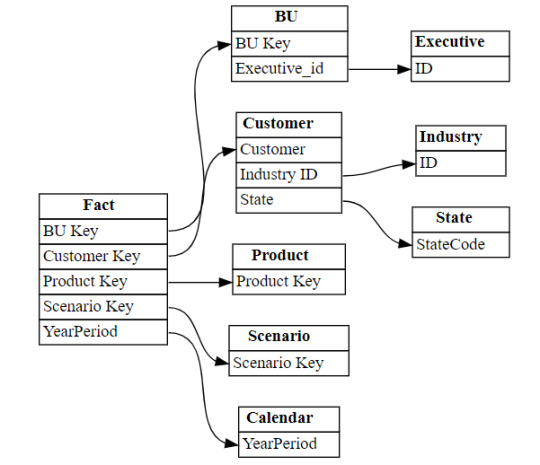
Existen varias funciones que podemos investigar usando la librería. Una de las favoritas es la que nos permite entender las relaciones entre tablas. Podemos obtenerlas y luego usar otro apartado de la librería para plotearlo:
from sempy.relationships import plot_relationship_metadata relationships = fabric.list_relationships("Nombre Modelo Semantico") plot_relationship_metadata(relationships)
Un ejemplo de la respuesta:
Conector Nativo Semantic Link Spark
Adicional a la librería de Python para trabajar con Pandas, la característica nos trae un conector nativo para usar con Spark. El mismo permite a los usuarios de Spark acceder a las tablas y medidas de Power BI. El conector es independiente del lenguaje y admite PySpark, Spark SQL, R y Scala. Veamos lo simple que es usarlo:
spark.conf.set("spark.sql.catalog.pbi", "com.microsoft.azure.synapse.ml.powerbi.PowerBICatalog")
Basta con especificar esa línea para pronto nutrirnos de clásico SQL. Listamos tablas de un modelo:
%%sql SHOW TABLES FROM pbi.`Nombre Modelo Semantico`
Consulta a una tabla puntual:
%%sql SELECT * FROM pbi.`Nombre Modelo Semantico`.NombreTabla
Así de simple podemos ejecutar SparkSQL para consultar el modelo. En este caso es importante la participación del caracter " ` " comilla invertida que nos ayuda a leer espacios y otros caracteres.
Exploración con DAX
Como un tercer modo de lectura de datos incorporaron la lectura basada en DAX. Esta puede ayudarnos de distintas maneras, por ejemplo guardando en nuestro FabricDataFrame el resultado de una consulta:
df_dax = fabric.evaluate_dax( "Nombre Modelo Semantico", """ EVALUATE SUMMARIZECOLUMNS( 'State'[Region], 'Calendar'[Year], 'Calendar'[Month], "Total Revenue" , CALCULATE([Total Revenue] ) ) """ )
Otra manera es utilizando DAX puramente para consultar al igual que lo haríamos con SQL. Para ello, Fabric incorporó una nueva y poderosa etiqueta que lo facilita. Delimitación de celdas tipo "%%dax":
%%dax "Nombre Modelo Semantico" -w "Area de Trabajo" EVALUATE SUMMARIZECOLUMNS( 'State'[Region], 'Calendar'[Year], 'Calendar'[Month], "Total Revenue" , CALCULATE([Total Revenue] ) )
Hasta aquí llegamos con esos tres modos de leer datos de un Power Bi Semantic Model utilizando Fabric Notebooks. Espero que esto les revuelva la cabeza para redescubrir soluciones a problemas con un nuevo enfoque.
#fabric#fabric tips#fabric tutorial#fabric training#fabric notebooks#python#pandas#spark#power bi#powerbi#fabric argentina#fabric cordoba#fabric jujuy#ladataweb#microsoft fabric#SQL#dax
0 notes
Text
Mastering Data Transformation: Understanding Big Data Transformation Tools
In today's data-driven world, the ability to transform raw data into meaningful insights is paramount. This process, known as data transformation, is crucial for extracting value from vast amounts of information. Whether you're a data scientist, business analyst, or IT professional, understanding data transformation and the tools available is essential. In this blog, we'll delve into what data transformation entails, explore some of the leading big data transformation tools, and discuss their importance in modern analytics.

What is Data Transformation?
Data transformation involves converting data from one format or structure into another to prepare it for analysis, storage, or presentation. This process is fundamental as raw data often comes in disparate formats, lacks consistency, or requires aggregation before meaningful insights can be extracted. Key tasks in data transformation include:
Cleaning and Validation: Identifying and rectifying errors, inconsistencies, or missing values in the data.
Normalization: Ensuring data conforms to a standard format or structure.
Aggregation: Combining data from multiple sources into a single dataset for analysis.
Integration: Merging different datasets to create a comprehensive view.
Data transformation ensures that data is accurate, reliable, and ready for analysis, enabling organizations to make informed decisions based on trustworthy information.
Importance of Data Transformation
Effective data transformation is critical for several reasons:
Enhanced Data Quality: By cleaning and standardizing data, organizations can trust the accuracy of their analytics.
Improved Decision-Making: Transformed data provides insights that drive strategic decisions and operational improvements.
Operational Efficiency: Automation of transformation processes reduces manual effort and speeds up analysis.
Regulatory Compliance: Ensuring data meets regulatory requirements through proper transformation processes.
Big Data Transformation Tools
As data volumes continue to grow exponentially, traditional methods of data transformation struggle to keep pace. Big data transformation tools are designed to handle the complexities and scale of modern datasets efficiently. Let's explore some prominent tools in this space:
1. Apache Spark
Apache Spark is a powerful open-source framework for distributed data processing. It provides libraries for various tasks including SQL, machine learning, graph processing, and streaming. Spark's DataFrame API facilitates scalable data transformation operations such as filtering, aggregating, and joining datasets. Its in-memory processing capability makes it suitable for handling large-scale data transformation tasks with speed and efficiency.
2. Apache Hadoop
Apache Hadoop is another widely used framework for distributed storage and processing of large datasets. It includes components like HDFS (Hadoop Distributed File System) for storage and MapReduce for parallel processing of data. Hadoop ecosystem tools such as Apache Hive and Apache Pig enable data transformation tasks through high-level query languages (HiveQL and Pig Latin) that abstract complex processing tasks into simpler commands.
3. Talend
Talend is an open-source data integration platform that offers capabilities for data transformation, data integration, and data quality. It provides a graphical interface for designing data transformation workflows, making it accessible to users with varying technical backgrounds. Talend supports integration with various data sources and targets, including cloud-based solutions, making it a versatile choice for organizations looking to streamline their data transformation processes.
4. Informatica PowerCenter
Informatica PowerCenter is a leading enterprise data integration platform that includes robust data transformation capabilities. It supports both traditional on-premises and cloud-based data integration scenarios, offering features such as data profiling, cleansing, and transformation. PowerCenter's visual development environment allows developers to design complex data transformation workflows using a drag-and-drop interface, enhancing productivity and reducing time-to-insight.
5. Apache NiFi
Apache NiFi is an easy-to-use, powerful data integration and dataflow automation tool that excels in handling real-time data streams. It provides a visual interface for designing data pipelines and supports data transformation tasks through a variety of processors. NiFi's flow-based programming model allows for the creation of complex data transformation workflows with built-in support for scalability and fault tolerance.
Choosing the Right Tool
Selecting the right big data transformation tool depends on various factors such as:
Scalability: Ability to handle large volumes of data efficiently.
Ease of Use: Intuitive interfaces that streamline development and maintenance.
Integration Capabilities: Support for diverse data sources and destinations.
Performance: Processing speed and optimization for different types of transformations.
Organizations should evaluate their specific requirements and infrastructure considerations when choosing a tool that aligns with their data transformation needs.
Conclusion
In conclusion, data transformation is a cornerstone of modern analytics, enabling organizations to derive valuable insights from their data assets. Big data transformation tools play a crucial role in simplifying and scaling this process, allowing businesses to process large volumes of data efficiently and effectively. Whether leveraging Apache Spark's distributed computing power or Talend's intuitive interface, choosing the right tool is essential for maximizing the value of data transformation efforts. As data continues to grow in complexity and volume, investing in robust data transformation tools will be key to staying competitive in the digital era.
By mastering data transformation and harnessing the capabilities of big data transformation tools, organizations can unlock the full potential of their data assets and drive innovation across industries.
0 notes
Link
0 notes