#Chart Patterns Trading
Explore tagged Tumblr posts
Visit Tumblr Blog
Explore Tumblr blogs with no restrictions, modern design and the best experience.
Last Seen Tumblr Blogs


Fun Fact
China blocked Tumblr because of pornography and censorship problems in 2013.
Text
Trading The Head & Shoulder Pattern
By the end of this post, you will have complete knowledge on how to trade the head and shoulders pattern. The head and shoulders pattern is a popular technical analysis pattern used by traders to identify potential trend reversals. It consists of three peaks: a higher peak (head) between two lower peaks (shoulders). The pattern resembles a human head and shoulders and is considered a reversal…

View On WordPress
#Bearish Reversal#Bullish Reversal#candlestick patterns#Chart Analysis#Chart Patterns Trading#Head and Shoulders#Head and Shoulders Pattern#Market Trends#Price Action Patterns#Price Patterns#reversal patterns#Shoulder Formation#Stock Chart Patterns#Stock Market Patterns#Stock Trading Signals#technical analysis#Technical Chart Analysis#Technical Indicators#Trading Strategies#Trend Reversal
0 notes
Text
Best Online Trading Platform - Flows Trading

Flows Trading is an best online trading platform designed to enhance traders' decision-making and performance. It offers over 100 technical indicators and drawing tools, customizable charting layouts, and real-time market data, allowing for precise technical analysis.
The platform includes a comprehensive trading journal that automatically logs trades and performance metrics, helping users identify strengths and weaknesses.
Additionally, Flows Trading supports programmable custom indicators through a simple scripting language, enabling traders to create and backtest their own indicators.
#best online trading platform#online trading#flows trading#share market#share market analysis#chart patterns
2 notes
·
View notes
Text
:/ turns out i haven't bothered to learn anything for piano in THREE YEARS oh no................
#rubia speaks#it's not that big of a deal like i haven't really craved to play piano or else i would have#and when i feel like playing an instrument i prefer to play guitar. or sometimes ukulele#but not being able to play piano skillfully feels like a failing to me. i felt the same way before i took up crochet again#years ago i got it in my mind that i have to be jack of all trades proficient at all#as if it's.... not enough to do well all of the things i already do well? it's overcompensatory for sure.#i would be in awe of someone with even a quarter of the skills i have but because it's me i feel like i have to make up for being me#by being good at more things#but my knowledge is only at the depth of parlor tricks. i can play a song and a half. i can make a square or a border#but if i have to read complex sheet music or any crochet chart or written pattern my illusion of knowledge crumbles to dust#i might like to take up piano again though at some point. if only to finish learning Goodbye Yellow Brick Road#i was getting kind of fine at playing it. i'm a little bit sad i stopped#(and i do intend to learn more crochet 100%. someday i will learn more things for it)
2 notes
·
View notes
Text
Importance of chart analysis for equity investments
Image by freepik Chart analysis, or technical analysis, can be quite helpful for equity investment in the Indian stock market. Here are several reasons why it is beneficial: Benefits of Chart Analysis in the Indian Stock Market 1.Trend Identification The Indian stock market, like any other, exhibits trends over time. Chart analysis helps in identifying these trends, allowing investors to ride…
#chart analysis#equity investment#Financial Markets#Indian stock market#investment strategies#market analysis#Market Sentiment#Stock Charts#Stock Market#Stock Trading#Support and Resistance#Technical Analysis#Technical Indicators#Trading Patterns#Trend Identification#Volume Analysis
3 notes
·
View notes
Text
Technical Analysis in a Nutshell
Technical analysis is a method used to evaluate and forecast the price movements of financial instruments, such as stocks, commodities, and currencies, by analyzing historical price data and trading volumes. Unlike fundamental analysis, which focuses on a company’s financial health, technical analysis relies on patterns, trends, and statistical indicators to make trading decisions. This article…
#Bollinger Bands#Chart Patterns#Divergence#Entry and Exit Points#Exponential Moving Average#Financial Markets#Fundamental Analysis#MACD#Market Movements#Moving Average#Moving Average Convergence Divergence#Oversold Conditions#Position Sizing#Price Charts#Price Movement#Price Movements#Relative Strength#Risk Management#RSI#Security#Stop-Loss#Support And Resistance#Technical Analysis#Trading Decisions#Trading Strategies#Trading Volume#Trend Lines#Volatility
2 notes
·
View notes
Text
Why Every Trader Should Learn Multiple Charts Pattern Analysis

In the dynamic world of trading, patterns are more than just lines and shapes on a chart—they are visual representations of market psychology, a roadmap to potential price movement. For traders looking to enhance their market analysis and decision-making skills, learning Multiple Charts Pattern analysis is not just beneficial—it’s essential.
Whether you're new to trading or a seasoned market participant, understanding various chart patterns can dramatically improve your success rate. This article explores why every trader should learn Multiple Charts Pattern analysis and how this skill forms the foundation of profitable trading strategies.
The Power of Patterns in Trading
Each chart pattern captures the interplay of buyer and seller psychology, offering a glimpse into market sentiment. These patterns, when correctly interpreted, can signal whether the market is likely to continue its current direction or reverse course. Patterns such as head and shoulders, double tops and bottoms, triangles, flags, and wedges provide traders with clear entry and exit signals.
However, relying on just one or two familiar patterns can limit your potential. The complexity of markets is reflected in the diverse and intricate patterns they produce. That’s why it’s important to learn Multiple Charts Pattern analysis—to broaden your perspective and increase your adaptability in different market conditions.
What is Multiple Charts Pattern Analysis?
Multiple Charts Pattern Analysis is the practice of studying and recognizing a wide range of technical chart patterns across various timeframes and market scenarios. Rather than focusing solely on one chart type or timeframe, traders analyze different patterns from candlestick charts, bar charts, line charts, and more. They also explore these patterns across daily, weekly, and intraday time frames to get a comprehensive view of market behavior.
This approach helps traders spot potential setups with greater accuracy, avoid false signals, and align their trades with the broader market trend.
Benefits of Learning Multiple Charts Pattern Analysis
Improved Decision Making: When you learn Multiple Charts Pattern techniques, you gain a structured way to interpret market data. This leads to better, faster decision-making and increased confidence in your trades.
Greater Flexibility in Trading Strategies: Not all markets move the same way. By mastering different chart patterns, you can adapt your trading strategy to suit trending, ranging, or volatile markets.
Reduced Emotional Trading: Fear and greed can cloud judgment, leading traders to act on impulse rather than logic. A solid understanding of chart patterns adds discipline to your trading, helping you rely on logic and analysis instead of gut feelings.
Enhanced Risk Management: Most chart patterns come with well-defined areas for placing stop-loss and take-profit orders. This clarity allows for better risk-reward setups, keeping losses small and maximizing potential gains.
How to Start Learning Multiple Charts Pattern Analysis?
With the growing availability of trading courses online, mastering this skill is more accessible than ever. With structured guidance, practical demonstrations, and community support, online courses help traders go from beginner to advanced level at their own pace.
When looking to learn trading online, make sure the course includes:
A wide variety of chart patterns
Real-world trading examples
Practice charts and quizzes
Access to mentors or peer groups
The best online trading course will not only teach you the patterns but also show you how to apply them in live market scenarios.
Why Traders Prefer Online Learning?
More traders today are turning to online trading courses due to their accessibility, flexibility, and cost-effectiveness. Instead of spending hours sifting through scattered resources, these courses offer a streamlined path with expert insights and practical tips.
At Chart Monks, for example, our online trading course is designed specifically to help you learn Multiple Charts Pattern analysis in a structured and engaging way. From beginner-level basics to advanced strategies, our course modules guide you through every step of the journey with clarity and confidence.
Real-World Application of Multiple Chart Patterns
Consider a situation where a head and shoulders pattern develops on the daily chart, while a bullish flag takes shape on the 15-minute timeframe. A trader who understands both patterns can make a more informed decision—perhaps waiting for the intraday breakout to align with the longer-term trend reversal before entering a trade.
This kind of multi-pattern, multi-timeframe approach allows for:
Stronger confirmation before trade execution
Precision in entry and exit points
Reduced risk due to enhanced clarity
Such insights are only possible when you've committed the time to learn Multiple Charts Pattern analysis thoroughly.
Final Thoughts
To keep up with the ever-changing markets, your trading game must keep improving. Limiting yourself to a handful of patterns may provide short-term success, but if you're aiming for long-term consistency, mastering Multiple Charts Pattern Analysis is crucial.
With the right online trading course, dedication, and practice, any trader can develop this vital skill. So if you’re serious about leveling up your trading game, it’s time to learn Multiple Charts Pattern analysis and turn uncertainty into opportunity.
Ready to start your journey? Take the next step in your trading journey by visiting Chart Monks and exploring our expert-led online courses. Learn at your own pace, sharpen your skills, and become a more confident and consistent trader.
#Learn Multiple Charts Pattern#Multiple Charts Pattern Analysis#Learn Trading Online#Online Trading Course#Trading Courses Online#Chart Monk
0 notes
Text
Mukka Proteins Acquires 51% Stake in GSM Marine Export for ₹14 Crore
Mukka Proteins Limited has announced the successful acquisition of a 51% stake in GSM Marine Export, a partnership firm engaged in the manufacturing of fish meal and fish oil. The acquisition, finalized through capital contribution for a consideration not exceeding ₹14 crore, is in line with the company’s strategic vision to strengthen its core business operations. In its regulatory filing under…

View On WordPress
#MUKKA 52-week high#MUKKA 52-week low#MUKKA EPS#MUKKA NSE#MUKKA P/E ratio#MUKKA price to book ratio#Mukka Proteins dividend yield#Mukka Proteins financials#Mukka Proteins investment analysis#Mukka Proteins Ltd financial ratios#Mukka Proteins Ltd IPO review#Mukka Proteins Ltd share price#Mukka Proteins Ltd stock news#Mukka Proteins market cap#Mukka Proteins quarterly results#Mukka Proteins share#Mukka Proteins share performance#Mukka Proteins shareholding pattern#Mukka Proteins stock analysis#MUKKA stock chart#MUKKA stock forecast#MUKKA stock price#MUKKA stock review#MUKKA stock trading volume#MUKKA stock volatility
0 notes
Text

📉 U.S. Bond Yields Expected to Fall Despite Trade Tensions: What Investors Should Know
In a surprising twist amid growing trade tensions, leading bond strategists predict that U.S. Treasury yields are set to decline in the coming months.
According to a recent Reuters poll, the benchmark 10-year Treasury yield—currently around 4.38%—is expected to drop to 4.21% by June and further down to 4.14% within a year. This projection comes despite market fears that escalating tariffs and inflation pressures could push yields higher. read more
#trade war#bonds#how to trade online#bond yields#how to invest in real estate#u.s.-china trade war#how to invest in stocks#trade sanctions#how to invest#trade negotiations#trade talks#us china trade#how to be a millionaire in 3 years#investor psychology#how to be a millionaire#how to build wealth in your 20s#how to build wealth#trade deal#bond yield#trade wars#china trade#us europe trade#chart patterns#trump trade war impact#trade
0 notes
Text
Unlocking the Power of TradingView: The Best Charting Platform for Traders
A sleek and modern TradingView dashboard displaying real-time charts, candlestick patterns, and powerful technical indicators like RSI and MACD. Are you looking for a powerful, easy-to-use charting tool to enhance your trading? Whether you’re a beginner or an experienced trader, TradingView is one of the best platforms for technical analysis, market insights, and strategy building. And here’s…
#Affiliate Marketing#Automated trading#Candlestick patterns#Crypto trading#Day trading#Forex trading#Investing#MACD#Market analysis#Online trading#passive income#RSI#Stock market#Swing trading#Technical analysis#Trading alerts#Trading bots#Trading platform#Trading signals#Trading strategies#Trading tools#TradingView#TradingView charts#TradingView indicators#TradingView plans#TradingView pricing#TradingView review
0 notes
Text
How to Trade Using Cup and Handle Chart Pattern
The cup and handle pattern is a decades-old chart pattern that was popularised by William J. O'Neil, a well-known investor and the founder of Investor's Business Daily. He introduced this concept in his book How to Make Money in Stocks, published in the 1980s. O'Neil observed that this pattern often appears in stocks before they make significant upward moves, especially when supported by strong trading volume during the breakout.
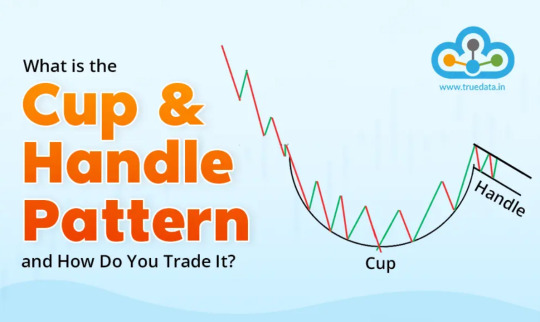
This pattern is used to identify potential bullish trends in stocks, commodities, or other financial instruments. The pattern gets its name due to its distinct resemblance to a cup with a handle when viewed on a price chart. The pattern begins with a rounded, U-shaped decline and recovery, forming the ‘cup’. After the cup is formed, there is a smaller, sideways or slightly downward consolidation phase, creating the ‘handle’. This handle typically represents a brief pause before the price breaks out in an upward direction.
Read More: https://www.truedata.in/blog/what-is-cup-and-handle-pattern-and-how-to-trade-it
#What is Cup and Handle Chart Pattern#How to Trade Using Cup and Handle Chart Pattern#Pros and Cons of using the Cup and Handle Pattern for Trading
0 notes
Text
Gold Surges Amid Geopolitical Tensions & Forex Market Shifts

GOLD
Gold has reached record highs as geopolitical risks escalate. Reports indicate Iran is accelerating its nuclear program, heightening investor uncertainty. Former President Donald Trump suggested potential U.S. intervention in Gaza, later moderated by aides, while talks on renegotiating the Iran nuclear deal add to market volatility. Washington’s proposal for a resolution in the Russia-Ukraine conflict further complicates global markets. Technically, forex chart patterns indicate a bullish structure. The RSI reflects strong momentum, while algorithmic trading signals suggest potential resistance levels. However, the MACD signals a possible pullback, and the EMA200 remains a key support level. Unless a clear reversal emerges, gold's overall outlook stays bullish.
SILVER
Silver struggles to break past the 32.5177 resistance level. The RSI reflects consolidation with bullish undertones, and the MACD highlights limited selling pressure. Breakout trading methods indicate continued bullish potential, provided the market sustains its gradual buildup in buying interest.
DXY
The worldwide economic indicators signal a shift as the Dollar Index (DXY) slides below 107.834, confirming a bearish momentum. The MACD shows weak buying volume, while RSI indicates overbought conditions. The upcoming Non-Farm Payroll (NFP) report will be a crucial factor, but expectations of a prolonged rate cut cycle weigh on the dollar’s strength.
FOREX PAIRS
GBPUSD
The Pound surged past resistance before retracing amid speculation of a 92% chance of a rate cut. The MACD suggests strong momentum, while the RSI indicates oversold conditions, supporting potential bullish attempts. However, market direction hinges on upcoming economic data and central bank policy.
AUDUSD
The Australian Dollar sees buying pressure as the U.S. dollar weakens. The MACD hints at bearish undertones, but the RSI signals oversold conditions, aligning with capital distribution strategies. A continued bullish outlook is expected unless key support levels break.
NZDUSD
The Kiwi consolidates near 0.56859 after surpassing key resistance. MACD indicates low volume, while RSI suggests oversold conditions, pointing to further upside potential. If consolidation continues, a breakout higher may be in store.
EURUSD
The Euro remains cautiously bullish, supported by the EMA200. RSI indicates buying interest, but resistance at swing highs restricts momentum. A potential breakout is likely, contingent on economic developments and market sentiment.
USDJPY
The Yen strengthens amid Bank of Japan rate hike expectations. The MACD recently crossed upward, signaling a short-term correction, while RSI reflects overbought dollar conditions. The downtrend holds as long as BOJ maintains a tightening stance.
USDCHF
The Swiss Franc maintains its downtrend. The MACD presents mixed signals, while RSI indicates overbought conditions, reinforcing bearish momentum. The EMA200 acts as a resistance level, capping potential upside.
USDCAD
The Canadian Dollar stabilizes near key support but remains in a broader bearish trend. The MACD suggests strong selling volume, while RSI signals overbought conditions, limiting upside potential. Consolidation may persist, but overall sentiment favors further downside.
COT REPORT ANALYSIS
AUD: WEAK (5/5) GBP: WEAK (4/5) CAD: WEAK (4/5) EUR: WEAK (4/5) JPY: WEAK (1/5) CHF: WEAK (5/5) USD: STRONG (4/5) NZD: WEAK (4/5) GOLD: STRONG (5/5) SILVER: STRONG (4/5)
These market movements align with forex chart patterns, breakout trading methods, and capital distribution strategies, helping traders navigate shifting economic conditions.
#Breakout trading methods#Algorithmic trading signals#Capital distribution strategy#Worldwide economic indicators#Forex chart patterns
0 notes
Text
How to Trade the Breakout & Retest Pattern: Strategies That Work
Breakout and retest trading is one of the most reliable techniques in technical analysis. It allows traders to enter trades with confidence after confirming the breakout of a key support or resistance level. If executed correctly, it offers high probability entries, clear invalidation points, and strong risk-to-reward ratios. In this blog, we’ll break down everything you need to know about the…
#breakout and pullback strategy#breakout and retest confirmation#breakout and retest pattern#breakout and retest trading strategy#breakout continuation pattern#breakout entry strategy#breakout retest candlestick pattern#breakout reversal signals#breakout trading risk management#breakout trading strategy for beginners#breakout vs breakdown#chart patterns with breakout#Confluence Trading#failed breakout recovery#fake breakout vs real breakout#Fibonacci breakout confluence#high probability breakout setup#how to identify breakout levels#how to trade breakout and retest#intraday breakout and retest setup#key support and resistance zones#learn technical analysis#Price Action Trading#retest after breakout#retest in technical analysis#stock markets#stock trading#successful trading#support and resistance breakout#swing trading breakout strategy
0 notes
Text
What are the most popular chart patterns in trading?
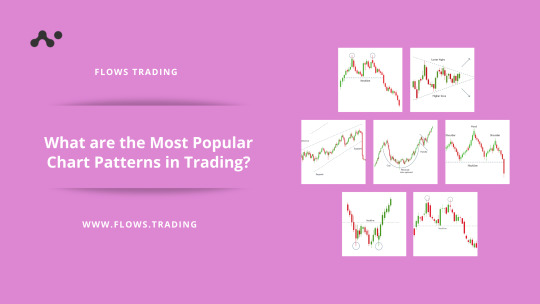
Here are the most popular chart Patterns in trading.
Head and Shoulders
Double Top and Double Bottom
Triangles (Ascending, Descending, Symmetrical)
Flags and Pennants
Cup and Handle
Understanding the most popular chart patterns in trading can help you become a more confident and strategic trader.
While no pattern guarantees success, using them alongside other tools—like volume analysis, moving averages, and risk management—can significantly improve your chances.
#chart patterns#most popular chart patterns in trading#chart patterns in trading#trading chart patterns
1 note
·
View note
Text
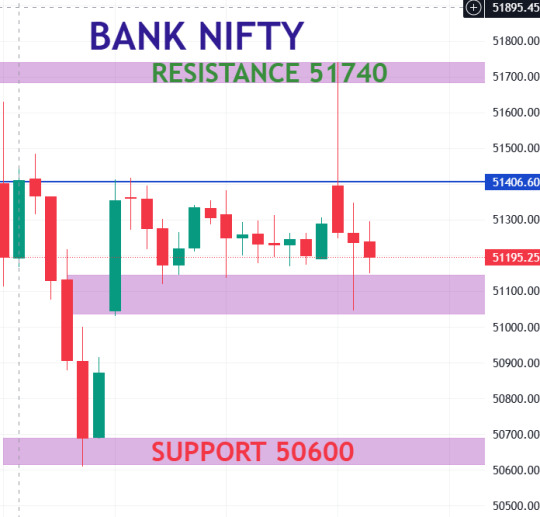

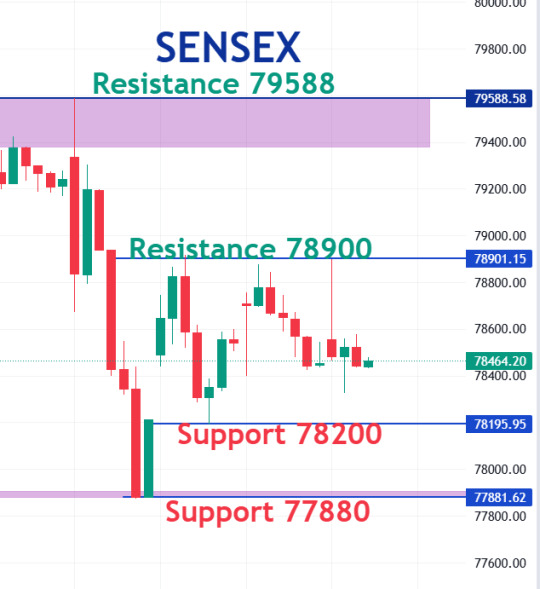
Nift Bannifty Sensex Technical analysis 28 DEC
#stock market#nifty#nifty50#nifty prediction#nifty fifty#banknifty#sensex#nse#bse#bse sensex#share market#technicalanalysis#chart patterns#finnifty#live trading#howtrading2#howtrading
1 note
·
View note
Text
Binge-Worthy Trading: When Technical Analysis Meets Your Watch List
Hey streaming fanatics turned traders! Ever notice how your chart analysis skills improved after watching 47 episodes of your favorite show in one sitting? No? Let me explain this hilarious connection between your Netflix addiction and trading success!
Remember how you predicted that plot twist in your favorite series because you noticed all the subtle hints? That's exactly what technical analysis is - except instead of predicting who ends up with who, you're predicting where prices might go. And trust me, both can be equally dramatic!
Think about your favorite crime series. You know how detectives look for patterns to solve cases? Well, traders are basically market detectives! Instead of looking for clues at a crime scene, we're searching for clues in our charts. Though sometimes the market commits crimes against our portfolio, but that's another story...
The best part is how similar chart patterns are to TV show formulas. You've got your reversal patterns (like season finales), continuation patterns (like mid-season episodes), and those false breakouts (like clickbait episode titles that promise more than they deliver).
And don't even get me started on double tops and bottoms - they're like those classic "evil twin" episodes. Just when you think you know what's happening, the market pulls a soap opera move on you!
Concluding paragraph: So next time someone tells you you're watching too much TV, just tell them you're actually studying advanced pattern recognition for your trading career! And remember, just like you wouldn't skip to the last episode of a series, don't rush your trading journey. Enjoy the show, learn the patterns, and maybe keep some popcorn handy for those volatile market days!
#trading entertainment#Netflix analysis#market patterns#trading humor#technical analysis basics#chart patterns#trading psychology#market trends#trading education#beginner trading
1 note
·
View note
Text
0 notes