#Data science tutorial
Explore tagged Tumblr posts
Visit Tumblr Blog
Explore Tumblr blogs with no restrictions, modern design and the best experience.
Last Seen Tumblr Blogs


Fun Fact
When “GIF” was named word of the year in 2012, Oxford Dictionaries U.S.A. credited Tumblr for pushing the word.
Text

#Data Science Certification#Data Science Course#Best Data Science Courses Online#Best Data Science Courses Online/offline#Complete Data Science Course#Certified Data Science Course#Data Science Tutorial#Data Science Courses & Tutorials#Data Science Online Training Courses#Data Science Course Live Course with Job Assistance#Full Stack Data Science Course Online#Best Data Science Courses Online with Certificates#Learn Data Science with Our Online Courses
0 notes
Note
Hello there! I'm currently combing thru various Hetalia character tags and counting the ships that appear for any individual character, and I'm considering doing a write-up like how I see you make them! I'd like to ask you how do you go about formatting/presenting the information? I made a pie chart n everything!
Hi -- that sounds like an awesome project! Very cool. :)
I'll share what I do for data visualization, but I'll also say that there are other ways to do all of this, and depending on your goals, other ways may be better. So this isn't a recommendation -- just insight into my own process.
I use Google Sheets (similar to Excel) to gather/analyze data and to make graphs. (Many other programs/methods would work and have various pros & cons, so if you have a different favorite/you've already made your graphs, no problem! I use Sheets in part because it's easy to share to make my data broadly accessible.)
To get the unified look of my fandom stats -- and because I often want to add additional notes on top of/next to my graphs -- I copy/paste the graphs into Google Slides and add notes/titles/etc there. I have a slide theme that I use to made to get my particular Toastystats look; here's a more generic template of it that you can edit/use yourself, if that's helpful. I like to use it to put a border around my slides (so that if it's on a white background you can still see the edges) and to put my blog credit and the date at the bottom (useful in case someone stumbles across it years later and doesn't realize the data is old, or wants to ask you questions). If you want to change any of the defaults in these template slides (e.g., change the colors or fill in the footer text), you'll need to use the menus to go to "Slide -> Edit theme".
After that, I export each slide as a PNG image ("File -> Download").
---
I will also make a quick unsolicited suggestion about pie charts, which you can feel free to ignore: I use bar charts most of the time. I only use pie charts only when I have a bunch of different mutually exclusive categories that add up to 100% -- basically when I can think of the data as creating a "sensible whole pie."
So, for instance, imagine a possible pie here as "Fanworks where Character X is tagged." And I want to show how many of those fanworks have different ship tags. Well, multiple ship tags probably sometimes get used together, which means that actually some of the pie slices (i.e., the ships) should be overlapping, not separate -- and overlapping slices make for weird pie. :) Also, there are probably a large number of Character X tags that don't use any of the ship tags (which at minimum should mean I would also want a large "Other fanworks" slice of pie, if I did use a pie chart). Because of all this, I would probably choose to use a bar chart for that data.
---
Feel free to ask more questions if you have them (I recognize that many parts of this could be be confusing, depending on your particular background), and good luck! :)
#toastystats#fandom stats#data science#data visualization#tutorial#slide template#pie charts#and my philosophy thereof#op#asks#toasty replies#to archive
10 notes
·
View notes
Text
2 notes
·
View notes
Text

TOP 10 courses that have generally been in high demand in 2024-
Data Science and Machine Learning: Skills in data analysis, machine learning, and artificial intelligence are highly sought after in various industries.
Cybersecurity: With the increasing frequency of cyber threats, cybersecurity skills are crucial to protect sensitive information.
Cloud Computing: As businesses transition to cloud-based solutions, professionals with expertise in cloud computing, like AWS or Azure, are in high demand.
Digital Marketing: In the age of online businesses, digital marketing skills, including SEO, social media marketing, and content marketing, are highly valued.
Programming and Software Development: Proficiency in programming languages and software development skills continue to be in high demand across industries.
Healthcare and Nursing: Courses related to healthcare and nursing, especially those addressing specific needs like telemedicine, have seen increased demand.
Project Management: Project management skills are crucial in various sectors, and certifications like PMP (Project Management Professional) are highly valued.
Artificial Intelligence (AI) and Robotics: AI and robotics courses are sought after as businesses explore automation and intelligent technologies.
Blockchain Technology: With applications beyond cryptocurrencies, blockchain technology courses are gaining popularity in various sectors, including finance and supply chain.
Environmental Science and Sustainability: Courses focusing on environmental sustainability and green technologies are increasingly relevant in addressing global challenges.
Join Now
learn more -
#artificial intelligence#html#coding#machine learning#python#programming#indiedev#rpg maker#devlog#linux#digital marketing#top 10 high demand course#Data Science courses#Machine Learning training#Cybersecurity certifications#Cloud Computing courses#Digital Marketing classes#Programming languages tutorials#Software Development courses#Healthcare and Nursing programs#Project Management certification#Artificial Intelligence courses#Robotics training#Blockchain Technology classes#Environmental Science education#Sustainability courses
2 notes
·
View notes
Text
Navigating the Nervous Waters of Coding
Daily writing promptWhat makes you nervous?View all responses AI-generated image. “This code is going well…a little too well.” The Code Creep: Why Every Line Can Feel Like a Tightrope Walk What makes me nervous? You might think it’s a looming deadline or a particularly gnarly algorithm. And while those definitely get the heart racing, the real source of my coding jitters? It’s the act of…
#Artificial Intelligence#best practices#c#c++#career advice#Cloud computing#coding#dailyprompt#dailyprompt-1916#data science#debugging#devops#java#javascript#machine learning#mobile development#Programming#python#software development#testing#tutorials#web development
1 note
·
View note
Text
#AI Career#BCA to AI#Machine Learning for Beginners#Python for AI#AI Projects Portfolio#Data Science Fundamentals#TensorFlow Tutorials#Deep Learning Essentials#AI Internships#Building AI Resume#AI Communities & Networking#Math for AI#NLP Projects#Image Recognition Guide
0 notes
Text
youtube
Build 5 Real World Python Projects With 3 Senior Developers
These 5 real-world Python projects (from 3 of our TOP courses) are guaranteed to take your skills to the next level!
Instead of just learning syntax, you’ll apply Python in real-world scenarios—from automation to data analysis and even security-focused projects. These are the kinds of projects that help you stand out to employers and solidify your skills beyond the basics.
You’re not just learning from any instructor—you’ll be guided by 3 industry experts: Andrei Neagoie, Travis Cuzick, and Diogo Resende, all senior developers who have helped 1,000s of students land jobs in tech.
#python classes#free education#education#educate yourselves#educate yourself#python tutorial#python programming#python training#python for data science#python course#coding#developers#data science#machine learning#python projects#learn python#python#technology#youtube#Youtube
0 notes
Text

Mengolah data survey di ArcGIS PRO 3. Dapatkan di UDEMY via: https://s.id/arcgispro3p
0 notes
Text

#Best Data Science Courses Online/offline#Complete Data Science Course#Certified Data Science Course#Data Science Tutorial#Data Science Courses & Tutorials#Data Science Online Training Courses#Data Science Course Live Course with Job Assistance#Full Stack Data Science Course Online#Best Data Science Courses Online with Certificates#Learn Data Science with Our Online Courses
0 notes
Text
Data Science for Beginners: Essential Tutorials to Build Your Skills
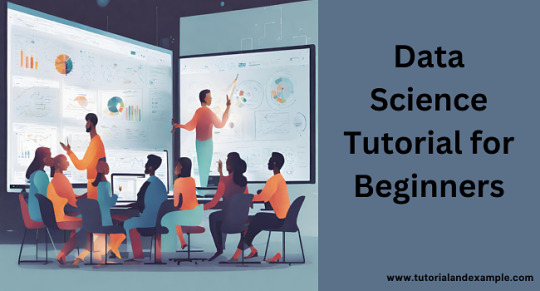
Data Science is one of the most exciting fields in today’s digital world. If you're new to this, don't worry! This Data Science tutorial for beginners will help you understand the basics and guide you on how to start your journey.
Data Science combines statistics, programming, and domain knowledge to analyze data and solve real-world problems. It involves several steps: collecting data, cleaning it, analyzing patterns, and presenting insights. These insights help companies make better decisions, predict trends, and improve processes.
Why Learn Data Science?
Data is everywhere! From social media to healthcare, businesses rely on data to grow. Learning data science can open doors to high-paying jobs and exciting projects. It’s a skill in demand, making it a great field to explore.
How to Get Started?
Learn the Basics: Start with Python or R programming. These are beginner-friendly and widely used in data science.
Understand Statistics: Knowledge of mean, median, standard deviation, and probability is crucial.
Explore Data Visualization: Tools like Tableau or libraries like Matplotlib in Python help present data clearly.
Work on Projects: Practice is key! Try simple projects like analyzing weather patterns or predicting sales trends.
As a beginner, focus on building a strong foundation. There are plenty of free resources and tutorials to help you grow step-by-step.
For a more detailed guide, check out Data Science Tutorial. Happy learning!
0 notes
Text

Start your data science journey with TAE's Data Science Tutorial. Learn the basics of programming, statistics, and data analysis in this beginner-friendly guide. Perfect for newcomers!
0 notes
Text
Industry-Leading Visualization with Tableau Data Visualization

1. User-Friendly Interface: The intuitive design allows anyone to easily start visualizing data.
2. Seamless Integration: Connects easily with various data sources for efficient analysis.
3. Quick Insights: Generate actionable insights within minutes.
4. Integrated Collaboration Tools: Share dashboards and insights with your team effortlessly.
5. Regular Updates: Tableau continuously evolves with new features and improvements.
Want to take your skills to the next level? Join our 1-day Tableau Bootcamp on 2nd November (Online)!
#tableau#tableau software#data visualization#data visualisation#dataviz#software#technology#cavillion#cavillion learning#data analytics#data#tableau online training#tableaudesktop#tableau dashboard#big data#business analytics#data analysis#data science#tableau course#salesforce#Tableau Tutorial#Tableau Visualization#Tableau Training#learn tableau#tableau certification#Tableau Visualisation
1 note
·
View note
Text
A Beginner's Guide to Python
A Beginner’s Guide to Python Python, a versatile and widely-used programming language, has gained immense popularity due to its readability, ease of use, and vast library ecosystem. This beginner’s guide will illuminate the core concepts of Python programming, unraveling its fundamental syntax, data structures, and libraries, and demonstrating their practical applications. Python’s readability…
0 notes
Text
Jesus christ I’m so so tired I can’t sleep more than 6-7 hours anymore I’ve been just going & going & going all week & it’s been really fun & I’ve hung out with a lot of great people but I can’t do this I can’t hang out with people & talk to ppl every day of the week & not stop or give myself a break I’m not functioning right I can’t function right when I’m constantly around people all the time like I’m going to stop being able to talk or move my face or anything at all but I can’t have extended periods of alone time here because this is a goddamn college there are people everywhere there aren’t any people-less spots where I can just exist and not have to worry about what people think of me or whether they like me or whether I’m making the right face or saying the right thing or talking too much or not talking enough I know logically that no one is probably consciously judging me about this but I *have* to think about it in order to not be even more of a misfit but I *can’t* keep it up I’m going to shut down if I do
#vent post#i’ll probably get over it don’t worry about me too much#Oh also I’m terrified about my data science homework that’s due tomorrow did I mention that#I don’t know how to code & even though our prof has a tutorial posted on canvas I knowwww I’m going to fuck it up somehow
0 notes