#SQL performance optimization
Explore tagged Tumblr posts
Visit Tumblr Blog
Explore Tumblr blogs with no restrictions, modern design and the best experience.
Last Seen Tumblr Blogs


Fun Fact
When “GIF” was named word of the year in 2012, Oxford Dictionaries U.S.A. credited Tumblr for pushing the word.
Text
Upgrading Your Azure SQL VM from SQL Server Standard to Enterprise
In the ever-evolving landscape of database technologies, keeping your systems updated with the latest versions is crucial for harnessing enhanced features, improved performance, and robust security measures. For businesses leveraging Microsoft Azure’s SQL Virtual Machines (VMs), upgrading from SQL Server 2019 Standard to the Enterprise version represents a significant leap forward. This guide…
View On WordPress
#Azure SQL VM enhancement#SQL performance optimization#SQL Server 2019 upgrade#SQL Server backup strategies#Standard to Enterprise migration
0 notes
Text
🚀 Struggling to balance transactional (OLTP) & analytical (OLAP) workloads? Microsoft Fabric SQL Database is the game-changer! In this blog, I’ll share best practices, pitfalls to avoid, and optimization tips to help you master Fabric SQL DB. Let’s dive in! 💡💬 #MicrosoftFabric #SQL
#Data management#Database Benefits#Database Optimization#Database Tips#Developer-Friendly#Fabric SQL Database#Microsoft Fabric#SQL database#SQL Performance#Transactional Workloads#Unlock SQL Potential
0 notes
Text
ColdFusion with PostgreSQL: Optimizing Performance for Advanced SQL Features
#ColdFusion with PostgreSQL: Optimizing Performance for Advanced SQL Features#ColdFusion with PostgreSQL: Performance for Advanced SQL Features#ColdFusion with PostgreSQL
0 notes
Text
Top 10 ChatGPT Prompts For Software Developers

ChatGPT can do a lot more than just code creation and this blog post is going to be all about that. We have curated a list of ChatGPT prompts that will help software developers with their everyday tasks. ChatGPT can respond to questions and can compose codes making it a very helpful tool for software engineers.
While this AI tool can help developers with the entire SDLC (Software Development Lifecycle), it is important to understand how to use the prompts effectively for different needs.
Prompt engineering gives users accurate results. Since ChatGPT accepts prompts, we receive more precise answers. But a lot depends on how these prompts are formulated.
To Get The Best Out Of ChatGPT, Your Prompts Should Be:
Clear and well-defined. The more detailed your prompts, the better suggestions you will receive from ChatGPT.
Specify the functionality and programming language. Not specifying what you exactly need might not give you the desired results.
Phrase your prompts in a natural language, as if asking someone for help. This will make ChatGPT understand your problem better and give more relevant outputs.
Avoid unnecessary information and ambiguity. Keep it not only to the point but also inclusive of all important details.
Top ChatGPT Prompts For Software Developers
Let’s quickly have a look at some of the best ChatGPT prompts to assist you with various stages of your Software development lifecycle.
1. For Practicing SQL Commands;

2. For Becoming A Programming Language Interpreter;

3. For Creating Regular Expressions Since They Help In Managing, Locating, And Matching Text.

4. For Generating Architectural Diagrams For Your Software Requirements.
Prompt Examples: I want you to act as a Graphviz DOT generator, an expert to create meaningful diagrams. The diagram should have at least n nodes (I specify n in my input by writing [n], 10 being the default value) and to be an accurate and complex representation of the given input. Each node is indexed by a number to reduce the size of the output, should not include any styling, and with layout=neato, overlap=false, node [shape=rectangle] as parameters. The code should be valid, bugless and returned on a single line, without any explanation. Provide a clear and organized diagram, the relationships between the nodes have to make sense for an expert of that input. My first diagram is: “The water cycle [8]”.

5. For Solving Git Problems And Getting Guidance On Overcoming Them.
Prompt Examples: “Explain how to resolve this Git merge conflict: [conflict details].” 6. For Code generation- ChatGPT can help generate a code based on descriptions given by you. It can write pieces of codes based on the requirements given in the input. Prompt Examples: -Write a program/function to {explain functionality} in {programming language} -Create a code snippet for checking if a file exists in Python. -Create a function that merges two lists into a dictionary in JavaScript.
7. For Code Review And Debugging: ChatGPT Can Review Your Code Snippet And Also Share Bugs.
Prompt Examples: -Here’s a C# code snippet. The function is supposed to return the maximum value from the given list, but it’s not returning the expected output. Can you identify the problem? [Enter your code here] -Can you help me debug this error message from my C# program: [error message] -Help me debug this Python script that processes a list of objects and suggests possible fixes. [Enter your code here]
8. For Knowing The Coding Best Practices And Principles: It Is Very Important To Be Updated With Industry’s Best Practices In Coding. This Helps To Maintain The Codebase When The Organization Grows.
Prompt Examples: -What are some common mistakes to avoid when writing code? -What are the best practices for security testing? -Show me best practices for writing {concept or function} in {programming language}.
9. For Code Optimization: ChatGPT Can Help Optimize The Code And Enhance Its Readability And Performance To Make It Look More Efficient.
Prompt Examples: -Optimize the following {programming language} code which {explain the functioning}: {code snippet} -Suggest improvements to optimize this C# function: [code snippet] -What are some strategies for reducing memory usage and optimizing data structures?
10. For Creating Boilerplate Code: ChatGPT Can Help In Boilerplate Code Generation.
Prompt Examples: -Create a basic Java Spring Boot application boilerplate code. -Create a basic Python class boilerplate code
11. For Bug Fixes: Using ChatGPT Helps Fixing The Bugs Thus Saving A Large Chunk Of Time In Software Development And Also Increasing Productivity.
Prompt Examples: -How do I fix the following {programming language} code which {explain the functioning}? {code snippet} -Can you generate a bug report? -Find bugs in the following JavaScript code: (enter code)
12. Code Refactoring- ChatGPt Can Refactor The Code And Reduce Errors To Enhance Code Efficiency, Thus Making It Easier To Modify In The Future.
Prompt Examples –What are some techniques for refactoring code to improve code reuse and promote the use of design patterns? -I have duplicate code in my project. How can I refactor it to eliminate redundancy?
13. For Choosing Deployment Strategies- ChatGPT Can Suggest Deployment Strategies Best Suited For A Particular Project And To Ensure That It Runs Smoothly.
Prompt Examples -What are the best deployment strategies for this software project? {explain the project} -What are the best practices for version control and release management?
14. For Creating Unit Tests- ChatGPT Can Write Test Cases For You
Prompt Examples: -How does test-driven development help improve code quality? -What are some best practices for implementing test-driven development in a project? These were some prompt examples for you that we sourced on the basis of different requirements a developer can have. So whether you have to generate a code or understand a concept, ChatGPT can really make a developer’s life by doing a lot of tasks. However, it certainly comes with its own set of challenges and cannot always be completely correct. So it is advisable to cross-check the responses. Hope this helps. Visit us- Intelliatech
#ChatGPT prompts#Developers#Terminal commands#JavaScript console#API integration#SQL commands#Programming language interpreter#Regular expressions#Code debugging#Architectural diagrams#Performance optimization#Git merge conflicts#Prompt engineering#Code generation#Code refactoring#Debugging#Coding best practices#Code optimization#Code commenting#Boilerplate code#Software developers#Programming challenges#Software documentation#Workflow automation#SDLC (Software Development Lifecycle)#Project planning#Software requirements#Design patterns#Deployment strategies#Security testing
0 notes
Text
Python Libraries to Learn Before Tackling Data Analysis
To tackle data analysis effectively in Python, it's crucial to become familiar with several libraries that streamline the process of data manipulation, exploration, and visualization. Here's a breakdown of the essential libraries:
1. NumPy
- Purpose: Numerical computing.
- Why Learn It: NumPy provides support for large multi-dimensional arrays and matrices, along with a collection of mathematical functions to operate on these arrays efficiently.
- Key Features:
- Fast array processing.
- Mathematical operations on arrays (e.g., sum, mean, standard deviation).
- Linear algebra operations.
2. Pandas
- Purpose: Data manipulation and analysis.
- Why Learn It: Pandas offers data structures like DataFrames, making it easier to handle and analyze structured data.
- Key Features:
- Reading/writing data from CSV, Excel, SQL databases, and more.
- Handling missing data.
- Powerful group-by operations.
- Data filtering and transformation.
3. Matplotlib
- Purpose: Data visualization.
- Why Learn It: Matplotlib is one of the most widely used plotting libraries in Python, allowing for a wide range of static, animated, and interactive plots.
- Key Features:
- Line plots, bar charts, histograms, scatter plots.
- Customizable charts (labels, colors, legends).
- Integration with Pandas for quick plotting.
4. Seaborn
- Purpose: Statistical data visualization.
- Why Learn It: Built on top of Matplotlib, Seaborn simplifies the creation of attractive and informative statistical graphics.
- Key Features:
- High-level interface for drawing attractive statistical graphics.
- Easier to use for complex visualizations like heatmaps, pair plots, etc.
- Visualizations based on categorical data.
5. SciPy
- Purpose: Scientific and technical computing.
- Why Learn It: SciPy builds on NumPy and provides additional functionality for complex mathematical operations and scientific computing.
- Key Features:
- Optimized algorithms for numerical integration, optimization, and more.
- Statistics, signal processing, and linear algebra modules.
6. Scikit-learn
- Purpose: Machine learning and statistical modeling.
- Why Learn It: Scikit-learn provides simple and efficient tools for data mining, analysis, and machine learning.
- Key Features:
- Classification, regression, and clustering algorithms.
- Dimensionality reduction, model selection, and preprocessing utilities.
7. Statsmodels
- Purpose: Statistical analysis.
- Why Learn It: Statsmodels allows users to explore data, estimate statistical models, and perform tests.
- Key Features:
- Linear regression, logistic regression, time series analysis.
- Statistical tests and models for descriptive statistics.
8. Plotly
- Purpose: Interactive data visualization.
- Why Learn It: Plotly allows for the creation of interactive and web-based visualizations, making it ideal for dashboards and presentations.
- Key Features:
- Interactive plots like scatter, line, bar, and 3D plots.
- Easy integration with web frameworks.
- Dashboards and web applications with Dash.
9. TensorFlow/PyTorch (Optional)
- Purpose: Machine learning and deep learning.
- Why Learn It: If your data analysis involves machine learning, these libraries will help in building, training, and deploying deep learning models.
- Key Features:
- Tensor processing and automatic differentiation.
- Building neural networks.
10. Dask (Optional)
- Purpose: Parallel computing for data analysis.
- Why Learn It: Dask enables scalable data manipulation by parallelizing Pandas operations, making it ideal for big datasets.
- Key Features:
- Works with NumPy, Pandas, and Scikit-learn.
- Handles large data and parallel computations easily.
Focusing on NumPy, Pandas, Matplotlib, and Seaborn will set a strong foundation for basic data analysis.
8 notes
·
View notes
Text
Unlocking the Power of Data: Essential Skills to Become a Data Scientist

In today's data-driven world, the demand for skilled data scientists is skyrocketing. These professionals are the key to transforming raw information into actionable insights, driving innovation and shaping business strategies. But what exactly does it take to become a data scientist? It's a multidisciplinary field, requiring a unique blend of technical prowess and analytical thinking. Let's break down the essential skills you'll need to embark on this exciting career path.
1. Strong Mathematical and Statistical Foundation:
At the heart of data science lies a deep understanding of mathematics and statistics. You'll need to grasp concepts like:
Linear Algebra and Calculus: Essential for understanding machine learning algorithms and optimizing models.
Probability and Statistics: Crucial for data analysis, hypothesis testing, and drawing meaningful conclusions from data.
2. Programming Proficiency (Python and/or R):
Data scientists are fluent in at least one, if not both, of the dominant programming languages in the field:
Python: Known for its readability and extensive libraries like Pandas, NumPy, Scikit-learn, and TensorFlow, making it ideal for data manipulation, analysis, and machine learning.
R: Specifically designed for statistical computing and graphics, R offers a rich ecosystem of packages for statistical modeling and visualization.
3. Data Wrangling and Preprocessing Skills:
Raw data is rarely clean and ready for analysis. A significant portion of a data scientist's time is spent on:
Data Cleaning: Handling missing values, outliers, and inconsistencies.
Data Transformation: Reshaping, merging, and aggregating data.
Feature Engineering: Creating new features from existing data to improve model performance.
4. Expertise in Databases and SQL:
Data often resides in databases. Proficiency in SQL (Structured Query Language) is essential for:
Extracting Data: Querying and retrieving data from various database systems.
Data Manipulation: Filtering, joining, and aggregating data within databases.
5. Machine Learning Mastery:
Machine learning is a core component of data science, enabling you to build models that learn from data and make predictions or classifications. Key areas include:
Supervised Learning: Regression, classification algorithms.
Unsupervised Learning: Clustering, dimensionality reduction.
Model Selection and Evaluation: Choosing the right algorithms and assessing their performance.
6. Data Visualization and Communication Skills:
Being able to effectively communicate your findings is just as important as the analysis itself. You'll need to:
Visualize Data: Create compelling charts and graphs to explore patterns and insights using libraries like Matplotlib, Seaborn (Python), or ggplot2 (R).
Tell Data Stories: Present your findings in a clear and concise manner that resonates with both technical and non-technical audiences.
7. Critical Thinking and Problem-Solving Abilities:
Data scientists are essentially problem solvers. You need to be able to:
Define Business Problems: Translate business challenges into data science questions.
Develop Analytical Frameworks: Structure your approach to solve complex problems.
Interpret Results: Draw meaningful conclusions and translate them into actionable recommendations.
8. Domain Knowledge (Optional but Highly Beneficial):
Having expertise in the specific industry or domain you're working in can give you a significant advantage. It helps you understand the context of the data and formulate more relevant questions.
9. Curiosity and a Growth Mindset:
The field of data science is constantly evolving. A genuine curiosity and a willingness to learn new technologies and techniques are crucial for long-term success.
10. Strong Communication and Collaboration Skills:
Data scientists often work in teams and need to collaborate effectively with engineers, business stakeholders, and other experts.
Kickstart Your Data Science Journey with Xaltius Academy's Data Science and AI Program:
Acquiring these skills can seem like a daunting task, but structured learning programs can provide a clear and effective path. Xaltius Academy's Data Science and AI Program is designed to equip you with the essential knowledge and practical experience to become a successful data scientist.
Key benefits of the program:
Comprehensive Curriculum: Covers all the core skills mentioned above, from foundational mathematics to advanced machine learning techniques.
Hands-on Projects: Provides practical experience working with real-world datasets and building a strong portfolio.
Expert Instructors: Learn from industry professionals with years of experience in data science and AI.
Career Support: Offers guidance and resources to help you launch your data science career.
Becoming a data scientist is a rewarding journey that blends technical expertise with analytical thinking. By focusing on developing these key skills and leveraging resources like Xaltius Academy's program, you can position yourself for a successful and impactful career in this in-demand field. The power of data is waiting to be unlocked – are you ready to take the challenge?
3 notes
·
View notes
Text

Wielding Big Data Using PySpark
Introduction to PySpark
PySpark is the Python API for Apache Spark, a distributed computing framework designed to process large-scale data efficiently. It enables parallel data processing across multiple nodes, making it a powerful tool for handling massive datasets.
Why Use PySpark for Big Data?
Scalability: Works across clusters to process petabytes of data.
Speed: Uses in-memory computation to enhance performance.
Flexibility: Supports various data formats and integrates with other big data tools.
Ease of Use: Provides SQL-like querying and DataFrame operations for intuitive data handling.
Setting Up PySpark
To use PySpark, you need to install it and set up a Spark session. Once initialized, Spark allows users to read, process, and analyze large datasets.
Processing Data with PySpark
PySpark can handle different types of data sources such as CSV, JSON, Parquet, and databases. Once data is loaded, users can explore it by checking the schema, summary statistics, and unique values.
Common Data Processing Tasks
Viewing and summarizing datasets.
Handling missing values by dropping or replacing them.
Removing duplicate records.
Filtering, grouping, and sorting data for meaningful insights.
Transforming Data with PySpark
Data can be transformed using SQL-like queries or DataFrame operations. Users can:
Select specific columns for analysis.
Apply conditions to filter out unwanted records.
Group data to find patterns and trends.
Add new calculated columns based on existing data.
Optimizing Performance in PySpark
When working with big data, optimizing performance is crucial. Some strategies include:
Partitioning: Distributing data across multiple partitions for parallel processing.
Caching: Storing intermediate results in memory to speed up repeated computations.
Broadcast Joins: Optimizing joins by broadcasting smaller datasets to all nodes.
Machine Learning with PySpark
PySpark includes MLlib, a machine learning library for big data. It allows users to prepare data, apply machine learning models, and generate predictions. This is useful for tasks such as regression, classification, clustering, and recommendation systems.
Running PySpark on a Cluster
PySpark can run on a single machine or be deployed on a cluster using a distributed computing system like Hadoop YARN. This enables large-scale data processing with improved efficiency.
Conclusion
PySpark provides a powerful platform for handling big data efficiently. With its distributed computing capabilities, it allows users to clean, transform, and analyze large datasets while optimizing performance for scalability.
For Free Tutorials for Programming Languages Visit-https://www.tpointtech.com/
2 notes
·
View notes
Text
My Experience with Database Homework Help from DatabaseHomeworkHelp.com
As a student majoring in computer science, managing the workload can be daunting. One of the most challenging aspects of my coursework has been database management. Understanding the intricacies of SQL, ER diagrams, normalization, and other database concepts often left me overwhelmed. That was until I discovered Database Homework Help from DatabaseHomeworkHelp.com. This service has been a lifesaver, providing me with the support and guidance I needed to excel in my studies.
The Initial Struggle
When I first started my database course, I underestimated the complexity of the subject. I thought it would be as straightforward as other programming courses I had taken. However, as the semester progressed, I found myself struggling with assignments and projects. My grades were slipping, and my confidence was waning. I knew I needed help, but I wasn't sure where to turn.
I tried getting assistance from my professors during office hours, but with so many students needing help, the time available was limited. Study groups with classmates were somewhat helpful, but they often turned into social gatherings rather than focused study sessions. I needed a more reliable and structured form of support.
Discovering DatabaseHomeworkHelp.com
One evening, while frantically searching for online resources to understand an especially tricky ER diagram assignment, I stumbled upon DatabaseHomeworkHelp.com. The website promised expert help on a wide range of database topics, from basic queries to advanced database design and implementation. Skeptical but hopeful, I decided to give it a try. It turned out to be one of the best decisions I’ve made in my academic career.
First Impressions
The first thing that struck me about DatabaseHomeworkHelp.com was the user-friendly interface. The website was easy to navigate, and I quickly found the section where I could submit my assignment. The process was straightforward: I filled out a form detailing my assignment requirements, attached the relevant files, and specified the deadline.
Within a few hours, I received a response from one of their database experts. The communication was professional and reassuring. They asked a few clarifying questions to ensure they fully understood my needs, which gave me confidence that I was in good hands.
The Quality of Help
What impressed me the most was the quality of the assistance I received. The expert assigned to my task not only completed the assignment perfectly but also provided a detailed explanation of the solutions. This was incredibly helpful because it allowed me to understand the concepts rather than just submitting the work.
For example, in one of my assignments, I had to design a complex database schema. The expert not only provided a well-structured schema but also explained the reasoning behind each table and relationship. This level of detail helped me grasp the fundamental principles of database design, something I had been struggling with for weeks.
Learning and Improvement
With each assignment I submitted, I noticed a significant improvement in my understanding of database concepts. The experts at DatabaseHomeworkHelp.com were not just solving problems for me; they were teaching me how to solve them myself. They broke down complex topics into manageable parts and provided clear, concise explanations.
I particularly appreciated their help with SQL queries. Writing efficient and effective SQL queries was one of the areas I found most challenging. The expert guidance I received helped me understand how to approach query writing logically. They showed me how to optimize queries for better performance and how to avoid common pitfalls.
Timely Delivery
Another aspect that stood out was their commitment to deadlines. As a student, timely submission of assignments is crucial. DatabaseHomeworkHelp.com always delivered my assignments well before the deadline, giving me ample time to review the work and ask any follow-up questions. This reliability was a significant relief, especially during times when I had multiple assignments due simultaneously.
Customer Support
The customer support team at DatabaseHomeworkHelp.com deserves a special mention. They were available 24/7, and I never had to wait long for a response. Whether I had a question about the pricing, needed to clarify the assignment details, or required an update on the progress, the support team was always there to assist me promptly and courteously.
Affordable and Worth Every Penny
As a student, budget is always a concern. I was worried that professional homework help would be prohibitively expensive. However, I found the pricing at DatabaseHomeworkHelp.com to be reasonable and affordable. They offer different pricing plans based on the complexity and urgency of the assignment, making it accessible for students with varying budgets.
Moreover, considering the quality of help I received and the improvement in my grades, I can confidently say that their service is worth every penny. The value I got from their expert assistance far outweighed the cost.
A Lasting Impact
Thanks to DatabaseHomeworkHelp.com, my grades in the database course improved significantly. But beyond the grades, the most valuable takeaway has been the knowledge and confidence I gained. I now approach database assignments with a clearer understanding and a more structured method. This confidence has also positively impacted other areas of my studies, as I am less stressed and more organized.
Final Thoughts
If you're a student struggling with database management assignments, I highly recommend Database Homework Help from DatabaseHomeworkHelp.com. Their expert guidance, timely delivery, and excellent customer support can make a significant difference in your academic journey. They don’t just provide answers; they help you understand the material, which is crucial for long-term success.
In conclusion, my experience with DatabaseHomeworkHelp.com has been overwhelmingly positive. The support I received has not only helped me improve my grades but also enhanced my overall understanding of database concepts. I am grateful for their assistance and will undoubtedly continue to use their services as I progress through my computer science degree.

7 notes
·
View notes
Text
Why Tableau is Essential in Data Science: Transforming Raw Data into Insights

Data science is all about turning raw data into valuable insights. But numbers and statistics alone don’t tell the full story—they need to be visualized to make sense. That’s where Tableau comes in.
Tableau is a powerful tool that helps data scientists, analysts, and businesses see and understand data better. It simplifies complex datasets, making them interactive and easy to interpret. But with so many tools available, why is Tableau a must-have for data science? Let’s explore.
1. The Importance of Data Visualization in Data Science
Imagine you’re working with millions of data points from customer purchases, social media interactions, or financial transactions. Analyzing raw numbers manually would be overwhelming.
That’s why visualization is crucial in data science:
Identifies trends and patterns – Instead of sifting through spreadsheets, you can quickly spot trends in a visual format.
Makes complex data understandable – Graphs, heatmaps, and dashboards simplify the interpretation of large datasets.
Enhances decision-making – Stakeholders can easily grasp insights and make data-driven decisions faster.
Saves time and effort – Instead of writing lengthy reports, an interactive dashboard tells the story in seconds.
Without tools like Tableau, data science would be limited to experts who can code and run statistical models. With Tableau, insights become accessible to everyone—from data scientists to business executives.
2. Why Tableau Stands Out in Data Science
A. User-Friendly and Requires No Coding
One of the biggest advantages of Tableau is its drag-and-drop interface. Unlike Python or R, which require programming skills, Tableau allows users to create visualizations without writing a single line of code.
Even if you’re a beginner, you can:
✅ Upload data from multiple sources
✅ Create interactive dashboards in minutes
✅ Share insights with teams easily
This no-code approach makes Tableau ideal for both technical and non-technical professionals in data science.
B. Handles Large Datasets Efficiently
Data scientists often work with massive datasets—whether it’s financial transactions, customer behavior, or healthcare records. Traditional tools like Excel struggle with large volumes of data.
Tableau, on the other hand:
Can process millions of rows without slowing down
Optimizes performance using advanced data engine technology
Supports real-time data streaming for up-to-date analysis
This makes it a go-to tool for businesses that need fast, data-driven insights.
C. Connects with Multiple Data Sources
A major challenge in data science is bringing together data from different platforms. Tableau seamlessly integrates with a variety of sources, including:
Databases: MySQL, PostgreSQL, Microsoft SQL Server
Cloud platforms: AWS, Google BigQuery, Snowflake
Spreadsheets and APIs: Excel, Google Sheets, web-based data sources
This flexibility allows data scientists to combine datasets from multiple sources without needing complex SQL queries or scripts.
D. Real-Time Data Analysis
Industries like finance, healthcare, and e-commerce rely on real-time data to make quick decisions. Tableau’s live data connection allows users to:
Track stock market trends as they happen
Monitor website traffic and customer interactions in real time
Detect fraudulent transactions instantly
Instead of waiting for reports to be generated manually, Tableau delivers insights as events unfold.
E. Advanced Analytics Without Complexity
While Tableau is known for its visualizations, it also supports advanced analytics. You can:
Forecast trends based on historical data
Perform clustering and segmentation to identify patterns
Integrate with Python and R for machine learning and predictive modeling
This means data scientists can combine deep analytics with intuitive visualization, making Tableau a versatile tool.
3. How Tableau Helps Data Scientists in Real Life
Tableau has been adopted by the majority of industries to make data science more impactful and accessible. This is applied in the following real-life scenarios:
A. Analytics for Health Care
Tableau is deployed by hospitals and research institutions for the following purposes:
Monitor patient recovery rates and predict outbreaks of diseases
Analyze hospital occupancy and resource allocation
Identify trends in patient demographics and treatment results
B. Finance and Banking
Banks and investment firms rely on Tableau for the following purposes:
✅ Detect fraud by analyzing transaction patterns
✅ Track stock market fluctuations and make informed investment decisions
✅ Assess credit risk and loan performance
C. Marketing and Customer Insights
Companies use Tableau to:
✅ Track customer buying behavior and personalize recommendations
✅ Analyze social media engagement and campaign effectiveness
✅ Optimize ad spend by identifying high-performing channels
D. Retail and Supply Chain Management
Retailers leverage Tableau to:
✅ Forecast product demand and adjust inventory levels
✅ Identify regional sales trends and adjust marketing strategies
✅ Optimize supply chain logistics and reduce delivery delays
These applications show why Tableau is a must-have for data-driven decision-making.
4. Tableau vs. Other Data Visualization Tools
There are many visualization tools available, but Tableau consistently ranks as one of the best. Here’s why:
Tableau vs. Excel – Excel struggles with big data and lacks interactivity; Tableau handles large datasets effortlessly.
Tableau vs. Power BI – Power BI is great for Microsoft users, but Tableau offers more flexibility across different data sources.
Tableau vs. Python (Matplotlib, Seaborn) – Python libraries require coding skills, while Tableau simplifies visualization for all users.
This makes Tableau the go-to tool for both beginners and experienced professionals in data science.
5. Conclusion
Tableau has become an essential tool in data science because it simplifies data visualization, handles large datasets, and integrates seamlessly with various data sources. It enables professionals to analyze, interpret, and present data interactively, making insights accessible to everyone—from data scientists to business leaders.
If you’re looking to build a strong foundation in data science, learning Tableau is a smart career move. Many data science courses now include Tableau as a key skill, as companies increasingly demand professionals who can transform raw data into meaningful insights.
In a world where data is the driving force behind decision-making, Tableau ensures that the insights you uncover are not just accurate—but also clear, impactful, and easy to act upon.
#data science course#top data science course online#top data science institute online#artificial intelligence course#deepseek#tableau
3 notes
·
View notes
Text
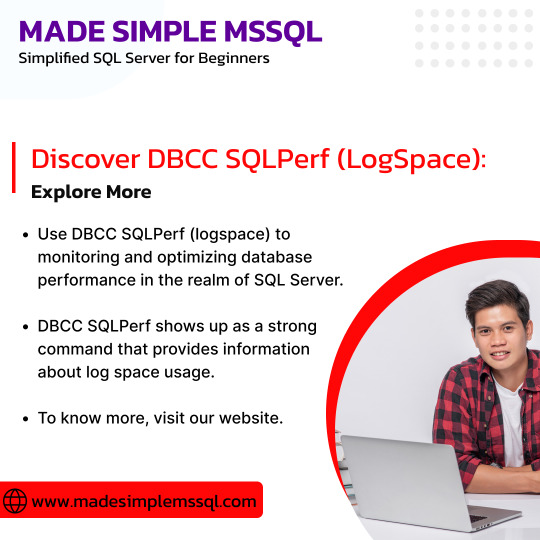
Use DBCC SQLPerf (logspace) to monitor and optimize database performance in SQL Server. Let's Explore: Let's Explore:
https://madesimplemssql.com/dbcc-sqlperf-logspace/
Please follow us on FB: https://www.facebook.com/profile.php?id=100091338502392
OR
Join our Group: https://www.facebook.com/groups/652527240081844
2 notes
·
View notes
Text
A Deep Dive into NOLOCK's Power and Pitfalls in SQL Server
In the realm of SQL Server management, the NOLOCK hint emerges as a quintessential tool for database administrators, aimed at enhancing query efficiency through the minimization of locking and blocking phenomena. This tool, however, is double-edged, necessitating a nuanced understanding and strategic deployment. This exploration ventures into the practical utilization of NOLOCK, enriched with…
View On WordPress
#database concurrency solutions#NOLOCK SQL Server#read uncommitted data#SQL performance optimization#SQL Server locking issues
0 notes
Text
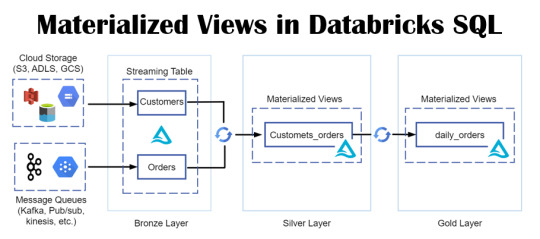
Empower Data Analysis with Materialized Views in Databricks SQL
Envision a realm where your data is always ready for querying, with intricate queries stored in a format primed for swift retrieval and analysis. Picture a world where time is no longer a constraint, where data handling is both rapid and efficient.
View On WordPress
#Azure#Azure SQL Database#data#Database#Database Management#Databricks#Databricks CLI#Databricks Delta Live Table#Databricks SQL#Databricks Unity catalog#Delta Live#Materialized Views#Microsoft#microsoft azure#Optimization#Performance Optimization#queries#SQL#SQL database#Streaming tables#tables#Unity Catalog#views
0 notes
Text

Unlock Seamless Performance with Windows Hosting Solutions
Experience the power of Windows Hosting, designed for businesses and developers who need seamless integration with Microsoft technologies. Enjoy optimized performance, easy management, and compatibility with .NET, SQL Server, and other Windows-based applications. Whether you're running a business site or deploying enterprise-level applications, our Windows hosting delivers speed, reliability, and full control."
2 notes
·
View notes
Text
Maximizing Business Insights with Power BI: A Comprehensive Guide for Small Businesses
Maximizing Business Insights Small businesses often face the challenge of making data-driven decisions without the resources of larger enterprises. Power BI, Microsoft's powerful analytics tool, can transform how small businesses use data, turning raw numbers into actionable insights. Here's a comprehensive guide to maximizing business insights with Power BI.
Introduction to Power BI
Power BI is a business analytics service by Microsoft that provides interactive visualizations and business intelligence capabilities. With an interface simple enough for end users to create their own reports and dashboards, it connects to a wide range of data sources.
Benefits for Small Businesses
1. User-Friendly Interface: Power BI's drag-and-drop functionality makes it accessible for users without technical expertise.
2. Cost-Effective: Power BI offers a free version with substantial features and a scalable pricing model for additional needs.
3. Real-Time Data: Businesses can monitor their operations with real-time data, enabling quicker and more informed decision-making.
Setting Up Power BI
1. Data Sources: Power BI can connect to various data sources such as Excel, SQL databases, and cloud services like Azure.
2. Data Modeling: Use Power BI to clean and transform data, creating a cohesive data model that forms the foundation of your reports.
3. Visualizations: Choose from a wide array of visualizations to represent your data. Customize these visuals to highlight the most critical insights.
Customizing Dashboards
1. Tailor to Needs: Customize dashboards to reflect the unique needs of your business, focusing on key performance indicators (KPIs) relevant to your goals.
2. Interactive Reports:Create interactive reports that allow users to explore data more deeply, providing a clearer understanding of underlying trends.
Real-World Examples
Several small businesses have successfully implemented Power BI to gain a competitive edge:
1. Retail: A small retail store used Power BI to track sales trends, optimize inventory, and identify peak shopping times.
2. Finance:A small financial advisory firm employed Power BI to analyze client portfolios, improving investment strategies and client satisfaction.
Integration with Existing Tools
Power BI seamlessly integrates with other Microsoft products such as Excel and Azure, as well as third-party applications, ensuring a smooth workflow and enhanced productivity.
Best Practices
1. Data Accuracy: Ensure data accuracy by regularly updating your data sources.
2. Training: Invest in training your team to use Power BI effectively.
3. Security: Implement robust security measures to protect sensitive data.
Future Trends
Power BI continues to evolve, with future updates likely to include more advanced AI features and enhanced data processing capabilities, keeping businesses at the forefront of technology.
Conclusion
Power BI offers small businesses a powerful tool to transform their data into meaningful insights. By adopting Power BI, businesses can improve decision-making, enhance operational efficiency, and gain a competitive advantage. Partnering with Vbeyond Digital ensures a smooth and successful implementation, maximizing the benefits of Power BI for your business. with Power BI: A Comprehensive Guide for Small Businesses
3 notes
·
View notes
Text
VPS Windows Hosting in India: The Ultimate Guide for 2024

In the ever-evolving landscape of web hosting, Virtual Private Servers (VPS) have become a preferred choice for both businesses and individuals. Striking a balance between performance, cost-effectiveness, and scalability, VPS hosting serves those seeking more than what shared hosting provides without the significant expense of a dedicated server. Within the myriad of VPS options, VPS Windows Hosting stands out as a popular choice for users who have a preference for the Microsoft ecosystem.
This comprehensive guide will explore VPS Windows Hosting in India, shedding light on its functionality, key advantages, its relevance for Indian businesses, and how to select the right hosting provider in 2024.
What is VPS Windows Hosting?
VPS Windows Hosting refers to a hosting type where a physical server is partitioned into various virtual servers, each operating with its own independent Windows OS. Unlike shared hosting, where resources are shared among multiple users, VPS provides dedicated resources, including CPU, RAM, and storage, which leads to enhanced performance, security, and control.
Why Choose VPS Windows Hosting in India?
The rapid growth of India’s digital landscape and the rise in online businesses make VPS hosting an attractive option. Here are several reasons why Windows VPS Hosting can be an optimal choice for your website or application in India:
Seamless Compatibility: Windows VPS is entirely compatible with Microsoft applications such as ASP.NET, SQL Server, and Microsoft Exchange. For websites or applications that depend on these technologies, Windows VPS becomes a natural option.
Scalability for Expanding Businesses: A notable advantage of VPS hosting is its scalability. As your website or enterprise grows, upgrading server resources can be done effortlessly without downtime or cumbersome migration. This aspect is vital for startups and SMEs in India aiming to scale economically.
Localized Hosting for Improved Speed: Numerous Indian hosting providers have data centers within the country, minimizing latency and enabling quicker access for local users, which is particularly advantageous for targeting audiences within India.
Enhanced Security: VPS hosting delivers superior security compared to shared hosting, which is essential in an era where cyber threats are increasingly prevalent. Dedicated resources ensure your data remains isolated from others on the same physical server, diminishing the risk of vulnerabilities.
Key Benefits of VPS Windows Hosting
Dedicated Resources: VPS Windows hosting ensures dedicated CPU, RAM, and storage, providing seamless performance, even during traffic surges.
Full Administrative Control: With Windows VPS, you gain root access, allowing you to customize server settings, install applications, and make necessary adjustments.
Cost Efficiency: VPS hosting provides the advantages of dedicated hosting at a more economical price point. This is incredibly beneficial for businesses looking to maintain a competitive edge in India’s market.
Configurability: Whether you require specific Windows applications or custom software, VPS Windows hosting allows you to tailor the server to meet your unique needs.
Managed vs. Unmanaged Options: Depending on your technical ability, you can opt for managed VPS hosting, where the provider manages server maintenance, updates, and security, or unmanaged VPS hosting, where you retain full control of the server and its management.
How to Select the Right VPS Windows Hosting Provider in India
With a plethora of hosting providers in India offering VPS Windows hosting, selecting one that meets your requirements is crucial. Here are several factors to consider:
Performance & Uptime: Choose a hosting provider that guarantees a minimum uptime of 99.9%. Reliable uptime ensures your website remains accessible at all times, which is crucial for any online venture.
Data Center Location: Confirm that the hosting provider has data centers located within India or in proximity to your target users. This will enhance loading speeds and overall user satisfaction.
Pricing & Plans: Evaluate pricing plans from various providers to ensure you’re receiving optimal value. Consider both initial costs and renewal rates, as some providers may offer discounts for longer commitments.
Customer Support: Opt for a provider that offers 24/7 customer support, especially if you lack an in-house IT team. Look for companies that offer support through various channels like chat, phone, and email.
Security Features: Prioritize providers offering robust security features such as firewall protection, DDoS mitigation, automatic backups, and SSL certificates.
Backup and Recovery: Regular backups are vital for data protection. Verify if the provider includes automated backups and quick recovery options for potential issues.
Top VPS Windows Hosting Providers in India (2024)
To streamline your research, here's a brief overview of some of the top VPS Windows hosting providers in India for 2024:
Host.co.in
Recognized for its competitive pricing and exceptional customer support, Host.co.in offers a range of Windows VPS plans catering to businesses of various sizes.
BigRock
Among the most well-known hosting providers in India, BigRock guarantees reliable uptime, superb customer service, and diverse hosting packages, including Windows VPS.
MilesWeb
MilesWeb offers fully managed VPS hosting solutions at attractive prices, making it a great option for businesses intent on prioritizing growth over server management.
GoDaddy
As a leading name in hosting, GoDaddy provides flexible Windows VPS plans designed for Indian businesses, coupled with round-the-clock customer support.
Bluehost India
Bluehost delivers powerful VPS solutions for users requiring high performance, along with an intuitive control panel and impressive uptime.
Conclusion
VPS Windows Hosting in India is an outstanding option for individuals and businesses in search of a scalable, cost-effective, and performance-oriented hosting solution. With dedicated resources and seamless integration with Microsoft technologies, it suits websites that experience growing traffic or require ample resources.
As we advance into 2024, the necessity for VPS Windows hosting is expected to persist, making it imperative to choose a hosting provider that can accommodate your developing requirements. Whether launching a new website or upgrading your existing hosting package, VPS Windows hosting is a strategic investment for the future of your online endeavors.
FAQs
Is VPS Windows Hosting costly in India?
While VPS Windows hosting is pricier than shared hosting, it is much more affordable than dedicated servers and many providers in India offer competitive rates, making it accessible for small and medium-sized enterprises.
Can I upgrade my VPS Windows Hosting plan easily?
Absolutely, VPS hosting plans provide significant scalability. You can effortlessly enhance your resources like CPU, RAM, and storage without experiencing downtime.
What type of businesses benefit from VPS Windows Hosting in India?
Businesses that demand high performance, improved security, and scalability find the most advantage in VPS hosting. It’s particularly ideal for sites that utilize Windows-based technologies like ASP.NET and SQL Server.
2 notes
·
View notes
Text
Business Analytics vs. Data Science: Understanding the Key Differences

In today's data-driven world, terms like "business analytics" and "data science" are often used interchangeably. However, while they share a common goal of extracting insights from data, they are distinct fields with different focuses and methodologies. Let's break down the key differences to help you understand which path might be right for you.
Business Analytics: Focusing on the Present and Past
Business analytics primarily focuses on analyzing historical data to understand past performance and inform current business decisions. It aims to answer questions like:
What happened?
Why did it happen?
What is happening now?
Key characteristics of business analytics:
Descriptive and Diagnostic: It uses techniques like reporting, dashboards, and data visualization to summarize and explain past trends.
Structured Data: It often works with structured data from databases and spreadsheets.
Business Domain Expertise: A strong understanding of the specific business domain is crucial.
Tools: Business analysts typically use tools like Excel, SQL, Tableau, and Power BI.
Focus: Optimizing current business operations and improving efficiency.
Data Science: Predicting the Future and Building Models
Data science, on the other hand, focuses on building predictive models and developing algorithms to forecast future outcomes. It aims to answer questions like:
What will happen?
How can we make it happen?
Key characteristics of data science:
Predictive and Prescriptive: It uses machine learning, statistical modeling, and AI to predict future trends and prescribe optimal actions.
Unstructured and Structured Data: It can handle both structured and unstructured data from various sources.
Technical Proficiency: Strong programming skills (Python, R) and a deep understanding of machine learning algorithms are essential.
Tools: Data scientists use programming languages, machine learning libraries, and big data technologies.
Focus: Developing innovative solutions, building AI-powered products, and driving long-term strategic initiatives.
Key Differences Summarized:

Which Path is Right for You?
Choose Business Analytics if:
You are interested in analyzing past data to improve current business operations.
You have a strong understanding of a specific business domain.
You prefer working with structured data and using visualization tools.
Choose Data Science if:
You are passionate about building predictive models and developing AI-powered solutions.
You have a strong interest in programming and machine learning.
You enjoy working with both structured and unstructured data.
Xaltius Academy's Data Science & AI Course:
If you're leaning towards data science and want to delve into machine learning and AI, Xaltius Academy's Data Science & AI course is an excellent choice. This program equips you with the necessary skills and knowledge to become a proficient data scientist, covering essential topics like:
Python programming
Machine learning algorithms
Data visualization
And much more!
By understanding the distinct roles of business analytics and data science, you can make an informed decision about your career path and leverage the power of data to drive success.
2 notes
·
View notes