#data analysis for science
Explore tagged Tumblr posts
Visit Tumblr Blog
Explore Tumblr blogs with no restrictions, modern design and the best experience.
Last Seen Tumblr Blogs


Fun Fact
Tumblr has been providing a Korean-language service since 2013.
Text
You know what’s super fun?
Doing data analysis on your WIP For Science™!
Good news, word count between Astarion POV and Gale POV is almost even.
Bad news, some of these chapters have gotten out of control.

Dunno if I’ll be able to iron out some of the discrepancies in the editing process or not. I’m getting to the point where I am just desperate to be done with it for fear of losing steam and abandoning it all together.
I am trying very hard not to just post it as is when I’m done. orz
YES, I AM VERY FUN AT PARTIES, OKAY???
#ancient books and horror stories#send help#we can have a little spreadsheet as a treat#and by we i mean me#I am THE LIFE of the party okay#bg3 fanfic#bg3#writing#data analysis for science
2 notes
·
View notes
Text
i love being a scientist scientist in one field and a citizen scientist in another, lmao. looking at my own research and thesis gives me a crisis, but at least my stress walks and procrastination give bio/enviro people a bunch of photos/observational data for their own work :')
#it's also particularly nice to just collect data and tag it without having to worry about any of the more stressful/difficult part of#research and analysis#zip quips#inaturalist#ebird#citizen science
17 notes
·
View notes
Text
Cardinal-O-Mat Data Science
Soooo I wanted to learn something data sciency. And I stumbled over David Kriesel's Wahl-O-Mat analyses and wanted to do the same but different. I, like you maybe, have stumbled over the cardinal-o-mat. Logical conclusion: Let's do data science without mama (I'm so sorry!) but with the cardinal-o-mat! (Of course, I also have done this with the Wahl-O-Mat.)
The Cluster Heatmap
Here we have a cluster heatmap. (Isn't she pretty? Actually not so much, there's a lot of grey there...)

On the right side, you can see the names of the cardinals, and on the bottom, you can see the names of the theses. (I was too lazy to make them look pretty.) Red means disagree, blue means agree (for colorblindness reasons). Grey means either that the cardinal was explicitly neutral to the question or that there was simply no data on his position regarding the thesis in the cardinal-o-mat.
The theses are as follows (in order of appearance in the cardinal-o-mat):
I'll spare you and not list all the cardinals' names.
female_deacons: Women should be admitted to the diaconate.
same_sex: Same-sex couples should continue to be allowed to receive blessings outside of liturgical celebrations.
celibacy: Priestly celibacy should become voluntary.
vetus_ordo: The celebration of the Old Latin Mass should remain restricted for the sake of church unity.
vatican_china: The secret agreement between the Vatican and the People's Republic of China on the appointment of bishops should be upheld.
synodal_church: The Catholic Church should be a synodal church in which more emphasis is placed on participation, inclusion and joint decision-making.
climate_change: The Catholic Church should get involved in climate protection because it is committed to God's creation and the protection of the most vulnerable.
humanae_vitae: The Catholic Church should reconsider its position on contraception.
communion_unmarried: Divorced and remarried persons should be admitted to communion in individual cases.
german_synode: The German Synodal Way, aiming at reforming the doctrine of faith and morals, should be regarded positively overall.
covid: Church closures and vaccination recommendations during the Covid-19 pandemic were right.
islam: Interfaith dialogue with Islam is important.
What do we see here?
Roughly speaking, the closer two cardinals or two theses are shown in the map, the more similar they are, and the further apart in the map, the more dissimilar. Because of this closeness of similar cardinals/theses, we get these blocks of blue and red (kinda. I mean, it could be much worse.).
I want to emphasize that I did not sort this by hand. Rather it was sorted by an algorithm with respect to a certain metric (here the Jaccard metric), which measures the "distance" between the cardinals and theses. The method used is (divisive) hierarchical clustering. At each step, a cluster is divided into two subsets such that their distance is maximized. You can see these steps in the lines on the top and left side. This is called a dendrogram.
What do we learn from this?
Damn good question! The amount of things to learn is somewhat limited, if we look at the amount of neutrals and non-opinions, also considering I did not seperate those two.
Since this is a non-serious setting, I think we can reasonably infer that a cardinal that has spoken in favor of a couple of the theses is also generally more open to those he has not voiced an opinion on, and similarly for the conservative ones. If you look at it like this, then it becomes quite clear that the blue, so the generally more open minded cardinals are in the majority. I would have loved to have a cardinal-o-mat for the previous conclave, because I have the hypothesis that there, the conservative cardinals might have had the majority and I would love to test this.
Something I find funny is that one of the theses that is most liked is the synodal_church one, which is about participation and joint decision making. One of the least liked ones is the german_synode one (only one agreement, thx Marx my homie), which tries to do exactly the participation and joint decision making.
I don't know what else we learn from this, I just think that a cluster heatmap is a neat way of visualising the positions of the cardinals wrt to the theses and since it is somewhat sorted, we learn something about their relation with each other.
If you can explain to me why there is this red block in the left bottom corner, please do! I thought it might have something to do with the metric I used but the map always looks similar or worse.
Also, maybe someone can explain to me which metric to use when.
#cardinal-o-mat#cardinalomat#kardinalomat#kardinal-o-mat#conclave#konklave#does this qualify as fanart? probably not. but as i was inspired by conclave (2024) maybe it qualifies as#fan work#data science#datascience#data analysis#conclave 2024#conclave (2024)#conclave 2025#conclave (2025)#python#programming
10 notes
·
View notes
Text
data analysis is rly like
it's so over we're so back it's so over we're so back it's so over
i know, i know, negative results don't make my work any less valid but cmon please give me something
#science#stem#stemblr#academia#studyblr#neuroscience#stem student#data#data analytics#data analysis#research
46 notes
·
View notes
Text
i hate you artificial intelligence i hate you chat gpt i hate you copilot i hate you meta ai i hate you "i'll look it up on chat gpt" i hate you photoshop generative fill i hate you "I'll just ask ai to summarize this" i hate you "in 5 years everything will use ai" I HATE YOU LOSS OF THE HUMAN TOUCH I HATE YOU COLD UNFEELING MACHINE
#julia.txt#im losing my MINDDDD#obligatory disclaimer as i am in science : this js about generative ai i love u ai for data analysis
31 notes
·
View notes
Text
they’re going to keep doing dnptwt reacts until it stops performing well (or it doesn’t fit their rebrand). it’s just a quick standard thing they can add to the rotation like gwf, tiktok, and sims that gets min >300K — if you don’t like it, don’t watch it! that’s how they know what content their audience responds well to!
#I wish they did yearly surveys like Hank does#so we could give detailed feedback#but I doubt they could do it as effectively since they don’t have as much of a background on data science/analysis#dan and phil#phan
7 notes
·
View notes
Text


11.02.24
Morning <3 I I hope you guys have a lovely day.
Going over my notes and reviewing my proposal this morning while enjoying the rainy weather.
Who’s your favorite artist atm?
#study motivation#study aesthetic#studyinspo#study notes#studyblr#study space#studyspo#study blog#studyspiration#student#notes#goodnotes#ipad#ipad notes#computer science#IT#data analysis#hozier#hozier to be alone#mine
63 notes
·
View notes
Text
Cornell quantum researchers have detected an elusive phase of matter, called the Bragg glass phase, using large volumes of X-ray data and a new machine learning data analysis tool. The discovery settles a long-standing question of whether this almost–but not quite–ordered state of Bragg glass can exist in real materials. The paper, "Bragg glass signatures in PdxErTe3 with X-ray diffraction Temperature Clustering (X-TEC)," is published in Nature Physics. The lead author is Krishnanand Madhukar Mallayya, a postdoctoral researcher in the Department of Physics in the College of Arts and Sciences (A&S). Eun-Ah Kim, professor of physics (A&S), is the corresponding author. The research was conducted in collaboration with scientists at Argonne National Laboratory and at Stanford University.
Continue Reading.
43 notes
·
View notes
Text
being good at my job is weird. i decided on friday to look at some voyager 2 data like dig into 40 year old data and i just knew how to do it. they’re going to let me organise a conference.
#to be clear i am looking at the voyager data to get a better understanding of the old papers#i wouldn’t do analysis on it without taking to one of the old science team guys#but literally i pitched a conference to a bunch of bigwigs at work and they’re just going to let me do it#my boss is starting to treat me like a peer instead of someone to mentor
7 notes
·
View notes
Text
youtube
Statistics - A Full Lecture to learn Data Science (2025 Version)
Welcome to our comprehensive and free statistics tutorial (Full Lecture)! In this video, we'll explore essential tools and techniques that power data science and data analytics, helping us interpret data effectively. You'll gain a solid foundation in key statistical concepts and learn how to apply powerful statistical tests widely used in modern research and industry. From descriptive statistics to regression analysis and beyond, we'll guide you through each method's role in data-driven decision-making. Whether you're diving into machine learning, business intelligence, or academic research, this tutorial will equip you with the skills to analyze and interpret data with confidence. Let's get started!
#education#free education#technology#educate yourselves#educate yourself#data analysis#data science course#data science#data structure and algorithms#youtube#statistics for data science#statistics#economics#education system#learn data science#learn data analytics#Youtube
4 notes
·
View notes
Text
biologists and other data people
keep the whimsy in your life and change the font in your Rstudio
your soul may be getting drained because R but look!
ITS THE MINECRAFT FONT
i die a bot less when i look at my R because of the minecraft font
8 notes
·
View notes
Text
Understanding Outliers in Machine Learning and Data Science

In machine learning and data science, an outlier is like a misfit in a dataset. It's a data point that stands out significantly from the rest of the data. Sometimes, these outliers are errors, while other times, they reveal something truly interesting about the data. Either way, handling outliers is a crucial step in the data preprocessing stage. If left unchecked, they can skew your analysis and even mess up your machine learning models.
In this article, we will dive into:
1. What outliers are and why they matter.
2. How to detect and remove outliers using the Interquartile Range (IQR) method.
3. Using the Z-score method for outlier detection and removal.
4. How the Percentile Method and Winsorization techniques can help handle outliers.
This guide will explain each method in simple terms with Python code examples so that even beginners can follow along.
1. What Are Outliers?
An outlier is a data point that lies far outside the range of most other values in your dataset. For example, in a list of incomes, most people might earn between $30,000 and $70,000, but someone earning $5,000,000 would be an outlier.
Why Are Outliers Important?
Outliers can be problematic or insightful:
Problematic Outliers: Errors in data entry, sensor faults, or sampling issues.
Insightful Outliers: They might indicate fraud, unusual trends, or new patterns.
Types of Outliers
1. Univariate Outliers: These are extreme values in a single variable.
Example: A temperature of 300°F in a dataset about room temperatures.
2. Multivariate Outliers: These involve unusual combinations of values in multiple variables.
Example: A person with an unusually high income but a very low age.
3. Contextual Outliers: These depend on the context.
Example: A high temperature in winter might be an outlier, but not in summer.
2. Outlier Detection and Removal Using the IQR Method
The Interquartile Range (IQR) method is one of the simplest ways to detect outliers. It works by identifying the middle 50% of your data and marking anything that falls far outside this range as an outlier.
Steps:
1. Calculate the 25th percentile (Q1) and 75th percentile (Q3) of your data.
2. Compute the IQR:
{IQR} = Q3 - Q1
Q1 - 1.5 \times \text{IQR}
Q3 + 1.5 \times \text{IQR} ] 4. Anything below the lower bound or above the upper bound is an outlier.
Python Example:
import pandas as pd
# Sample dataset
data = {'Values': [12, 14, 18, 22, 25, 28, 32, 95, 100]}
df = pd.DataFrame(data)
# Calculate Q1, Q3, and IQR
Q1 = df['Values'].quantile(0.25)
Q3 = df['Values'].quantile(0.75)
IQR = Q3 - Q1
# Define the bounds
lower_bound = Q1 - 1.5 * IQR
upper_bound = Q3 + 1.5 * IQR
# Identify and remove outliers
outliers = df[(df['Values'] < lower_bound) | (df['Values'] > upper_bound)]
print("Outliers:\n", outliers)
filtered_data = df[(df['Values'] >= lower_bound) & (df['Values'] <= upper_bound)]
print("Filtered Data:\n", filtered_data)
Key Points:
The IQR method is great for univariate datasets.
It works well when the data isn’t skewed or heavily distributed.
3. Outlier Detection and Removal Using the Z-Score Method
The Z-score method measures how far a data point is from the mean, in terms of standard deviations. If a Z-score is greater than a certain threshold (commonly 3 or -3), it is considered an outlier.
Formula:
Z = \frac{(X - \mu)}{\sigma}
is the data point,
is the mean of the dataset,
is the standard deviation.
Python Example:
import numpy as np
# Sample dataset
data = {'Values': [12, 14, 18, 22, 25, 28, 32, 95, 100]}
df = pd.DataFrame(data)
# Calculate mean and standard deviation
mean = df['Values'].mean()
std_dev = df['Values'].std()
# Compute Z-scores
df['Z-Score'] = (df['Values'] - mean) / std_dev
# Identify and remove outliers
threshold = 3
outliers = df[(df['Z-Score'] > threshold) | (df['Z-Score'] < -threshold)]
print("Outliers:\n", outliers)
filtered_data = df[(df['Z-Score'] <= threshold) & (df['Z-Score'] >= -threshold)]
print("Filtered Data:\n", filtered_data)
Key Points:
The Z-score method assumes the data follows a normal distribution.
It may not work well with skewed datasets.
4. Outlier Detection Using the Percentile Method and Winsorization
Percentile Method:
In the percentile method, we define a lower percentile (e.g., 1st percentile) and an upper percentile (e.g., 99th percentile). Any value outside this range is treated as an outlier.
Winsorization:
Winsorization is a technique where outliers are not removed but replaced with the nearest acceptable value.
Python Example:
from scipy.stats.mstats import winsorize
import numpy as np
Sample data
data = [12, 14, 18, 22, 25, 28, 32, 95, 100]
Calculate percentiles
lower_percentile = np.percentile(data, 1)
upper_percentile = np.percentile(data, 99)
Identify outliers
outliers = [x for x in data if x < lower_percentile or x > upper_percentile]
print("Outliers:", outliers)
# Apply Winsorization
winsorized_data = winsorize(data, limits=[0.01, 0.01])
print("Winsorized Data:", list(winsorized_data))
Key Points:
Percentile and Winsorization methods are useful for skewed data.
Winsorization is preferred when data integrity must be preserved.
Final Thoughts
Outliers can be tricky, but understanding how to detect and handle them is a key skill in machine learning and data science. Whether you use the IQR method, Z-score, or Wins
orization, always tailor your approach to the specific dataset you’re working with.
By mastering these techniques, you’ll be able to clean your data effectively and improve the accuracy of your models.
#science#skills#programming#bigdata#books#machinelearning#artificial intelligence#python#machine learning#data centers#outliers#big data#data analysis#data analytics#data scientist#database#datascience#data
4 notes
·
View notes
Text

Pickl.AI offers a comprehensive approach to data science education through real-world case studies and practical projects. By working on industry-specific challenges, learners gain exposure to how data analysis, machine learning, and artificial intelligence are applied to solve business problems. The hands-on learning approach helps build technical expertise while developing critical thinking and problem-solving abilities. Pickl.AI’s programs are designed to prepare individuals for successful careers in the evolving data-driven job market, providing both theoretical knowledge and valuable project experience.
#Pickl.AI#data science#data science certification#data science case studies#machine learning#AI#artificial intelligence#data analytics#data science projects#career in data science#online education#real-world data science#data analysis#big data#technology
2 notes
·
View notes
Text
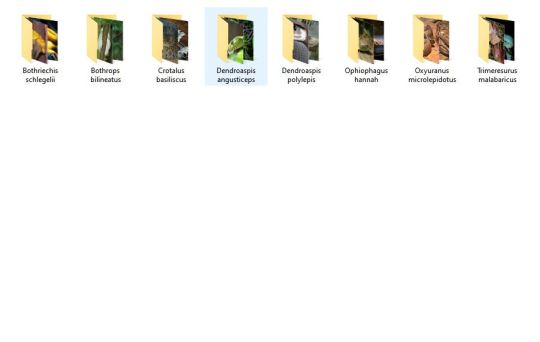
Tonight I am hunting down venomous and nonvenomous snake pictures that are under the creative commons of specific breeds in order to create one of the most advanced, in depth datasets of different venomous and nonvenomous snakes as well as a test set that will include snakes from both sides of all species. I love snakes a lot and really, all reptiles. It is definitely tedious work, as I have to make sure each picture is cleared before I can use it (ethically), but I am making a lot of progress! I have species such as the King Cobra, Inland Taipan, and Eyelash Pit Viper among just a few! Wikimedia Commons has been a huge help!
I'm super excited.
Hope your nights are going good. I am still not feeling good but jamming + virtual snake hunting is keeping me busy!
#programming#data science#data scientist#data analysis#neural networks#image processing#artificial intelligence#machine learning#snakes#snake#reptiles#reptile#herpetology#animals#biology#science#programming project#dataset#kaggle#coding
43 notes
·
View notes
Text
A note on Katharine Birbalsingh and Michaela Community School
The media narrative surrounding Michaela Community School in London mostly goes like this: Katharine Birbalsingh transforms poor inner-city (read: ethnic minority) children into academic superstars through the power of discipline. Thomas Chatterton Williams’s recent essay (full text here) in The Atlantic is merely the latest in a long line of fawning profiles that tout, implicitly or explicitly, Birbalsingh's iron fist as the solution to all that ails Britain. However, no article I have read so far has investigated other explanations for Michaela's high Progress 8 score nor endeavored to deconstruct the popular narrative surrounding the conservative superstar.
Williams begins the body of this piece by pointing out that Michaela “draws nearly all its students from Wembley, one of the poorest districts in London” in an apparent attempt to cast them as would-be low achievers, if not for Birbalsingh’s intervention. Although the characteristics of the individual pupils who attend Michaela have a greater impact on results than those of the school's neighborhood, he doesn’t bother to investigate how they differ. Among Michaela pupils who sat GCSEs over the past three years and whose prior attainment at Key Stage 2 (measured by an exam at the end of primary school) were available, 31% were high achieving, 53% were middle achieving, and only the remaining 16% were low achieving. For those who are uninterested in learning the nuances of British exam scoring, that means Michaela’s pupils were exceptionally bright even before they entered the school.
Birbalsingh furthers her savior narrative by describing Michaela's intake with unquantifiable terms such as "challenging" or "inner-city." However, only 28 of Michaela's 2024 GCSE takers (24%) were disadvantaged per the government's definition, "those who were eligible for free school meals at any time during the last 6 years and children looked after," in line with the national average of 25%. Although Birbalsingh likes to advance the narrative that she improves the academic performance of poor children—to be fair, she does, at a rate of roughly 30 individuals per year—she mostly improves the GCSE performance of middle class children.
Michaela's pupils are also self selecting, and therefore they are not representative of pupils in Wembley, London, or the UK as a whole. Any pupil who wishes to attend state secondary school in London must fill out a form indicating their top six choices, and they will be placed in one of those schools based on geography, demand, and availability. A pupil who does not wish to attend Michaela can leave it off their application, guaranteeing they won't attend. Therefore, Michaela is left with an intake of pupils who largely want to be there. By my calculations, Michaela's classwork and homework demand just over 49 hours of work each week. Although this does lead to good results, many teenagers would not abide by this; the 40-hour workweek is taxing even for most adults, who are blessed with more waking hours. Michaela's model and results cannot be easily repeated at any given school—at least not without systematic exclusion.
Williams unintentionally misrepresents a statistic when he asserts that “More than 80 percent of Michaela graduates continue their studies at Russell Group Universities.” He lacks a sufficiently deep understanding of the British school system to interpret this figure. While Michaela’s website states that 82% of its 2021 sixth form alumni attended a Russell Group university, it does not provide data on the university attendance of graduates from its secondary school, the disciplinarian institution which Williams profiles.
In the UK, sixth form (years 12 and 13, spent studying for A-levels) is separate from secondary school (years 7 through 11; the last 2 years, KS4, are spent studying for GCSEs). For Michaela, this also means a different admissions process. While there are no academic minimums to enroll in the secondary school, the sixth form requires an impressive average GCSE score of 7. Michaela has the capacity to enroll 120 students in each year of sixth form. However, the sixth form was under-enrolled by half in 2024. Michaela is a publicly-funded school, so this begs the question as to why state resources are not being utilized to their maximum capacity. The sixth form could educate more students simply by lowering GCSE requirements, but that would of course lead to less impressive university admissions—the kind that may not be displayed on Michaela’s home page. It is also possible that some secondary teachers would be pulled away to teach A-level subjects, worsening GCSE results, but that is speculation.
Thus far, all discussions of Michaela’s results have been woefully incomplete because they have not examined the effect of its narrow curriculum on its exam scores, instead focusing on the behaviorism that makes Birbalsingh’s authoritarian acolytes salivate. Williams's article is no different, only mentioning in passing that she believes “the national curriculum might force her to lower her own standards.” Depending on what changes the new Labour government implements, a revised national curriculum may indeed clash with Michaela’s philosophy. The school directs virtually all of its resources toward preparing pupils for its narrow selection of GCSE subjects or the few non-GCSE subjects that are required by the current national curriculum, such as PSHE, music theory, or PE. Birbalsingh is so focused on GCSE revision that she does not even believe volunteer work to be a "financially viable" option for Michaela pupils. Michaela's extra-curricular clubs all have a marginal cost of practically zero. In fact, several of them directly support curricular subjects, so they should rightfully be considered part of GCSE preparation.
A narrow curriculum obviously allows pupils to spend more time studying each GCSE subject they sit, thereby increasing their exam scores. Since most of the GCSE-level classes that Michaela offers are mandatory, pupils have little freedom to choose their own subjects (more on that later). Aside from that, cohort sizes stay remarkably close to 120 from year to year, and the school seems to impose a soft cap on classes of 30 pupils (120 / 4 = 30), so Michaela can hire the exact number of teachers it needs each year on a full-time basis. The school never needs to "waste" money hiring teachers for undersubscribed subjects, so it can also raise test scores by investing more in its core subjects than schools with broader curricula can afford to. On the flip side, Michaela does not offer dramatic arts, orchestra, individual sciences, computing, design and technology, foreign languages besides French, or a whole host of other popular subjects at the GCSE level. Other schools could easily raise their GCSE scores by slashing their curricula down to Michaela levels, but they offer a variety of classes because they care about their pupils experiencing joy and exploring a variety of career paths more than they care about their P8 scores.
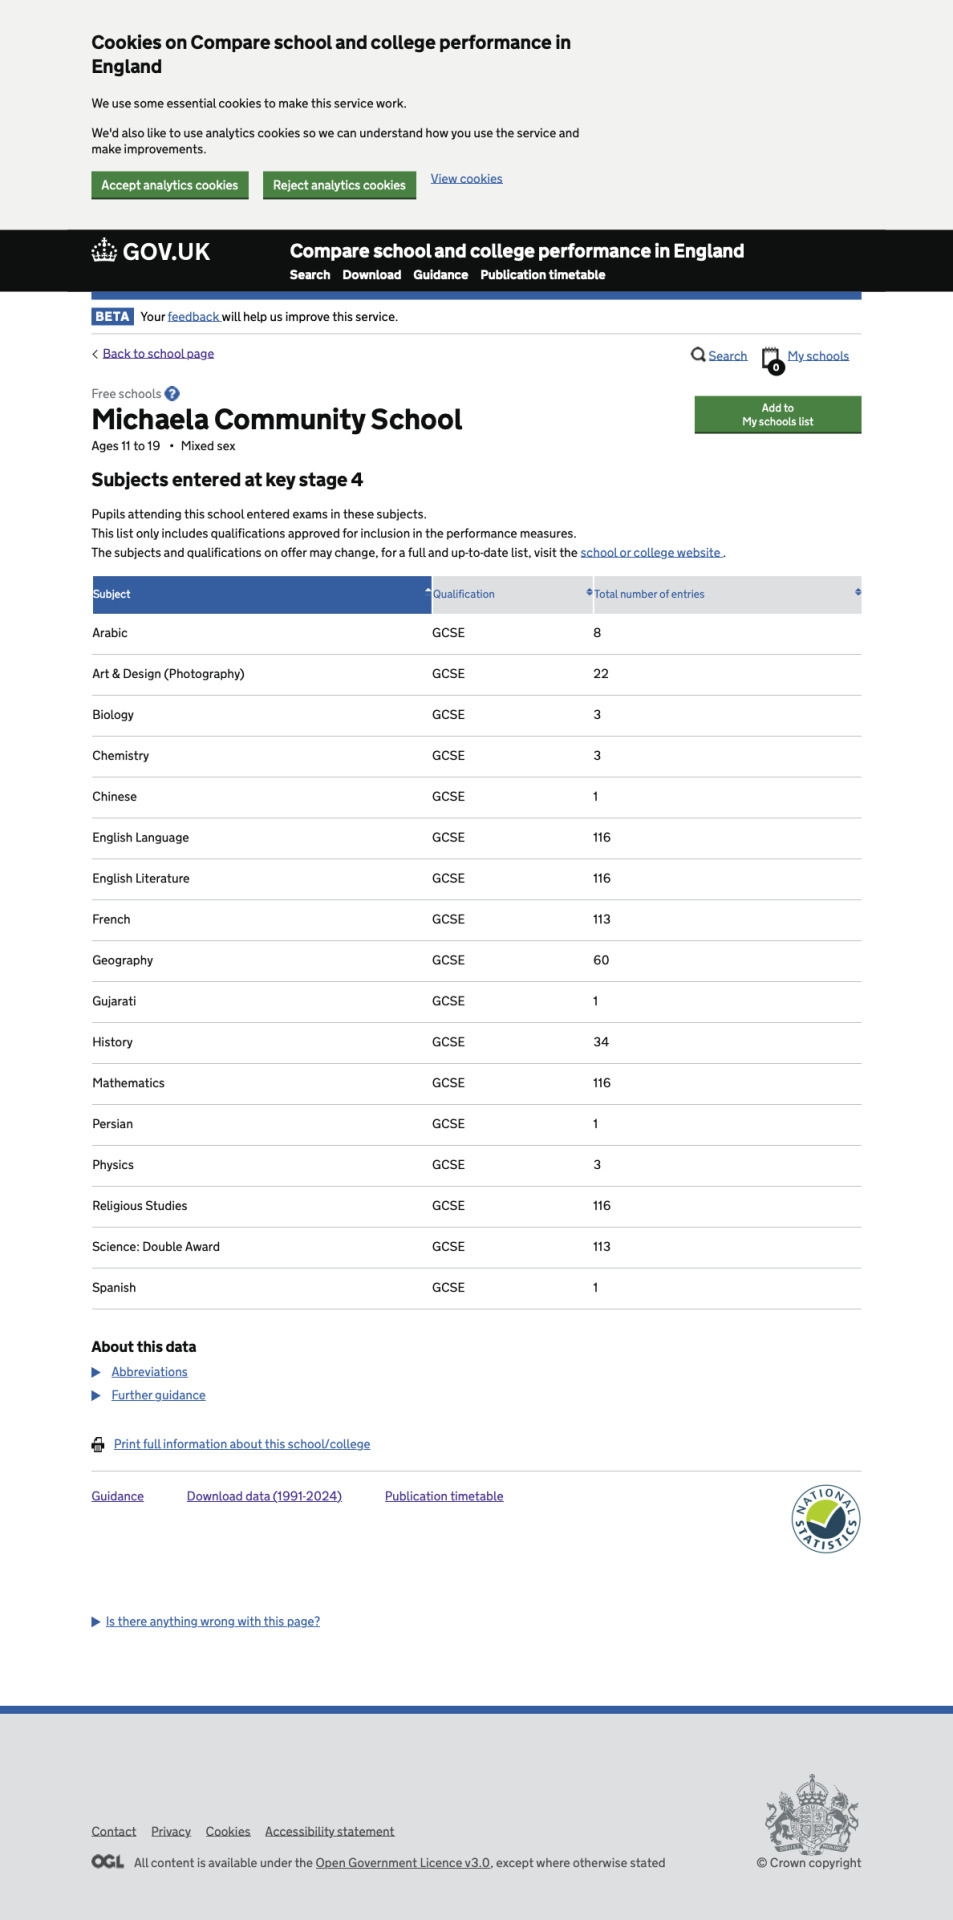
For years, all of Michaela’s pupils have studied the same subjects at GCSE with some slight variations. A handful of pupils always sit for exams in heritage languages, but otherwise, the following paragraphs demonstrate approximately how the subject breakdown has looked over the past three years. (Earlier data has been distorted by COVID, or it is incomplete or outdated.) At the time of publication, 2024 data can be found here, while older results can be accessed through the link “Download data (1991-2024)”.
- 2022: 100% of pupils: English language, English literature, combined science, mathematics, religious studies. ~75%: French, geography/history. ~25%: Citizenship. ~25%: Art & design: photography, art & design: fine art. (I had to recreate this year from memory because individual subject entries do not appear to be retained in older data, but it is accurate to the best of my recollection.)
- 2023: 100% of pupils: English language, English literature, combined science, mathematics, religious studies. ~75%: French, geography/history. ~25%: Art & design: photography, art & design: fine art.
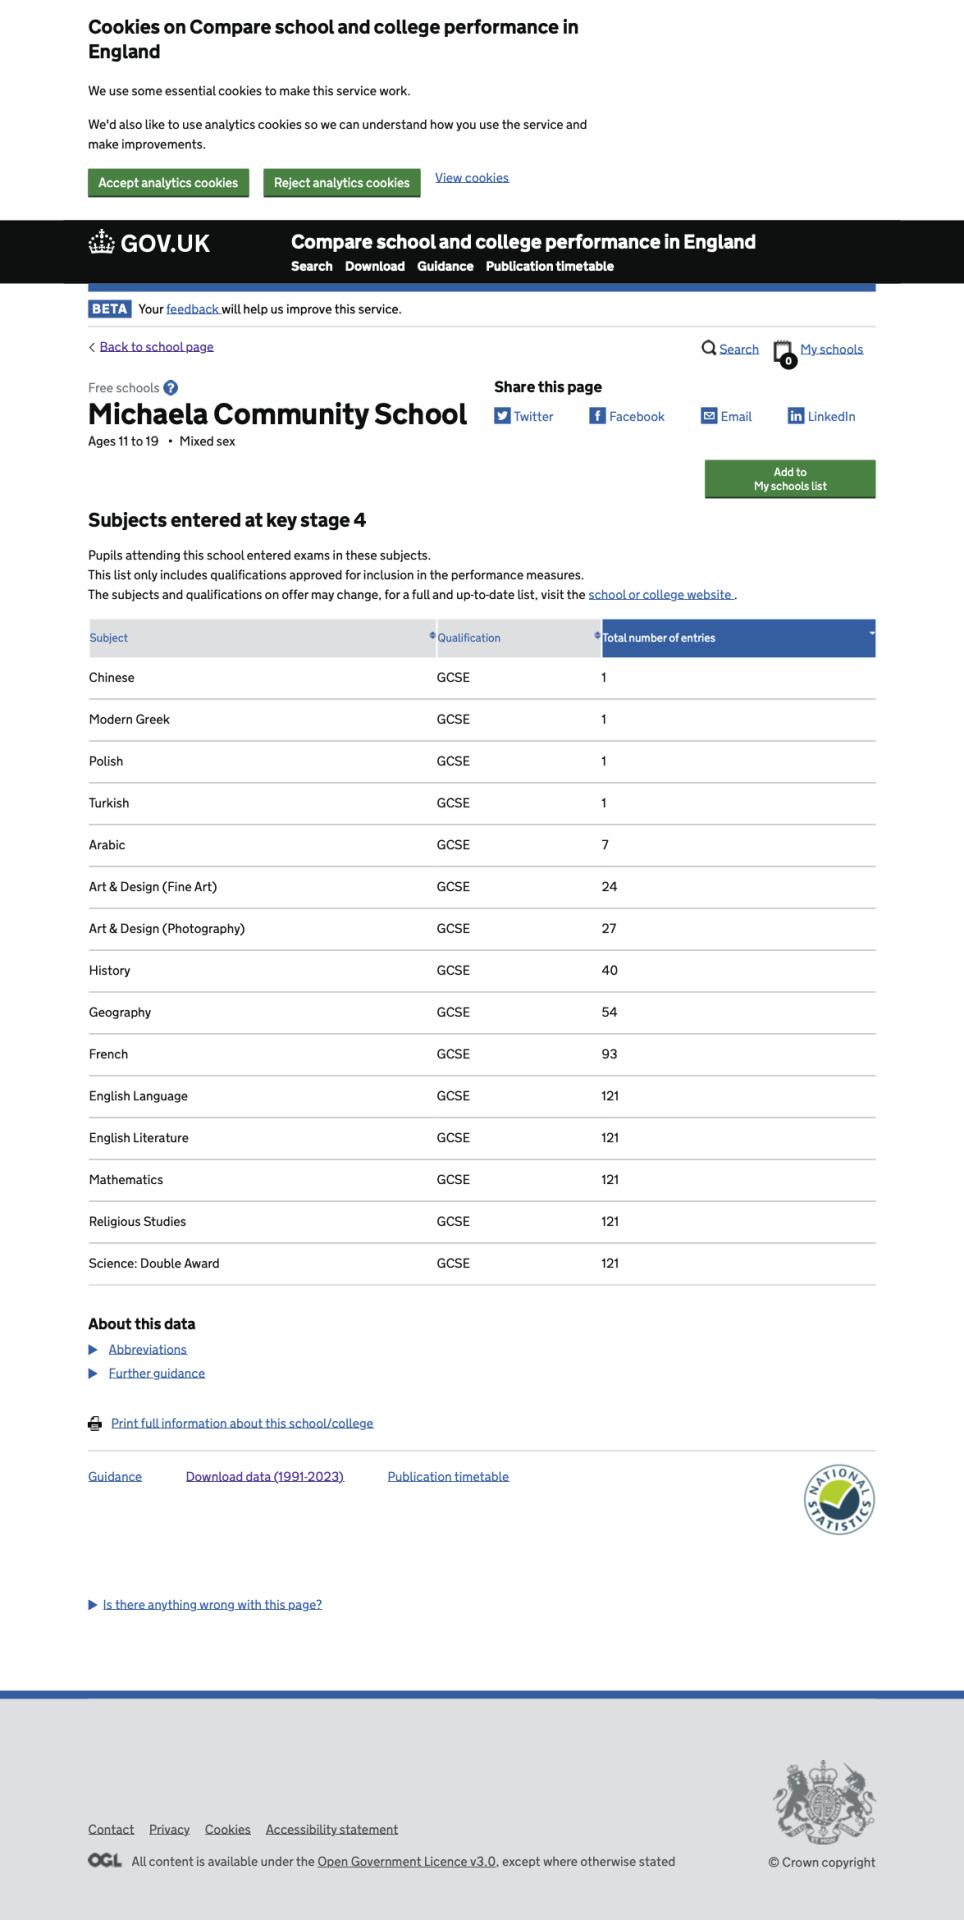
- 2024: 100% of pupils: English language, English literature, combined science, mathematics, religious studies, French. * ~80%: Geography/history. ~20%: Art & design: photography.
*This year, 3 pupils sat for biology, chemistry, and physics separately instead of taking combined science, but there is no explanation for this on Michaela's website.
Each year, about 90 Michaela pupils enter for the EBacc, a set of GCSE subjects encouraged by the British government. This usually works out to 75% of a cohort, but in 2024 it was 81% (94 pupils) because the cohort size was smaller than usual at only 116 pupils. Still, that means the largest class of EBacc entrants was only 32, in line with Michaela's projected class size of 30—despite Birbalsingh asserting that "class size matters little for success." Although the school comparison website does not list subject selections for individual pupils, it was easy to see how subjects were combined by cross-referencing exam entries per pupil and total entries per subject.
In 2021-2022, the pupils who did not enter for EBacc studied citizenship but neither French nor humanities. The study of art did not appear to correlate with EBacc entry.
In 2022-2023, the pupils who did not enter for EBacc studied photography and fine art but neither French nor humanities. Citizenship was dropped from the curriculum.
In 2023-2024, the pupils who did not enter for the EBacc studied photography but not humanities.
EBacc entry varies little across different pupil demographics such as gender, disadvantage, or English as an additional language. However, there is one characteristic that strongly determines EBacc entry at Michaela: prior attainment (PA). Over the past three years, out of 323 pupils for whom the PA data is available, 23% of low-PA pupils have entered the EBacc. This number is 83% for middle PA and 99% for high PA. According to my statistical analysis, the chance of these disparate "choices" arising without intervention is less than one percent.
At the end of Key Stage 3, Michaela staff pick approximately the top 75% of performers to enter for EBacc and require the lowest 25% to study other subjects.
This explains why only a few low-PA pupils enter for EBacc: although they are likely to remain in the bottom of their cohort throughout their schooling, some may improve enough to enter the top three quartiles. Although I am fully confident that my statistical analysis supports my assertion that Michaela pupils are not permitted to choose their GCSE subjects, the school has never disclosed a rationale for this practice, so the remainder of this essay will be speculation, not fact.
Michaela frequently boasts of its high Progress 8 (P8) score, and in order to understand my hypotheses, I recommend you familiarize yourself with its calculation. P8 is calculated by comparing actual Attainment 8 (A8) scores with expected scores based on Key Stage 2 (KS2) performance. This PDF explains how A8 scores are derived. (For my purposes, I will count double science as 2 GCSE subjects.) Therefore, a school with a non-selective intake such as Michaela can only change its P8 score by changing its A8 score.
Over the past few years, Michaela has refined its placement technique, presumably to increase its A8 scores. Pupils of any ability were permitted to study art at the GCSE level in 2022, but that option was removed the next year, probably so that high performers could devote more energy to EBacc subjects. Low performers who would have studied citizenship in 2022 instead studied art in 2023. Perhaps a part-time citizenship teacher would no longer be needed, and more resources could be directed to core subjects. All pupils studied GCSE French for the first time in 2024, giving each pupil 3 EBacc qualifications and finally maximizing A8 scores. However, the poorest performing 25% did not study humanities at KS4. This meant that approximately 120 * 2 * (1 - 0.25) = 180 pupils did study humanities at KS4, so with a typical class size of 30 and 6 class periods per day, one teacher could have accommodated all of them. If poor performers had studied humanities as well, hiring another teacher may have been necessary (and we already know how protective Michaela is of its budget).
The curricula for high and low performers are now identical, except for poor performers studying photography instead of humanities. Working from the assumption that Michaela intends to maximize its A8 score, this leads to one or two conclusions: it believes that poor performers will score higher on photography than French, and/or it does not want to expend humanities resources on poor performers because allocating them exclusively to high performers will raise the A8 score more. Similarly, no Michaela pupil has entered for more than 8 GCSE subjects (barring heritage languages, which do not demand too much revision time) since 2022, almost certainly to improve A8 scores. A limited class schedule allows pupils to devote more revision time to each core subject, while more exams would not raise A8, even if they did expand pupils’ horizons.
In the matter of GCSE curriculum, Michaela’s website is outdated and incomplete. It still enumerates the KS4 fine art curriculum, even though the subject was not offered at the GCSE level in 2024. It doesn’t mention that only three-quarters of pupils will study GCSE history or geography, so some parents who expect their children to study the humanities past age 13 may be in for a nasty surprise. Of course, this begs the question, what does Michaela have to hide?
It is difficult to understand how these prescribed schedules advantage Michaela’s pupils. Does the school not enroll maths whizzes who are determined to enter for mathematics, further mathematics, and physics at A-level, but who want one last artistic hurrah before starting sixth form? Are none of the poor performers averse enough to art that they'd prefer history? These prescriptions do not necessarily benefit Michaela’s pupils, but they do benefit the school’s P8.
Finally, Williams closes his article on a nostalgic note, contrasting his childhood with that of the Michaela pupil: “…my friends and I were free—luxuriously so—in ways these children possibly couldn’t even imagine. But that freedom that so many underprivileged and minority children bask in isn’t worth a damn thing if it leads to an adulthood boxed in by self-inflicted limitations.” Since the author was raised by college graduate parents and educated in private schools, and he is now a successful writer, he seems to believe that children who grow up rich can thrive on freedom, but the same is not true of the poor. Birbalsingh similarly believes that disadvantaged children need extreme discipline to succeed. However, she does not want to create a world where child poverty is eradicated so that every pupil can experience freedom, joy, and success at the same time. In fact, she envisions the opposite. She has spoken out against free meals for primary schoolers because she believes (without evidence!) that it would somehow make their parents less responsible. Even this concern were legitimate, it would pale in comparison to the necessity of feeding hungry children.
In the end, my dislike of Birbalsingh stems from her incredibly bleak worldview. She maintains that children should face the threat of starvation so their parents will be motivated to work harder. Even when testifying before Parliament, she believes the sexism that drives differences in A-level subject choices should remain unexamined. She propagates furry hoaxes—originally spread to mock trans people—to exemplify a supposed lack of discipline from parents. She believes if you don’t decorate your house for Christmas, you are destroying the country, and it is also somehow Vishnu’s problem (yes, the letter is truly that bizarre, and I recommend reading it for full effect). In her ideal world, she imagines suffering for suffering’s sake, a boot stamping on a human face—forever.
#katharine birbalsingh#birbalsingh#michaela community school#michaela#politics#british politics#uk politics#essay#longform#long form#data science#statistics#statistical analysis#education#education system#uk education#education uk#british education#united kingdom#london#wembley#i am a girl who likes hard maths
3 notes
·
View notes
Text
Mars Crater Study-1
This article was written as a practice exercise with reference to the information provided in the COURSERA course, specifically the Mars Crater Study.
=========================================
My program,
import pandas as pd
import statsmodels.formula.api as smf
# Set display format
pd.set_option('display.float_format', lambda x: '%.2f' % x)
# Read dataset
data = pd.read_csv('marscrater_pds.csv')
# Convert necessary variables to numeric format
data['DIAM_CIRCLE_IMAGE'] = pd.to_numeric(data['DIAM_CIRCLE_IMAGE'], errors='coerce')
data['DEPTH_RIMFLOOR_TOPOG'] = pd.to_numeric(data['DEPTH_RIMFLOOR_TOPOG'], errors='coerce')
# Perform basic linear regression analysis
print("OLS regression model for the association between crater diameter and depth")
reg1 = smf.ols('DEPTH_RIMFLOOR_TOPOG ~ DIAM_CIRCLE_IMAGE', data=data).fit()
print(reg1.summary())
=========================================
Output results,
Dep. Variable: DEPTH_RIMFLOOR_TOPOG
R-squared:0.344
Model: OLS
Adj. R-squared:0.344
Method:Least Squares
F-statistic:2.018e+05
Date:Thu, 27 Mar 2025
Prob (F-statistic):0.00
Time:14:58:20
Log-Likelihood:1.1503e+05
No. Observations:384343
AIC:-2.301e+05
Df Residuals:384341
BIC:-2.300e+05
Df Model: 1
Covariance Type:nonrobust
coef std err t P>|t| [0.025 0.975]
Intercept 0.0220 0.000 70.370 0.000 0.021 0.023
DIAM_CIRCLE_IMAGE
0.0151 3.37e-05 449.169 0.000 0.015 0.015
Omnibus:390327.615
Durbin-Watson:1.276
Prob(Omnibus):0.000
Jarque-Bera (JB):4086668077.223
Skew: -3.506
Prob(JB):0.00
Kurtosis:508.113
Cond. No.10.1
=========================================
Results Summary:
Regression Model Results:
R-squared: 0.344, indicating that the model explains approximately 34.4% of the variability in crater depth.
Regression Coefficient (DIAMCIRCLEIMAGE): 0.0151, meaning that for each unit increase in crater diameter, the depth increases by an average of 0.0151 units.
p-value: 0.000, indicating that the effect of diameter on depth is statistically significant.
Intercept: 0.0220, which is the predicted crater depth when the diameter is zero.
Conclusion:
The analysis shows a significant positive association between crater diameter and depth. While the model provides some explanatory power, other factors likely influence crater depth, and further exploration is recommended.
2 notes
·
View notes