#data modeling with Power BI
Explore tagged Tumblr posts
Visit Tumblr Blog
Explore Tumblr blogs with no restrictions, modern design and the best experience.
Last Seen Tumblr Blogs


Fun Fact
69% of Tumblr users are millennials.
Text
Maximizing Report Creation: A Comparison of Power BI and Tableau Migration
Introduction: The Evolution of Business Intelligence
In the fast-paced business world, data visualization plays a pivotal role in driving strategic decisions. The choice of a business intelligence (BI) tool significantly impacts how organizations analyze and present their data. With technology continuously evolving, staying ahead with cutting-edge BI solutions is crucial for maintaining a competitive edge.
If you are currently using Tableau but are considering a switch to Power BI, you may be wondering whether it’s worth the effort. In this blog, we’ll guide you through the transition process, explore the key advantages of Power BI, and highlight best practices to ensure a smooth migration.
Data Source Connection: New Beginnings vs. Existing Connections
Building from Scratch: In Power BI, starting fresh with report creation means establishing new data connections.
Migration from Tableau: During migration, you connect to the pre-existing data sources that were used in Tableau, ensuring continuity and reducing the need for data reconfiguration.
Rebuilding in Power BI: Replication vs. New Creation
Building from Scratch: Creating reports from scratch allows full customization of visualizations and structure without constraints from existing designs, giving greater creative freedom.
Migration from Tableau: Migration requires replicating Tableau’s reports and visualizations, often involving reverse-engineering the work done in Tableau to rebuild similar dashboards and reports in Power BI.
Read More about Why Move from Tableau to Power BI: Key Benefits Explained
Translating Logic: Adapting Tableau’s Logic to DAX in Power BI
Building from Scratch: When creating reports from scratch, you have the flexibility to design new calculations using Power BI’s DAX language.
Migration from Tableau: One of the most intricate parts of migration is converting Tableau’s calculated fields and logic into Power BI’s DAX language, ensuring that functionality is retained while adapting to Power BI’s unique environment.
Styling and Formatting: Matching the Look vs. Redesigning from Scratch
Building from Scratch: Rebuilding reports in Power BI from scratch allows for more flexibility, offering a fresh, modern design aligned with current brand aesthetics and business needs.
Migration from Tableau: During migration, it’s often necessary to match the style and design of Tableau reports to ensure a consistent user experience.
Migration Challenges: Balancing Consistency and Flexibility
Building from Scratch: Starting fresh presents no challenges in maintaining consistency with previous designs but allows for full creative control.
Migration from Tableau: The migration process is more challenging than building from scratch, as it requires careful attention to replicating Tableau’s functionality and design to ensure the Power BI reports mirror the original in both appearance and performance.
Post-Migration Support: Ensuring a Smooth Transition to Power BI
Once the migration from Tableau to Power BI is complete, providing comprehensive post-migration support is vital to ensuring a smooth transition. This includes offering training sessions, preparing documentation that outlines the differences between Tableau and Power BI, and establishing dedicated channels for users to ask questions or report issues. These efforts will facilitate user adoption and ensure the transition to Power BI is both successful and sustainable.
Know more about Tableau to Power BI: Save Costs & Gain AI-Driven Insights
Key Considerations for Migrating from Tableau to Power BI
Calculated Columns and Measures: Understanding the Differences
Tableau: Tableau’s calculated fields enable users to perform a wide variety of in-platform calculations and dynamic analysis, creating new metrics and applying complex formulas.
Power BI: Power BI uses measures for similar functionality but requires translating Tableau’s logic into Power BI’s DAX language, which might involve some fine-tuning to maintain consistency.
Chart Creation: A Shift from Modularity to Flexibility
Tableau: Tableau uses a modular approach where each chart resides in a separate worksheet. This makes it easier to analyze individual visualizations but requires more effort to manage multiple charts.
Power BI: Power BI allows multiple charts to be placed on a single page for efficient comparison and analysis, offering greater flexibility and ease of comparison within a unified workspace.
Both Power BI and Tableau provide powerful charting capabilities. Power BI’s design allows for dynamic and interconnected visualizations, while Tableau’s modular approach emphasizes individual analysis of specific datasets.
Why Choose Acuvate?
At Acuvate, we help businesses seamlessly transition their BI tools to stay ahead in today’s data-driven world. As a trusted Microsoft partner, we ensure efficiency, security, and governance in analytics modernization.
Try our migration calculator: Seamlessly Transition from Tableau to Power BI with Acuvate
How Acuvate Supports Your Power BI Migration
1. Efficient Migration Strategy
Migrating from Tableau to Power BI can be complex, but Acuvate streamlines the process. Unlike traditional BI firms, we leverage automation and best practices to accelerate migration with minimal disruption.
2. Faster Adoption with Self-Service Analytics
Power BI empowers business users with self-service analytics. Acuvate ensures teams can independently create reports while maintaining data security and governance.
3. Seamless Microsoft Integration
As a Microsoft Solutions Partner, we integrate Power BI with Office 365, Azure, and Dynamics 365 to enhance insights and decision-making.
4. Scalable and Cost-Effective Solutions
We offer flexible managed services for security compliance, data governance, and ongoing support tailored to your business needs.
5. Cutting-Edge BI Technologies
Acuvate stays ahead of BI trends, collaborating closely with Microsoft to bring the latest innovations to our clients.
6. Reliable Support & Maintenance
Beyond migration, we ensure your Power BI environment remains optimized with continuous support and performance tuning.
7. Accelerated Data Transformation
Acuvate enhances Power BI migration with AcuWeave, our advanced Microsoft Fabric accelerator. AcuWeave streamlines data ingestion, transformation, and modeling, ensuring faster insights and seamless integration with your existing BI ecosystem.
Get Started with Acuvate Today
Whether you need a full-scale migration or phased transition, Acuvate is here to guide you. Contact us to leverage Power BI for smarter insights and decision automation.
Conclusion: Unlock the Power of Advanced BI
As businesses strive for smarter analytics and improved decision-making, Power BI emerges as a powerful alternative to Tableau. Its deep integration with Microsoft products, cost efficiency, and user-friendly experience make it an excellent choice for organizations looking to enhance their BI strategy.
With a structured migration approach and best practices in place, transitioning from Tableau to Power BI can be a game-changer for your business. Don’t hesitate to make the switch and unlock new insights to drive your company forward!
Ready to migrate? Reach out to our experts today and take the first step towards an optimized business intelligence experience with Power BI.
#powerbi#automation#tableau#migration#power bi solutions#Data visualization#data modeling#data governance#Migration tool#data transformation
0 notes
Text
[DataModeling] Tip DAX para autoreferencia o recurrencia de tabla
Hace tiempo que no nos sentrabamos en acompañar un escenario de modelado. En esta oportunidad, nos vamos a enfocar en como resolver una situación de auto referencia o recurrencia de tabla. Suele ocurrir que una tabla puede tener ids o claves de referencia para si misma y las formas de resolverlo pueden variar.
En este artículo, vamos a mostrar como valernos de DAX para resolver un esquema jerárquico corporativo que ayude a develar un organigrama organizacional basado en niveles o posiciones/cargos superiores.
Contexto
Entre las formas de modelar bases de datos transaccionales, buscamos normalizar los datos para evitar la redundancia lo más posible. Así es como pueden aparecer escenarios donde hay tablas que van a referenciarse a si mismas. Esto quiere decir que podemos tener una clave foránea apuntando a una clave primaria. Para no abordar tanta teoría veamos un ejemplo que ayude a enfocar el caso.
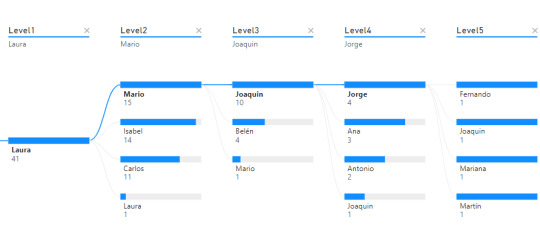
Nos enviaron un requerimiento que pide detallar un organigrama o estructura jerárquica en la organización que permita explorar la cantidad de empleados según distintos focos de mando. Piden que la información sea explorable, puede ser una matriz o árbol del siguiente estilo:
Árbol de decomposición
Matriz

Supongamos que tenemos una tabla de Empleados en nuestra base de datos. La organización tiene un gran volumen de personal, lo que hace que naturalmente haya una estructura jerárquica con cargos de mando o de management. Todas las personas institucionales forman parte de la tabla empleados fila por fila. Sin embargo, necesitamos guardar información sobre la persona a la cual responden. Aquí aparece la auto referencia. Para resolver esta operación en vistas de base de datos transaccional, será más performante y menos costoso delimitar una nueva columna que autoreferencie a otra fila en lugar de otras tablas para los cargos pertinentes. Veamos como quedaría una tabla con la nueva columna:

Fíjense que la columna id_superior pertenece a un id_empleado de otra fila. Cuando esto ocurre, estamos frente a un caso de auto referencia.
Dependiendo el proceso y escenario a delimtiar en nuestro modelo semántico, puede ser resuelto de distintas formas. Podríamos generar fact factless que orienten un mapeo de quienes responden a quienes o podemos tomar esta tabla como dimensión y generar columnas que representen el mando jerárquico como columnas categóricas de la dimension.
Este artículo se enfocará en la segunda solución. Vamos a generar columnas categoricas que nos ayuden a construir algo semejante a lo siguiente:

La idea es generar columns por cantidad de niveles jerárquicos que se presenten. Si bien la mejor solución es implementarlo lo más temprano posible, es decir en un warehouse, lakehouse o procesamiento intermedio; aquí vamos a mostrar como crear las columnas con DAX.
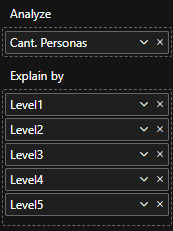
Vamos a crear una columna calculada de la siguiente manera:
Level1 = LOOKUPVALUE( Empleados_Jerarquia[Nombre] , Empleados_Jerarquia[id_empleado] , PATHITEM( PATH ( Empleados_Jerarquia[id_empleado], Empleados_Jerarquia[id_superior]) , 1 , INTEGER ) )
Vamos a nutrirnos de tres funciones para generar un recorrido dentro de la misma tabla.
LOOKUPVALUE: Esta función busca un valor en una columna específica de una tabla, basándose en criterios de búsqueda. En este caso, está buscando el nombre de un empleado con criterio de igualdad entre id_empleado que mapee al id_superior de la fila actual.
PATH: Esta función crea una cadena que representa la jerarquía de empleados, utilizando los id_empleado y id_superior. Busca los ID y los separa por Pipes. Entonces por ejemplo en la fila de ID = 5 de Joaquín. El resultado de Path será "1|2|5" representando que los ID de sus superiores son primero el empleado 2 y luego el empleado 1.
PATHITEM(..., 1, INTEGER): Esta función toma la cadena generada por PATH y extrae un elemento de ella. En este caso, está extrayendo el primer elemento (el id del empleado que está en la posición 1). Aquí, el 1 se refiere a la posición que queremos extraer (el primer ítem en la jerarquía). Si Joaquín tenía 3 valores, vamos a buscar el de la primera posición, en este caso "1".
Resultado: lookupvalue buscara el nombre del empleado con ID 1 para la columna.
Esta función podríamos replicarla para cada nivel. La función antes vista traería el primero de la cadena, es decir la dirección de la empresa. Para llegar al siguiente nivel cambiamos el parametro de pathitem de manera que traiga el segundo resultado de Path en sus pipes.
Level2 = LOOKUPVALUE( Empleados_Jerarquia[Nombre] , Empleados_Jerarquia[id_empleado] , PATHITEM( PATH ( Empleados_Jerarquia[id_empleado], Empleados_Jerarquia[id_superior]) , 2 , INTEGER ) )
En primera instancia esto parecería resolverlo. Este sería nuestro resultado:

Esta puede ser una solución directa si solo queremos navegar por nombres de personas en cadena (filtramos Level5 <> Blank). Sin embargo, si también quisieramos conocer la cantidad de personas que tienen a cargo, es necesario contar a la persona al mando como parte del equipo, sino generaríamos una cadena de "Blanks" como pueden ver en niveles del 2 al 5. Esto lo podemos corregir copiando el nivel anterior cuando ocurre un blanco.
Level2 = VAR __lvl2 = LOOKUPVALUE( Empleados_Jerarquia[Nombre] , Empleados_Jerarquia[id_empleado] , PATHITEM( PATH ( Empleados_Jerarquia[id_empleado], Empleados_Jerarquia[id_superior]) , 2 , INTEGER ) ) RETURN IF ( ISBLANK(__lvl2) , Empleados_Jerarquia[Level1], __lvl2 )
De esa forma el equipo de Laura (primera) cuenta con tres gerentes y si misma al conteo total de empleados.
Las visualizaciones pueden ser construidas por cada nivel como columnas categóricas de las dimensiones:
Así mismo podría usarse el nombre del cargo como nombre de columna para ver la pirámide institucional de una manera más sencilla.
De esta forma llegaríamos al resultado esperado y mostrado en la primera imagen de requerimiento.
Ojala esta solución les sirva para resolver situaciones de modelado recursivo. Recuerden que si podemos ejecutar esto en SQL en nuestra capa de transformación, sería lo mejor para construir la dimensión. Como siempre pueden descargar el archivo de ejemplo de mi GitHub.
#dax#dax tip#dax tutorial#dax training#data modeling#powerbi#power bi#power bi desktop#power bi cordoba#power bi argentina#power bi jujuy#ladataweb
0 notes
Text
What is Data Science? A Comprehensive Guide for Beginners

In today’s data-driven world, the term “Data Science” has become a buzzword across industries. Whether it’s in technology, healthcare, finance, or retail, data science is transforming how businesses operate, make decisions, and understand their customers. But what exactly is data science? And why is it so crucial in the modern world? This comprehensive guide is designed to help beginners understand the fundamentals of data science, its processes, tools, and its significance in various fields.
#Data Science#Data Collection#Data Cleaning#Data Exploration#Data Visualization#Data Modeling#Model Evaluation#Deployment#Monitoring#Data Science Tools#Data Science Technologies#Python#R#SQL#PyTorch#TensorFlow#Tableau#Power BI#Hadoop#Spark#Business#Healthcare#Finance#Marketing
0 notes
Text
Data Modeling Techniques and Power BI
Data modeling is a crucial aspect of creating effective reports and dashboards in Power BI. In this article, we'll explore various data modeling techniques that can be applied in Power BI.

Star Schema Modeling
In Power BI, you can create a data model using the star schema approach. This involves having a central fact table that is surrounded by dimension tables. Star schema models make data querying and analysis in Power BI simpler. They provide a denormalized structure that is optimized for reporting, which enables users to easily aggregate and analyze data across dimensions.

Snowflake Schema Modeling
Power BI mainly supports star schema modeling. However, you can use snowflake schema modeling by establishing relationships between normalized tables. It's important to manage performance implications carefully. Snowflake schema models can help save storage space and maintain data integrity, especially for large datasets with complex relationships.
Dimensional Modeling
Power BI is a data analysis tool that supports dimensional modeling. This involves arranging data into dimensions (which contain descriptive attributes) and facts (which contain numerical measures). By doing this, it simplifies data analysis and enables users to easily drill down into specific aspects of the data. Power BI's functionality for creating hierarchies is in line with the principles of dimensional modeling.

Normalized Modeling
Power BI is best suited for star schema modeling, but you can still use normalized modeling by creating separate tables for related entities and establishing relationships between them. Normalized models are useful for transactional systems as they help maintain data integrity and reduce redundancy. However, querying normalized models in Power BI may require more complex DAX expressions.
Data Vault Modeling
Power BI is capable of handling multiple related tables and establishing relationships between them, which makes it a great tool for implementing certain elements of Data Vault modeling. This modeling technique is known for its flexibility and scalability, making it a good choice for handling data requirements that may change over time. In addition, Power BI's incremental data loading capabilities align well with Data Vault modeling principles.
Hybrid Modeling
Power BI offers the flexibility to combine various modeling techniques, such as star schema and snowflake schema, to cater to specific business requirements. Hybrid modeling enables you to take advantage of the strengths of different modeling techniques while reducing their limitations. For instance, you can use a star schema for most reporting needs while implementing a snowflake schema for specific dimensions with complex hierarchies.

Agile Modeling
Agile modeling principles can be applied iteratively in Power BI as you refine your data model based on user feedback and evolving business requirements. This approach ensures that your Power BI reports and dashboards remain aligned with business objectives and user needs, allowing for continuous improvement and adaptation.
Designing robust data models that support insightful analysis and reporting for organizations is made possible by understanding data modeling techniques and applying them within Power BI.
1 note
·
View note
Text
Power BI Semantic Model Guide for 2024
Introduction:
As we step into the dynamic landscape of 2024, the role of data in decision-making has never been more critical. Businesses are continually seeking ways to harness the power of their data, and Microsoft's Power BI remains at the forefront of empowering organizations with actionable insights. In this blog post, we delve deep into the Power BI Semantic Model and explore how it has evolved to meet the demands of the data-driven era.

Understanding the Power BI Semantic Model:
The Power BI Semantic Model is the backbone of Power BI, providing a robust framework for organizing and interpreting data. In 2024, Microsoft has introduced several enhancements to the Semantic Model, aiming to elevate user experience and deliver more meaningful insights.
Unified Modeling Experience:
In response to user feedback, Microsoft has revamped the modeling experience within Power BI. The 2024 update focuses on a unified modeling approach, streamlining the process of creating relationships, measures, and calculations. The intuitive interface caters to both beginners and seasoned data professionals, ensuring a seamless modeling journey.
Enhanced Data Connectivity:
Recognizing the diversity of data sources, Power BI now boasts expanded connectivity options. The Semantic Model is designed to effortlessly integrate with a plethora of data platforms, including cloud-based solutions and on-premises databases. This versatility ensures that organizations can consolidate their data from various sources, fostering a more holistic approach to analysis.
AI-Driven Insights:
Artificial Intelligence (AI) has become an integral part of modern analytics. Power BI's Semantic Model now incorporates advanced AI capabilities to generate insightful recommendations. From identifying key trends to suggesting relevant visualizations, the enhanced AI integration elevates the platform's analytical capabilities, making it easier for users to derive value from their data.
Performance Optimization:
Responding to the need for faster and more efficient data processing, Microsoft has invested in performance optimization for the Semantic Model. With improved query response times and optimized data compression techniques, Power BI users can expect a smoother and more responsive analytics experience.
Advanced DAX Functions:
The Data Analysis Expressions (DAX) language is the heart of the Power BI Semantic Model. In 2024, Microsoft has introduced a range of new DAX functions, empowering users to create more complex and sophisticated calculations. Whether it's time-based analysis, statistical modeling, or predictive analytics, the expanded DAX functionality provides users with unprecedented flexibility.
Collaborative Workspace:
Collaboration is key in today's interconnected business environment, and the significance of effective teamwork is further accentuated by leveraging specialized expertise, such as Power BI consulting services. Power BI's Semantic Model now features enhanced collaboration tools provided by these consulting services, allowing multiple users to seamlessly work on the same model simultaneously. Real-time collaboration, facilitated by Power BI consulting services, ensures that cross-functional teams can efficiently and collaboratively contribute to the development of a robust semantic layer, fostering a unified approach to data analysis and decision-making. This integration of Power BI consulting services enhances not only the collaborative aspects of the Semantic Model but also amplifies the overall efficiency of the analytics workflow.
Conclusion:
In conclusion, the Power BI Semantic Model for 2024 stands as a testament to Microsoft's commitment to empowering businesses with cutting-edge analytics capabilities. The unified modeling experience, expanded data connectivity, AI-driven insights, performance optimization, advanced DAX functions, and collaborative workspace features collectively position Power BI as a formidable tool in the hands of data enthusiasts. As organizations strive to make data-driven decisions in the ever-evolving landscape of 2024, embracing the Power BI Semantic Model is a strategic step towards unlocking the true potential of their data assets.
0 notes
Text
"Power BI helps businesses collect, analyze, and visualize data. To boost your career, get Power BI certified. SCON Institute is a top Power BI certification training institute in Mumbai.
SCON Institute offers top-notch business analytics and data science training. A complete Power BI certification course covers data modeling, visualization, and report development. Hands-on Power BI training helps you solve real-world business problems.
SCON Institute offers Power BI certification training in Mumbai at a moderate cost. The cost of the training program depends on its length and certification level. SCON Institute offers inexpensive, high-quality training.
SCON Institute trainers have real-world Power BI experience. They understand the tool well and can offer practical advice on its use. Trainers will provide personalized advice throughout the training program.
SCON Institute offers other business analytics and data science courses than Power BI certification. This lets you learn more about this field.
SCON Institute offers affordable, high-quality Power BI certification training in Mumbai. One of the leading Power BI certification training institutions in the city, they offer thorough course content, hands-on instruction, and skilled trainers. contact-7676301459 [email protected]
powerbi #microsoft #businessintelligence #excel #dataanalytics #datascience
#"Power BI helps businesses collect#analyze#and visualize data. To boost your career#get Power BI certified. SCON Institute is a top Power BI certification training institute in Mumbai.#SCON Institute offers top-notch business analytics and data science training. A complete Power BI certification course covers data modeling#visualization#and report development. Hands-on Power BI training helps you solve real-world business problems.#SCON Institute offers Power BI certification training in Mumbai at a moderate cost. The cost of the training program depends on its length#high-quality training.#SCON Institute trainers have real-world Power BI experience. They understand the tool well and can offer practical advice on its use. Train#SCON Institute offers other business analytics and data science courses than Power BI certification. This lets you learn more about this fi#SCON Institute offers affordable#high-quality Power BI certification training in Mumbai. One of the leading Power BI certification training institutions in the city#they offer thorough course content#hands-on instruction#and skilled trainers.#contact-7676301459#[email protected]#powerbi#microsoft#businessintelligence#excel#dataanalytics#datascience
0 notes
Text
Next year will be Big Tech’s finale. Critique of Big Tech is now common sense, voiced by a motley spectrum that unites opposing political parties, mainstream pundits, and even tech titans such as the VC powerhouse Y Combinator, which is singing in harmony with giants like a16z in proclaiming fealty to “little tech” against the centralized power of incumbents.
Why the fall from grace? One reason is that the collateral consequences of the current Big Tech business model are too obvious to ignore. The list is old hat by now: centralization, surveillance, information control. It goes on, and it’s not hypothetical. Concentrating such vast power in a few hands does not lead to good things. No, it leads to things like the CrowdStrike outage of mid-2024, when corner-cutting by Microsoft led to critical infrastructure—from hospitals to banks to traffic systems—failing globally for an extended period.
Another reason Big Tech is set to falter in 2025 is that the frothy AI market, on which Big Tech bet big, is beginning to lose its fizz. Major money, like Goldman Sachs and Sequoia Capital, is worried. They went public recently with their concerns about the disconnect between the billions required to create and use large-scale AI, and the weak market fit and tepid returns where the rubber meets the AI business-model road.
It doesn’t help that the public and regulators are waking up to AI’s reliance on, and generation of, sensitive data at a time when the appetite for privacy has never been higher—as evidenced, for one, by Signal’s persistent user growth. AI, on the other hand, generally erodes privacy. We saw this in June when Microsoft announced Recall, a product that would, I kid you not, screenshot everything you do on your device so an AI system could give you “perfect memory” of what you were doing on your computer (Doomscrolling? Porn-watching?). The system required the capture of those sensitive images—which would not exist otherwise—in order to work.
Happily, these factors aren’t just liquefying the ground below Big Tech’s dominance. They’re also powering bold visions for alternatives that stop tinkering at the edges of the monopoly tech paradigm, and work to design and build actually democratic, independent, open, and transparent tech. Imagine!
For example, initiatives in Europe are exploring independent core tech infrastructure, with convenings of open source developers, scholars of governance, and experts on the political economy of the tech industry.
And just as the money people are joining in critique, they’re also exploring investments in new paradigms. A crop of tech investors are developing models of funding for mission alignment, focusing on tech that rejects surveillance, social control, and all the bullshit. One exciting model I’ve been discussing with some of these investors would combine traditional VC incentives (fund that one unicorn > scale > acquisition > get rich) with a commitment to resource tech’s open, nonprofit critical infrastructure with a percent of their fund. Not as investment, but as a contribution to maintaining the bedrock on which a healthy tech ecosystem can exist (and maybe get them and their limited partners a tax break).
Such support could—and I believe should—be supplemented by state capital. The amount of money needed is simply too vast if we’re going to do this properly. To give an example closer to home, developing and maintaining Signal costs around $50 million a year, which is very lean for tech. Projects such as the Sovereign Tech Fund in Germany point a path forward—they are a vehicle to distribute state funds to core open source infrastructures, but they are governed wholly independently, and create a buffer between the efforts they fund and the state.
Just as composting makes nutrients from necrosis, in 2025, Big Tech’s end will be the beginning of a new and vibrant ecosystem. The smart, actually cool, genuinely interested people will once again have their moment, getting the resources and clearance to design and (re)build a tech ecosystem that is actually innovative and built for benefit, not just profit and control. MAY IT BE EVER THUS!
72 notes
·
View notes
Text


Yuliana Clover
Voiced by: Saori Hayami
Twisted from: Penny Polendina from RWBY,
Family: Maxine Dean(Father) , Unknown buyer("Other Father")
Nicknames: Electric Ell(Floyd), Yuli(Sumire, Raven Bernadette, Jaden, Minako, Pierre,Akane @queen-of-twisted ), Yulo babe(Shane), It/ Thing (Rayone,Yuzu, Morana, Giles Grimm,Hadeon @queen-of-twisted ), My darling helper (Crowley), Lucky Clover (Ace, Jade, Epel), Cutie(Hailee @queen-of-twisted), Yuliana-chan( Akane, Cadel, Yumeko, Victor @queen-of-twisted ,Sonomi, Yumeri, Taiyou, Hokori, Bernice, Adira, Kalpana, Stella, Yuri @kousaka-ayumu ) Ana( Alaida, Griselda @queen-of-twisted , Brin, Ortho,) Yu-Dear(Mota), Liana(Kaida, Farah, Samara, Raymond, Rye, Apollo, Alain, Epel, Sumire @kousaka-ayumu )
Age: 15
Species: Cyborg
Dominant Hand: Both
Homeland: Italy (x1)
Dorm: Hallowlore
Club: Light Music Club
Pet Peeves: Being told she isn't alive, her data being scrambled
Hobbies: Reading, DJ ing
Favorite Food: Chocolate
Best subject: Magical history, Animal Care
Worst subject: Practical Magic
Favorite food: Cupcakes
Least favorite food: nuts
Personality: Helpful, Kind, Naive, Worry wart, Nosey
Quotes: Greetings Comrades, I hope we are able to get along.
Talents: Immune to most mind spells, eye for details, Combat, music
Background
Yuliana was made when someone requested a soldier who would do anything the buyer asked. Her development took years during which she somehow got a soul. Her father never said how it happened or even if he actually knew how it happened. What also changed is that he began to see her like his own daughter which inspired him to try to get her away from the buyer. The day before he decided to leave, Yuliana saw a black carriage. She decided to inform her papa immediately, to which he took it as a sign to leave, only for her to get transported to Twisted Wonderland.
Trivia
Not the best at understanding metaphors
Has a light Italian Accent
Was modeled after Maxine's dead daughter, who was mixed black Italian.
Crescendo and the first years tries to make sure she doesn't get taken advantage of by the students.
RSA tried to get her to transfered. It fails big time
Is bi but have anyone in mind.
Is powered by aether neno
Can use magic if it's a bit wonky
@bakawitch @zexal-club @queen-of-twisted @liviavanrouge @writing-heiress @abyssthing198 @maxarat @kousaka-ayumu @lovelyllamasblog @starry-night-rose @riofy-ramshackle @danika-redgrave124 @sanyu-thewitch05
@starboy2461
9 notes
·
View notes
Text
How to Become a Data Scientist in 2025 (Roadmap for Absolute Beginners)

Want to become a data scientist in 2025 but don’t know where to start? You’re not alone. With job roles, tech stacks, and buzzwords changing rapidly, it’s easy to feel lost.
But here’s the good news: you don’t need a PhD or years of coding experience to get started. You just need the right roadmap.
Let’s break down the beginner-friendly path to becoming a data scientist in 2025.
✈️ Step 1: Get Comfortable with Python
Python is the most beginner-friendly programming language in data science.
What to learn:
Variables, loops, functions
Libraries like NumPy, Pandas, and Matplotlib
Why: It’s the backbone of everything you’ll do in data analysis and machine learning.
🔢 Step 2: Learn Basic Math & Stats
You don’t need to be a math genius. But you do need to understand:
Descriptive statistics
Probability
Linear algebra basics
Hypothesis testing
These concepts help you interpret data and build reliable models.
📊 Step 3: Master Data Handling
You’ll spend 70% of your time cleaning and preparing data.
Skills to focus on:
Working with CSV/Excel files
Cleaning missing data
Data transformation with Pandas
Visualizing data with Seaborn/Matplotlib
This is the “real work” most data scientists do daily.
🧬 Step 4: Learn Machine Learning (ML)
Once you’re solid with data handling, dive into ML.
Start with:
Supervised learning (Linear Regression, Decision Trees, KNN)
Unsupervised learning (Clustering)
Model evaluation metrics (accuracy, recall, precision)
Toolkits: Scikit-learn, XGBoost
🚀 Step 5: Work on Real Projects
Projects are what make your resume pop.
Try solving:
Customer churn
Sales forecasting
Sentiment analysis
Fraud detection
Pro tip: Document everything on GitHub and write blogs about your process.
✏️ Step 6: Learn SQL and Databases
Data lives in databases. Knowing how to query it with SQL is a must-have skill.
Focus on:
SELECT, JOIN, GROUP BY
Creating and updating tables
Writing nested queries
🌍 Step 7: Understand the Business Side
Data science isn’t just tech. You need to translate insights into decisions.
Learn to:
Tell stories with data (data storytelling)
Build dashboards with tools like Power BI or Tableau
Align your analysis with business goals
🎥 Want a Structured Way to Learn All This?
Instead of guessing what to learn next, check out Intellipaat’s full Data Science course on YouTube. It covers Python, ML, real projects, and everything you need to build job-ready skills.
https://www.youtube.com/watch?v=rxNDw68XcE4
🔄 Final Thoughts
Becoming a data scientist in 2025 is 100% possible — even for beginners. All you need is consistency, a good learning path, and a little curiosity.
Start simple. Build as you go. And let your projects speak louder than your resume.
Drop a comment if you’re starting your journey. And don’t forget to check out the free Intellipaat course to speed up your progress!
2 notes
·
View notes
Text
Data Analysis: Turning Information into Insight
In nowadays’s digital age, statistics has come to be a vital asset for businesses, researchers, governments, and people alike. However, raw facts on its personal holds little value till it's far interpreted and understood. This is wherein records evaluation comes into play. Data analysis is the systematic manner of inspecting, cleansing, remodeling, and modeling facts with the objective of coming across beneficial information, drawing conclusions, and helping selection-making.
What Is Data Analysis In Research

What is Data Analysis?
At its middle, records analysis includes extracting meaningful insights from datasets. These datasets can variety from small and based spreadsheets to large and unstructured facts lakes. The primary aim is to make sense of data to reply questions, resolve issues, or become aware of traits and styles that are not without delay apparent.
Data evaluation is used in truely every enterprise—from healthcare and finance to marketing and education. It enables groups to make proof-based choices, improve operational efficiency, and advantage aggressive advantages.
Types of Data Analysis
There are several kinds of information evaluation, every serving a completely unique purpose:
1. Descriptive Analysis
Descriptive analysis answers the question: “What happened?” It summarizes raw facts into digestible codecs like averages, probabilities, or counts. For instance, a store might analyze last month’s sales to decide which merchandise achieved satisfactory.
2. Diagnostic Analysis
This form of evaluation explores the reasons behind beyond outcomes. It answers: “Why did it occur?” For example, if a agency sees a surprising drop in internet site visitors, diagnostic evaluation can assist pinpoint whether or not it changed into because of a technical problem, adjustments in search engine marketing rating, or competitor movements.
3. Predictive Analysis
Predictive analysis makes use of historical information to forecast destiny consequences. It solutions: “What is probable to occur?” This includes statistical models and system getting to know algorithms to pick out styles and expect destiny trends, such as customer churn or product demand.
4. Prescriptive Analysis
Prescriptive analysis provides recommendations primarily based on facts. It solutions: “What have to we do?” This is the maximum advanced type of analysis and often combines insights from predictive analysis with optimization and simulation techniques to manual selection-making.
The Data Analysis Process
The technique of information analysis commonly follows those steps:
1. Define the Objective
Before diving into statistics, it’s essential to without a doubt recognize the question or trouble at hand. A well-defined goal guides the entire analysis and ensures that efforts are aligned with the preferred outcome.
2. Collect Data
Data can come from numerous sources which includes databases, surveys, sensors, APIs, or social media. It’s important to make certain that the records is relevant, timely, and of sufficient high-quality.
3. Clean and Prepare Data
Raw information is regularly messy—it may comprise missing values, duplicates, inconsistencies, or mistakes. Data cleansing involves addressing these problems. Preparation may include formatting, normalization, or growing new variables.
Four. Analyze the Data
Tools like Excel, SQL, Python, R, or specialized software consisting of Tableau, Power BI, and SAS are typically used.
5. Interpret Results
Analysis isn't pretty much numbers; it’s about meaning. Interpreting effects involves drawing conclusions, explaining findings, and linking insights lower back to the authentic goal.
6. Communicate Findings
Insights have to be communicated effectively to stakeholders. Visualization tools including charts, graphs, dashboards, and reports play a vital position in telling the story behind the statistics.
7. Make Decisions and Take Action
The last aim of statistics analysis is to tell selections. Whether it’s optimizing a advertising marketing campaign, improving customer support, or refining a product, actionable insights flip data into real-global effects.
Tools and Technologies for Data Analysis
A big selection of gear is available for facts analysis, each suited to distinct tasks and talent levels:
Excel: Great for small datasets and short analysis. Offers capabilities, pivot tables, and charts.
Python: Powerful for complicated facts manipulation and modeling. Popular libraries consist of Pandas, NumPy, Matplotlib, and Scikit-learn.
R: A statistical programming language extensively used for statistical analysis and statistics visualization.
SQL: Essential for querying and handling information saved in relational databases.
Tableau & Power BI: User-friendly enterprise intelligence equipment that flip facts into interactive visualizations and dashboards.
Healthcare: Analyzing affected person statistics to enhance treatment plans, predict outbreaks, and control resources.
Finance: Detecting fraud, coping with threat, and guiding investment techniques.
Retail: Personalizing advertising campaigns, managing inventory, and optimizing pricing.
Sports: Enhancing performance through participant records and game analysis.
Public Policy: Informing choices on schooling, transportation, and financial improvement.
Challenges in Data Analysis
Data Quality: Incomplete, old, or incorrect information can lead to deceptive conclusions.
Data Privacy: Handling sensitive records requires strict adherence to privacy guidelines like GDPR.
Skill Gaps: There's a developing demand for skilled information analysts who can interpret complicated facts sets.
Integration: Combining facts from disparate resources may be technically hard.
Bias and Misinterpretation: Poorly designed analysis can introduce bias or lead to wrong assumptions.
The Future of Data Analysis
As facts keeps to grow exponentially, the sector of facts analysis is evolving rapidly. Emerging developments include:
Artificial Intelligence (AI) & Machine Learning: Automating evaluation and producing predictive fashions at scale.
Real-Time Analytics: Enabling decisions based totally on live data streams for faster reaction.
Data Democratization: Making records handy and understandable to everybody in an business enterprise
2 notes
·
View notes
Text
Google Cloud’s BigQuery Autonomous Data To AI Platform
BigQuery automates data analysis, transformation, and insight generation using AI. AI and natural language interaction simplify difficult operations.
The fast-paced world needs data access and a real-time data activation flywheel. Artificial intelligence that integrates directly into the data environment and works with intelligent agents is emerging. These catalysts open doors and enable self-directed, rapid action, which is vital for success. This flywheel uses Google's Data & AI Cloud to activate data in real time. BigQuery has five times more organisations than the two leading cloud providers that just offer data science and data warehousing solutions due to this emphasis.
Examples of top companies:
With BigQuery, Radisson Hotel Group enhanced campaign productivity by 50% and revenue by over 20% by fine-tuning the Gemini model.
By connecting over 170 data sources with BigQuery, Gordon Food Service established a scalable, modern, AI-ready data architecture. This improved real-time response to critical business demands, enabled complete analytics, boosted client usage of their ordering systems, and offered staff rapid insights while cutting costs and boosting market share.
J.B. Hunt is revolutionising logistics for shippers and carriers by integrating Databricks into BigQuery.
General Mills saves over $100 million using BigQuery and Vertex AI to give workers secure access to LLMs for structured and unstructured data searches.
Google Cloud is unveiling many new features with its autonomous data to AI platform powered by BigQuery and Looker, a unified, trustworthy, and conversational BI platform:
New assistive and agentic experiences based on your trusted data and available through BigQuery and Looker will make data scientists, data engineers, analysts, and business users' jobs simpler and faster.
Advanced analytics and data science acceleration: Along with seamless integration with real-time and open-source technologies, BigQuery AI-assisted notebooks improve data science workflows and BigQuery AI Query Engine provides fresh insights.
Autonomous data foundation: BigQuery can collect, manage, and orchestrate any data with its new autonomous features, which include native support for unstructured data processing and open data formats like Iceberg.
Look at each change in detail.
User-specific agents
It believes everyone should have AI. BigQuery and Looker made AI-powered helpful experiences generally available, but Google Cloud now offers specialised agents for all data chores, such as:
Data engineering agents integrated with BigQuery pipelines help create data pipelines, convert and enhance data, discover anomalies, and automate metadata development. These agents provide trustworthy data and replace time-consuming and repetitive tasks, enhancing data team productivity. Data engineers traditionally spend hours cleaning, processing, and confirming data.
The data science agent in Google's Colab notebook enables model development at every step. Scalable training, intelligent model selection, automated feature engineering, and faster iteration are possible. This agent lets data science teams focus on complex methods rather than data and infrastructure.
Looker conversational analytics lets everyone utilise natural language with data. Expanded capabilities provided with DeepMind let all users understand the agent's actions and easily resolve misconceptions by undertaking advanced analysis and explaining its logic. Looker's semantic layer boosts accuracy by two-thirds. The agent understands business language like “revenue” and “segments” and can compute metrics in real time, ensuring trustworthy, accurate, and relevant results. An API for conversational analytics is also being introduced to help developers integrate it into processes and apps.
In the BigQuery autonomous data to AI platform, Google Cloud introduced the BigQuery knowledge engine to power assistive and agentic experiences. It models data associations, suggests business vocabulary words, and creates metadata instantaneously using Gemini's table descriptions, query histories, and schema connections. This knowledge engine grounds AI and agents in business context, enabling semantic search across BigQuery and AI-powered data insights.
All customers may access Gemini-powered agentic and assistive experiences in BigQuery and Looker without add-ons in the existing price model tiers!
Accelerating data science and advanced analytics
BigQuery autonomous data to AI platform is revolutionising data science and analytics by enabling new AI-driven data science experiences and engines to manage complex data and provide real-time analytics.
First, AI improves BigQuery notebooks. It adds intelligent SQL cells to your notebook that can merge data sources, comprehend data context, and make code-writing suggestions. It also uses native exploratory analysis and visualisation capabilities for data exploration and peer collaboration. Data scientists can also schedule analyses and update insights. Google Cloud also lets you construct laptop-driven, dynamic, user-friendly, interactive data apps to share insights across the organisation.
This enhanced notebook experience is complemented by the BigQuery AI query engine for AI-driven analytics. This engine lets data scientists easily manage organised and unstructured data and add real-world context—not simply retrieve it. BigQuery AI co-processes SQL and Gemini, adding runtime verbal comprehension, reasoning skills, and real-world knowledge. Their new engine processes unstructured photographs and matches them to your product catalogue. This engine supports several use cases, including model enhancement, sophisticated segmentation, and new insights.
Additionally, it provides users with the most cloud-optimized open-source environment. Google Cloud for Apache Kafka enables real-time data pipelines for event sourcing, model scoring, communications, and analytics in BigQuery for serverless Apache Spark execution. Customers have almost doubled their serverless Spark use in the last year, and Google Cloud has upgraded this engine to handle data 2.7 times faster.
BigQuery lets data scientists utilise SQL, Spark, or foundation models on Google's serverless and scalable architecture to innovate faster without the challenges of traditional infrastructure.
An independent data foundation throughout data lifetime
An independent data foundation created for modern data complexity supports its advanced analytics engines and specialised agents. BigQuery is transforming the environment by making unstructured data first-class citizens. New platform features, such as orchestration for a variety of data workloads, autonomous and invisible governance, and open formats for flexibility, ensure that your data is always ready for data science or artificial intelligence issues. It does this while giving the best cost and decreasing operational overhead.
For many companies, unstructured data is their biggest untapped potential. Even while structured data provides analytical avenues, unique ideas in text, audio, video, and photographs are often underutilised and discovered in siloed systems. BigQuery instantly tackles this issue by making unstructured data a first-class citizen using multimodal tables (preview), which integrate structured data with rich, complex data types for unified querying and storage.
Google Cloud's expanded BigQuery governance enables data stewards and professionals a single perspective to manage discovery, classification, curation, quality, usage, and sharing, including automatic cataloguing and metadata production, to efficiently manage this large data estate. BigQuery continuous queries use SQL to analyse and act on streaming data regardless of format, ensuring timely insights from all your data streams.
Customers utilise Google's AI models in BigQuery for multimodal analysis 16 times more than last year, driven by advanced support for structured and unstructured multimodal data. BigQuery with Vertex AI are 8–16 times cheaper than independent data warehouse and AI solutions.
Google Cloud maintains open ecology. BigQuery tables for Apache Iceberg combine BigQuery's performance and integrated capabilities with the flexibility of an open data lakehouse to link Iceberg data to SQL, Spark, AI, and third-party engines in an open and interoperable fashion. This service provides adaptive and autonomous table management, high-performance streaming, auto-AI-generated insights, practically infinite serverless scalability, and improved governance. Cloud storage enables fail-safe features and centralised fine-grained access control management in their managed solution.
Finaly, AI platform autonomous data optimises. Scaling resources, managing workloads, and ensuring cost-effectiveness are its competencies. The new BigQuery spend commit unifies spending throughout BigQuery platform and allows flexibility in shifting spend across streaming, governance, data processing engines, and more, making purchase easier.
Start your data and AI adventure with BigQuery data migration. Google Cloud wants to know how you innovate with data.
#technology#technews#govindhtech#news#technologynews#BigQuery autonomous data to AI platform#BigQuery#autonomous data to AI platform#BigQuery platform#autonomous data#BigQuery AI Query Engine
2 notes
·
View notes
Text
Data warehousing solution
Unlocking the Power of Data Warehousing: A Key to Smarter Decision-Making
In today's data-driven world, businesses need to make smarter, faster, and more informed decisions. But how can companies achieve this? One powerful tool that plays a crucial role in managing vast amounts of data is data warehousing. In this blog, we’ll explore what data warehousing is, its benefits, and how it can help organizations make better business decisions.
What is Data Warehousing?
At its core, data warehousing refers to the process of collecting, storing, and managing large volumes of data from different sources in a central repository. The data warehouse serves as a consolidated platform where all organizational data—whether from internal systems, third-party applications, or external sources—can be stored, processed, and analyzed.
A data warehouse is designed to support query and analysis operations, making it easier to generate business intelligence (BI) reports, perform complex data analysis, and derive insights for better decision-making. Data warehouses are typically used for historical data analysis, as they store data from multiple time periods to identify trends, patterns, and changes over time.
Key Components of a Data Warehouse
To understand the full functionality of a data warehouse, it's helpful to know its primary components:
Data Sources: These are the various systems and platforms where data is generated, such as transactional databases, CRM systems, or external data feeds.
ETL (Extract, Transform, Load): This is the process by which data is extracted from different sources, transformed into a consistent format, and loaded into the warehouse.
Data Warehouse Storage: The central repository where cleaned, structured data is stored. This can be in the form of a relational database or a cloud-based storage system, depending on the organization’s needs.
OLAP (Online Analytical Processing): This allows for complex querying and analysis, enabling users to create multidimensional data models, perform ad-hoc queries, and generate reports.
BI Tools and Dashboards: These tools provide the interfaces that enable users to interact with the data warehouse, such as through reports, dashboards, and data visualizations.
Benefits of Data Warehousing
Improved Decision-Making: With data stored in a single, organized location, businesses can make decisions based on accurate, up-to-date, and complete information. Real-time analytics and reporting capabilities ensure that business leaders can take swift action.
Consolidation of Data: Instead of sifting through multiple databases or systems, employees can access all relevant data from one location. This eliminates redundancy and reduces the complexity of managing data from various departments or sources.
Historical Analysis: Data warehouses typically store historical data, making it possible to analyze long-term trends and patterns. This helps businesses understand customer behavior, market fluctuations, and performance over time.
Better Reporting: By using BI tools integrated with the data warehouse, businesses can generate accurate reports on key metrics. This is crucial for monitoring performance, tracking KPIs (Key Performance Indicators), and improving strategic planning.
Scalability: As businesses grow, so does the volume of data they collect. Data warehouses are designed to scale easily, handling increasing data loads without compromising performance.
Enhanced Data Quality: Through the ETL process, data is cleaned, transformed, and standardized. This means the data stored in the warehouse is of high quality—consistent, accurate, and free of errors.
Types of Data Warehouses
There are different types of data warehouses, depending on how they are set up and utilized:
Enterprise Data Warehouse (EDW): An EDW is a central data repository for an entire organization, allowing access to data from all departments or business units.
Operational Data Store (ODS): This is a type of data warehouse that is used for storing real-time transactional data for short-term reporting. An ODS typically holds data that is updated frequently.
Data Mart: A data mart is a subset of a data warehouse focused on a specific department, business unit, or subject. For example, a marketing data mart might contain data relevant to marketing operations.
Cloud Data Warehouse: With the rise of cloud computing, cloud-based data warehouses like Google BigQuery, Amazon Redshift, and Snowflake have become increasingly popular. These platforms allow businesses to scale their data infrastructure without investing in physical hardware.
How Data Warehousing Drives Business Intelligence
The purpose of a data warehouse is not just to store data, but to enable businesses to extract valuable insights. By organizing and analyzing data, businesses can uncover trends, customer preferences, and operational inefficiencies. Some of the ways in which data warehousing supports business intelligence include:
Customer Segmentation: Companies can analyze data to segment customers based on behavior, demographics, or purchasing patterns, leading to better-targeted marketing efforts.
Predictive Analytics: By analyzing historical data, businesses can forecast trends and predict future outcomes, such as sales, inventory needs, and staffing levels.
Improved Operational Efficiency: With data-driven insights, businesses can streamline processes, optimize supply chains, and reduce costs. For example, identifying inventory shortages or surplus can help optimize stock levels.
Challenges in Data Warehousing
While the benefits of data warehousing are clear, there are some challenges to consider:
Complexity of Implementation: Setting up a data warehouse can be a complex and time-consuming process, requiring expertise in database management, ETL processes, and BI tools.
Data Integration: Integrating data from various sources with differing formats can be challenging, especially when dealing with legacy systems or unstructured data.
Cost: Building and maintaining a data warehouse can be expensive, particularly when managing large volumes of data. However, the investment is often worth it in terms of the business value generated.
Security: With the consolidation of sensitive data in one place, data security becomes critical. Organizations need robust security measures to prevent unauthorized access and ensure compliance with data protection regulations.
The Future of Data Warehousing
The world of data warehousing is constantly evolving. With advancements in cloud technology, machine learning, and artificial intelligence, businesses are now able to handle larger datasets, perform more sophisticated analyses, and automate key processes.
As companies increasingly embrace the concept of a "data-driven culture," the need for powerful data warehousing solutions will continue to grow. The integration of AI-driven analytics, real-time data processing, and more intuitive BI tools will only further enhance the value of data warehouses in the years to come.
Conclusion
In today’s fast-paced, data-centric world, having access to accurate, high-quality data is crucial for making informed business decisions. A robust data warehousing solution enables businesses to consolidate, analyze, and extract valuable insights from their data, driving smarter decision-making across all departments. While building a data warehouse comes with challenges, the benefits—improved efficiency, better decision-making, and enhanced business intelligence—make it an essential tool for modern organizations.
You said:
blog for Data warehousing
ChatGPT said:
Title: Data Warehousing: The Backbone of Data-Driven Decision Making
In today’s fast-paced business environment, the ability to make data-driven decisions quickly is paramount. However, to leverage data effectively, companies need more than just raw data. They need a centralized, structured system that allows them to store, manage, and analyze data seamlessly. This is where data warehousing comes into play.
Data warehousing has become the cornerstone of modern business intelligence (BI) systems, enabling organizations to unlock valuable insights from vast amounts of data. In this blog, we’ll explore what data warehousing is, why it’s important, and how it drives smarter decision-making.
What is Data Warehousing?
At its core, data warehousing refers to the process of collecting and storing data from various sources into a centralized system where it can be easily accessed and analyzed. Unlike traditional databases, which are optimized for transactional operations (i.e., data entry, updating), data warehouses are designed specifically for complex queries, reporting, and data analysis.
A data warehouse consolidates data from various sources—such as customer information systems, financial systems, and even external data feeds—into a single repository. The data is then structured and organized in a way that supports business intelligence (BI) tools, enabling organizations to generate reports, create dashboards, and gain actionable insights.
Key Components of a Data Warehouse
Data Sources: These are the different systems or applications that generate data. Examples include CRM systems, ERP systems, external APIs, and transactional databases.
ETL (Extract, Transform, Load): This is the process by which data is pulled from different sources (Extract), cleaned and converted into a usable format (Transform), and finally loaded into the data warehouse (Load).
Data Warehouse Storage: The actual repository where structured and organized data is stored. This could be in traditional relational databases or modern cloud-based storage platforms.
OLAP (Online Analytical Processing): OLAP tools enable users to run complex analytical queries on the data warehouse, creating reports, performing multidimensional analysis, and identifying trends.
Business Intelligence Tools: These tools are used to interact with the data warehouse, generate reports, visualize data, and help businesses make data-driven decisions.
Benefits of Data Warehousing
Improved Decision Making: By consolidating data into a single repository, decision-makers can access accurate, up-to-date information whenever they need it. This leads to more informed, faster decisions based on reliable data.
Data Consolidation: Instead of pulling data from multiple systems and trying to make sense of it, a data warehouse consolidates data from various sources into one place, eliminating the complexity of handling scattered information.
Historical Analysis: Data warehouses are typically designed to store large amounts of historical data. This allows businesses to analyze trends over time, providing valuable insights into long-term performance and market changes.
Increased Efficiency: With a data warehouse in place, organizations can automate their reporting and analytics processes. This means less time spent manually gathering data and more time focusing on analyzing it for actionable insights.
Better Reporting and Insights: By using data from a single, trusted source, businesses can produce consistent, accurate reports that reflect the true state of affairs. BI tools can transform raw data into meaningful visualizations, making it easier to understand complex trends.
Types of Data Warehouses
Enterprise Data Warehouse (EDW): This is a centralized data warehouse that consolidates data across the entire organization. It’s used for comprehensive, organization-wide analysis and reporting.
Data Mart: A data mart is a subset of a data warehouse that focuses on specific business functions or departments. For example, a marketing data mart might contain only marketing-related data, making it easier for the marketing team to access relevant insights.
Operational Data Store (ODS): An ODS is a database that stores real-time data and is designed to support day-to-day operations. While a data warehouse is optimized for historical analysis, an ODS is used for operational reporting.
Cloud Data Warehouse: With the rise of cloud computing, cloud-based data warehouses like Amazon Redshift, Google BigQuery, and Snowflake have become popular. These solutions offer scalable, cost-effective, and flexible alternatives to traditional on-premises data warehouses.
How Data Warehousing Supports Business Intelligence
A data warehouse acts as the foundation for business intelligence (BI) systems. BI tools, such as Tableau, Power BI, and QlikView, connect directly to the data warehouse, enabling users to query the data and generate insightful reports and visualizations.
For example, an e-commerce company can use its data warehouse to analyze customer behavior, sales trends, and inventory performance. The insights gathered from this analysis can inform marketing campaigns, pricing strategies, and inventory management decisions.
Here are some ways data warehousing drives BI and decision-making:
Customer Insights: By analyzing customer purchase patterns, organizations can better segment their audience and personalize marketing efforts.
Trend Analysis: Historical data allows companies to identify emerging trends, such as seasonal changes in demand or shifts in customer preferences.
Predictive Analytics: By leveraging machine learning models and historical data stored in the data warehouse, companies can forecast future trends, such as sales performance, product demand, and market behavior.
Operational Efficiency: A data warehouse can help identify inefficiencies in business operations, such as bottlenecks in supply chains or underperforming products.

2 notes
·
View notes
Text
𝐓𝐨𝐩 5 𝐅𝐮𝐭𝐮𝐫𝐢𝐬𝐭𝐢𝐜 𝐒𝐢𝐝𝐞 𝐇𝐮𝐬𝐭𝐥𝐞𝐬 𝐟𝐨𝐫 𝐓𝐞𝐜𝐡𝐢𝐞𝐬 𝐢𝐧 2025
In today’s fast-paced tech world, side hustles can be a fantastic way for professionals to boost their skills and earn extra income. With advancements in artificial intelligence, remote working, and a growing need for tech solutions, 2025 is filled with exciting possibilities for tech enthusiasts.
This post dives into five promising side hustles, supported by data and trends. Techies can capitalize on their expertise and thrive in these areas.
1. Remote IT Support
With businesses shifting to hybrid work models, the demand for remote IT support has skyrocketed. According to a report from the International Data Corporation (IDC), the global IT services market is set to hit $1 trillion by 2025, hinting at tremendous opportunities in this field.
Techies with skills in troubleshooting can offer services to both businesses and individuals. The TechServe Alliance notes that the demand for IT support roles surged over 10% last year, making this a vibrant market.
Starting a remote IT support hustle is easy. Freelancing platforms like Upwork and Fiverr allow techies to find clients quickly. Depending on the complexity of the service, they can earn between $25 and $150 per hour while enjoying the flexibility to work on their own schedule.
2. Cybersecurity Consulting
As cyber threats evolve, companies increasingly prioritize cybersecurity. A report from Cybersecurity Ventures predicts that costs from cybercrime could reach $10.5 trillion annually by 2025. This statistic underscores the growing need for cybersecurity professionals.
Techies with experience in cybersecurity can offer their services to businesses looking to protect sensitive data. A survey by Proofpoint found that 55% of organizations fended off phishing attacks, indicating a strong demand for seasoned professionals.
In this consulting niche, technology experts can earn between $100 and $500 per hour, based on their experience and project complexity. Earning certifications, like the Certified Information Systems Security Professional (CISSP), can significantly boost credibility and income potential.
Minimize image
Edit image
Delete image

3. Software Development and Mobile App Creation
As the world becomes more mobile-first, demand for software and app development is expected to rise. Statista reports that the global app economy may generate over $407.31 billion in revenue by 2026, presenting a lucrative chance for techies skilled in coding.
Developers can enter this space through freelancing or by launching their own projects. Tools like React Native and Flutter allow for efficient cross-platform application development, saving both time and resources.
Freelancers can charge between $50 and $200 per hour based on expertise and project scope. For those willing to turn a side hustle into a full business, the income from app sales and in-app purchases can be enormous.
4. Data Analysis and Visualization
Data remains one of the most valuable assets today, with analytics aiding decision-making. The global data analytics market might reach $300 billion by 2026, creating fertile ground for techies skilled in data analysis.
Freelance data analysts can help companies extract valuable insights from their data. Utilizing tools like Tableau, Power BI, and R can help create compelling visualizations, making their services even more attractive.
Data analysts typically charge between $40 and $150 per hour depending on analysis complexity. Mastering data storytelling enables techies to transform raw data into practical insights, positioning themselves as key assets for businesses.
5. E-Learning Course Creation
The rapid growth of online learning has made creating and selling e-learning courses a sought-after side hustle. The global e-learning market is anticipated to reach $375 billion by 2026, driven by rising demand for skill development.
Techies can harness their knowledge to develop courses on platforms like Udemy or Teachable. Topics can range from programming languages to software tools and emerging technologies, such as AI and machine learning. Statista reported that 42% of online course creators are tech professionals, showing the market's strong bias toward technical education.
Successful courses can generate substantial passive income, sometimes yielding thousands of dollars. Since course creation has low overhead, techies can concentrate on producing high-quality content and devising effective marketing strategies.
Minimize image
Edit image
Delete image

Unlocking New Opportunities in Tech
The side hustles mentioned offer exciting paths for tech-savvy individuals aiming to enhance their skills and income in 2025.
As technology keeps evolving, the need for skilled professionals in IT support, cybersecurity, software development, data analysis, and e-learning will continue to grow.
By leveraging their expertise and using the right platforms, techies can build rewarding side hustles that provide financial perks and opportunities for personal and career growth.
Whether solving challenging problems for clients, creating innovative apps, or imparting knowledge, the potential for side hustles in the tech sector is vast. The key is to find a niche that aligns with personal interests, engage in continuous learning, and embrace the entrepreneurial spirit in this dynamic environment.
In a landscape where technology is at the center of everyday life, techies hold a unique position to lead future innovations. Engaging in these side hustles will not only keep them relevant but also equip them for the challenges and opportunities that lie ahead.
#TechSideHustles#RemoteITSupport#Cybersecurity#SoftwareDevelopment#DataAnalysis#MobileAppDevelopment#Elearning#Freelancing#TechEntrepreneur#FreelanceLife#TechProfessionals#FutureOfWork#TechOpportunities#DigitalTransformation#AI#DataVisualization#Coding#TechConsulting#OnlineLearning#CareerGrowth#TechSkills
2 notes
·
View notes
Text
Business Analytics vs. Data Science: Understanding the Key Differences

In today's data-driven world, terms like "business analytics" and "data science" are often used interchangeably. However, while they share a common goal of extracting insights from data, they are distinct fields with different focuses and methodologies. Let's break down the key differences to help you understand which path might be right for you.
Business Analytics: Focusing on the Present and Past
Business analytics primarily focuses on analyzing historical data to understand past performance and inform current business decisions. It aims to answer questions like:
What happened?
Why did it happen?
What is happening now?
Key characteristics of business analytics:
Descriptive and Diagnostic: It uses techniques like reporting, dashboards, and data visualization to summarize and explain past trends.
Structured Data: It often works with structured data from databases and spreadsheets.
Business Domain Expertise: A strong understanding of the specific business domain is crucial.
Tools: Business analysts typically use tools like Excel, SQL, Tableau, and Power BI.
Focus: Optimizing current business operations and improving efficiency.
Data Science: Predicting the Future and Building Models
Data science, on the other hand, focuses on building predictive models and developing algorithms to forecast future outcomes. It aims to answer questions like:
What will happen?
How can we make it happen?
Key characteristics of data science:
Predictive and Prescriptive: It uses machine learning, statistical modeling, and AI to predict future trends and prescribe optimal actions.
Unstructured and Structured Data: It can handle both structured and unstructured data from various sources.
Technical Proficiency: Strong programming skills (Python, R) and a deep understanding of machine learning algorithms are essential.
Tools: Data scientists use programming languages, machine learning libraries, and big data technologies.
Focus: Developing innovative solutions, building AI-powered products, and driving long-term strategic initiatives.
Key Differences Summarized:

Which Path is Right for You?
Choose Business Analytics if:
You are interested in analyzing past data to improve current business operations.
You have a strong understanding of a specific business domain.
You prefer working with structured data and using visualization tools.
Choose Data Science if:
You are passionate about building predictive models and developing AI-powered solutions.
You have a strong interest in programming and machine learning.
You enjoy working with both structured and unstructured data.
Xaltius Academy's Data Science & AI Course:
If you're leaning towards data science and want to delve into machine learning and AI, Xaltius Academy's Data Science & AI course is an excellent choice. This program equips you with the necessary skills and knowledge to become a proficient data scientist, covering essential topics like:
Python programming
Machine learning algorithms
Data visualization
And much more!
By understanding the distinct roles of business analytics and data science, you can make an informed decision about your career path and leverage the power of data to drive success.
2 notes
·
View notes
Text
Which program (MBA or PGDM) is better for a career in consulting?
Top PGDM/MBA with Business Analytics Colleges in Greater Noida, Bangalore, Gurgaon & MAT45% Percentile Colleges in Ghaziabad
Introduction
In today’s data-driven world, Business Analytics has become a crucial component of management education. Students aspiring to build a career in business intelligence, data analytics, and strategic decision-making often opt for PGDM/MBA with Business Analytics programs. If you are searching for the best PGDM/MBA with Business Analytics colleges in Greater Noida, Bangalore, and Gurgaon, or if you have a MAT 45% percentile score and are looking for colleges in Ghaziabad, this guide will help you make the right choice.
Why Choose PGDM/MBA with Business Analytics?
A PGDM/MBA with Business Analytics program integrates advanced data analytics, statistical modeling, artificial intelligence, and machine learning with business decision-making. This specialization prepares students for high-demand careers in fields such as finance, marketing, operations, and consulting.
Key Benefits:
Industry-oriented curriculum focusing on real-world analytics applications.
Exposure to tools like Python, R, SQL, Tableau, and Power BI.
Strong placement opportunities with leading companies.
Hands-on experience through internships, live projects, and case studies.
Top PGDM/MBA with Business Analytics Colleges in Greater Noida
Greater Noida has emerged as an education hub, offering some of the best PGDM/MBA programs with a Business Analytics specialization. Here are the top institutes:
1. Birla Institute of Management Technology (BIMTECH), Greater Noida
One of the leading B-schools in India.
Offers PGDM in Business Analytics with strong corporate collaborations.
Excellent placement records with top recruiters like Deloitte, EY, and PwC.
2. Galgotias University, Greater Noida
Offers an MBA with Business Analytics as a primary focus.
Industry-driven curriculum and data analytics labs.
Tie-ups with leading tech companies for practical exposure.
3. Sharda University, Greater Noida
Offers an MBA with a focus on Business Analytics and Big Data.
Strong industry partnerships for real-world learning.
Well-equipped infrastructure and expert faculty.
Best PGDM/MBA with Business Analytics Colleges in Bangalore
Bangalore, known as the Silicon Valley of India, is home to top business schools offering Business Analytics specializations.
1. Indian Institute of Management Bangalore (IIMB)
One of India’s premier business schools.
Offers an MBA with Business Analytics courses integrated into the curriculum.
Strong industry collaborations with top tech firms.
2. Christ University, Bangalore
Provides an MBA in Business Analytics with hands-on exposure to analytics tools.
Strong placement record with companies like Google, Amazon, and Microsoft.
Experienced faculty and corporate tie-ups for practical learning.
3. Alliance University, Bangalore
Offers a PGDM in Business Analytics.
Focus on machine learning, AI, and data visualization.
Excellent placement support and industry projects.
Top PGDM/MBA with Business Analytics Colleges in Gurgaon
Gurgaon, a leading corporate and technology hub, offers great options for students looking for PGDM/MBA programs in Business Analytics.
1. Management Development Institute (MDI), Gurgaon
One of India’s top-ranked B-schools.
Offers a PGDM in Business Analytics with strong industry exposure.
High placement rates with top firms in consulting and finance.
2. Amity Business School, Gurgaon
Provides an MBA in Business Analytics.
Focuses on AI, big data, and digital transformation.
Good placement assistance with reputed organizations.
3. ICFAI Business School (IBS), Gurgaon
Offers a well-structured MBA with a Business Analytics specialization.
Practical exposure through industry projects and workshops.
Collaborations with analytics firms for real-time learning.
MAT 45% Percentile Colleges in Ghaziabad
If you have a MAT 45% percentile score, you can still get admission to reputed management colleges in Ghaziabad. Here are some of the top options:
1. Institute of Management Studies (IMS), Ghaziabad
Accepts MAT scores for PGDM admissions.
Offers Business Analytics as a specialization.
Strong faculty and placement support.
2. Institute of Technology & Science (ITS), Ghaziabad
Provides PGDM with a focus on Business Analytics.
Industry-aligned curriculum with data science training.
Placement support in reputed companies.
3. Jaipuria Institute of Management, Ghaziabad
Accepts MAT scores and provides a well-structured MBA program.
Specializes in Business Analytics, Marketing, and Finance.
Strong industry tie-ups for internships and placements.
Conclusion
A PGDM/MBA with Business Analytics is a valuable investment for those looking to build a career in data-driven decision-making. Whether you are looking for top colleges in Greater Noida, Bangalore, or Gurgaon, or seeking admission in MAT 45% percentile colleges in Ghaziabad, there are several excellent institutions to choose from.
When selecting a college, consider factors like faculty expertise, curriculum, placement records, and industry collaborations to make the right choice.
For more details on admissions and career guidance, stay connected with Pathshalahub – your trusted education consultation platform!
#college#high school#school system#success#studying#university#Ahmedabad – IIM Ahmedabad#Bangalore – IIM Bangalore#Christ University#XIME#Kolkata – IIM Calcutta#IMI Kolkata#Delhi – FMS Delhi#IMI Delhi#IIT Delhi (DMS)#Mumbai – SPJIMR#NMIMS#JBIMS#IIT Bombay (SJMSOM)#Hyderabad – ISB Hyderabad#IIM Hyderabad#ICFAI Business School#Chennai – Great Lakes#IIT Madras (DoMS)#Loyola Institute of Business Administration (LIBA)#Lucknow – IIM Lucknow#Indore – IIM Indore#Pune – Symbiosis (SIBM)#PUMBA#BIMM
2 notes
·
View notes
Text
power BI: the program that takes five minutes to set up a simple model for your data, and multiple hours to mess with it and get the formatting exactly how you need it 🫠
5 notes
·
View notes