#data science dashboard
Explore tagged Tumblr posts
Visit Tumblr Blog
Explore Tumblr blogs with no restrictions, modern design and the best experience.
Last Seen Tumblr Blogs


Fun Fact
Mobile Tumblr US users spend an average of 4.04 minutes per session on the app.
Text
005 Computer programming, programs, and data
A brief summary of how user engagement is tracked on Tumblr, for the newcomer:
When you like or reblog a post, that counts as user engagement for the person you liked or reblogged from, and shows up in their notifications.
If the person you liked or reblogged a post from wasn’t the original poster (i.e., you’re liking or reblogging a reblog), it also counts as user engagement for the original poster, and shows up in their notifications as well.
This means that user engagement from your likes and reblogs can potential accrue to two different people, the original poster and the person you liked or reblogged from.
Consequently, you cannot “steal” user engagement from someone by reblogging their post.
This is one of the very few areas where Tumblr is actually functions more reasonably than other social media platforms.
Note that this is only true if you use Tumblr’s built-in reblogging function. If you save someone else’s content to your local device and append it to a new post, you effectively become the original poster from that point on.
This means that on Tumblr, “reblogging” and “reposting” are two different things; if you see someone complaining about “reposting”, this is not the same as reblogging.
Commenting when reblogging does not affect any of this – unlike, say, Twitter, where quote-retweeting causes user engagement to accrue to the quote-retweet and not to the original tweet – and you can and should do so freely.
However, every Tumblr user can see who exactly you reblogged a post from, which functions as a soft disincentive against making inane comments; if you make a dumb comment on a reblog, people who see your reblog may “back up” one step in the reblog chain to reblog a version of the post without your comment.
Nobody understands tags, and there’s a fair amount of evidence that how tags work changes periodically and without warning.
Tags are a divine mystery.
#class 000 – computer science information & general works#000 computer science knowledge & systems#005 computer programming programs & data#dewey decimal system#makeitdewey#Tumblr#dashboard
104K notes
·
View notes
Text

VADY – Harnessing AI to Boost Your Business
Artificial intelligence is a game-changer, and VADY brings its full potential to your business. By harnessing AI, we streamline operations, improve decision-making, and drive efficiency across various functions. From predictive analytics to personalized customer experiences, VADY ensures that AI doesn’t just optimize data—it accelerates your business growth. With our advanced AI solutions, businesses can unlock new efficiencies, reduce costs, and discover emerging opportunities faster than ever before. Whether automating routine tasks or uncovering hidden insights, VADY’s AI capabilities empower organizations to stay competitive, adapt to market changes, and boost overall performance for lasting success.
#vady#newfangled#data democratization#data analytics#big data#machine learning#data at fingertip#ai to generate dashboard#ai enabled dashboard#generativeai#generativebi#data analysis#data mining#nlp#data privacy#data visualization#data science#datadrivendecisions#datadrivenstrategies#artificial intelligence
0 notes
Text
Industry-Leading Visualization with Tableau Data Visualization

1. User-Friendly Interface: The intuitive design allows anyone to easily start visualizing data.
2. Seamless Integration: Connects easily with various data sources for efficient analysis.
3. Quick Insights: Generate actionable insights within minutes.
4. Integrated Collaboration Tools: Share dashboards and insights with your team effortlessly.
5. Regular Updates: Tableau continuously evolves with new features and improvements.
Want to take your skills to the next level? Join our 1-day Tableau Bootcamp on 2nd November (Online)!
#tableau#tableau software#data visualization#data visualisation#dataviz#software#technology#cavillion#cavillion learning#data analytics#data#tableau online training#tableaudesktop#tableau dashboard#big data#business analytics#data analysis#data science#tableau course#salesforce#Tableau Tutorial#Tableau Visualization#Tableau Training#learn tableau#tableau certification#Tableau Visualisation
1 note
·
View note
Text
Using spatial learning to transform math and science education
New Post has been published on https://thedigitalinsider.com/using-spatial-learning-to-transform-math-and-science-education/
Using spatial learning to transform math and science education
Legend has it that Isaac Newton was sitting under a tree when an apple fell on his head, sparking a bout of scientific thinking that led to the theory of gravity. It’s one of the most famous stories in science, perhaps because it shows the power of simple human experiences to revolutionize our understanding of the world around us.
About five years ago, Anurupa Ganguly ’07, MNG ’09 noticed kids don’t learn that way in schools.
“Students should learn how to use language, notation, and eventually shorthand representation of thoughts from deeply human experiences,” Ganguly says.
That’s the idea behind PrismsVR. The company offers virtual reality experiences for students, using physical learning to teach core concepts in math and science.
The platform can radically change the dynamics of the classroom, encouraging self-paced, student-led learning, where the teacher is focused on asking the right questions and sparking curiosity.
Instead of learning biology with a pen and paper, students become biomedical researchers designing a tissue regeneration therapy. Instead of learning trigonometry in a textbook, students become rural architects designing a new school building.
“We’re building a whole new learning platform, methodology, and tech infrastructure that allows students to experience problems in the first person, not through abstractions or 2D screens, and then go from that experience to ascribe meaning, language, and build up to equations, procedures, and other nomenclature,” Ganguly explains.
Students can rotate their bodies to minimize the distance between a trend line and the data points, to find the line of best fit and formalize the concept of residuals.
Image: Courtesy of PrismsVR
Today PrismsVR has been used by about 300,000 students across 35 states. The company’s approach was shown to boost algebra test scores by 11 percent in one study, with larger, multistate studies currently underway through funding from the Gates Foundation.
“Education has been in desperate need of real reform for many years,” Ganguly says. “But what’s happened is we’ve just been digitizing old, antiquated teaching methods instead. We would take a lecture and make it a video, or take a worksheet and make it a web app. I think districts see us taking a more aspirational approach, with multimodal interaction and concepts at the center of learning design, and are collaborating with us to scale that instead. We want to get this to every single public school student across the U.S., and then we’re going into community colleges, higher ed, and international.”
A new paradigm for learning
Ganguly was an undergraduate and master’s student in MIT’s Department of Electrical Engineering and Computer Science. When she began as an undergrad in 2003, she estimates that women made up about 30 percent of her class in the department, but as she advanced in her studies, that number seemed to dwindle.
“It was a disappearing act for some students, and I became inspired to understand what’s happening at the K-12 levels that set some students up for success and led to fragile foundations for others,” Ganguly recalls.
As she neared the end of her graduate program in 2009, Ganguly planned to move to California to take an engineering job. But as she was walking through MIT’s Infinite Corridor one day, a sign caught her eye. It was for Teach for America, which had collaborated with MIT to recruit students into the field of teaching, particularly for high need and high poverty students.
“I was inspired by that idea that I could use my education, engineering background, and disciplined systems thinking to think through systemic change in the public sector,” says Ganguly, who became a high school physics and algebra teacher in the Boston Public Schools.
Ganguly soon left the classroom and became director of math for the district, where she oversaw curriculum and teacher upskilling. From there, Ganguly went to New York City Public Schools, where she also supported curriculum development, trying to relate abstract math concepts to students’ experiences in the real world.
“As I began to travel from school to school, working with millions of kids, I became convinced that we don’t have the tools to solve the problem I thought about at MIT — of truly leveling the playing field and building enduring identities in the mathematical sciences,” Ganguly says.
The problem as Ganguly sees it is that students’ world is 3D, complex, and multimodal. Yet most lessons are confined to paper or tablets. For other things in life, students learn through their complex experiences: through their senses, movement, and emotions. Why should math and science be any different? In 2018, the Oculus Quest VR headset was released, and Ganguly thought she had found a more effective learning medium to scale how we learn.
But starting an education company based on virtual reality at the time was audacious. The 128-gigabyte Quest was priced at $500, and there were no standards-based VR curricula or standalone VR headsets in U.S. K-12 schools.
“Investors weren’t going to touch this,” Ganguly jokes.
Luckily, Ganguly received a small amount of funding from the National Science Foundation to build her first prototype. Ganguly started with Algebra 1; performance in this class is one of the top predictors of lifetime wages but has shown a stubbornly persistent achievement gap.
Her first module, which she built during the pandemic, places students in a food hall when a sudden announcement from the mayor rings out. There’s an alarming growth of an unknown virus in the area. The students get the power to travel back in time to see how the virus is spreading, from one person’s sneeze to many people’s behaviors in a demonstration of multiplicative growth.
The people turn to dots in a simulation as the journey moves to interactive, tactile data visualization, and the students are charged with figuring out how many weeks until the hospitals run out of capacity. Once the learning design for VR was established, Ganguly continued to build experiences across the curriculum in geometry, algebra II and III, biology, chemistry, and middle school subjects. Today Prisms covers all math and science subjects in grades seven to eleven, and the company is currently building out calculus, data science, and statistics for upper and postsecondary school. By the fall of 2025, Prisms will have evergreen content up to grade level 14.
Following the experiences, students gather in small groups to reflect on the lessons and write summaries. As students go through their virtual experiences, teachers have a web dashboard to monitor each child’s progress to support and intervene where needed.
“With our solution, the role of the teacher is to be Socrates and to ask high-quality questions, not deliver knowledge” Ganguly says.
As a solo founder, Ganguly says support from MIT’s Venture Mentoring Service, which offers members of the MIT community startup guidance in the form of “board meetings” led by successful entrepreneurs, was crucial.
“The MIT founder community is different,” Ganguly says. “We’re often technical founders, building for ourselves, and we build our company’s first product. Moving from product to your go-to-market strategy and hiring is a unique journey for product-minded founders.”
From textbooks to experiences
A few years ago, Ganguly’s team was leading a classroom coaching session in a Virginia school district when a teacher told her about a student named Silas.
“The teacher was saying, ‘Silas never does anything, he just sits in the back of class,’” Ganguly recalls. “I’ve seen this like clockwork, so we just said, ‘Let’s give Silas a fresh shot and see what we can do.’ Lo and behold, Silas was the first one to finish the module and write a full synthesis report. The teacher told me that was the first time Silas has turned in an assignment with everything filled in.”
Ganguly says it’s one of thousands of anecdotes she has.
“A lot of students feel shut out of the modern math classroom because of our stubborn approach of drill and kill,” Ganguly says. “Students want to learn through great stories. They want to help people. They want to be empathetic. They want their math education to matter.”
Ganguly sees PrismsVR as a fundamentally new way for students to learn no matter where they are.
“We intend to become the next textbook,” Ganguly says. “The next textbooks will be spatial and experiential.”
#000#3d#Alumni/ae#America#app#apple#approach#background#Biology#board#Building#california#change#chemistry#colleges#Community#computer#Computer Science#content#curiosity#dashboard#data#data science#Data Visualization#Design#development#dynamics#education#Education#teaching
0 notes
Text
Developing a Power BI Dashboard for Acube AI

In today’s data-driven world, businesses require robust tools to convert raw data into actionable insights. Acube AI is at the forefront of this transformation, leveraging advanced analytics and AI to provide comprehensive data solutions. One of their flagship offerings is the Power BI Dashboard, a powerful tool that enables businesses to visualize, analyze, and interpret their data effectively. This article delves into the creation, features, and benefits of a Power BI Dashboard tailored for Acube AI’s website and business needs.
Understanding Acube AI’s Requirements
Acube AI focuses on providing data analytics and AI-driven solutions to various industries. Therefore, the Power BI Dashboard should reflect the diverse needs of its clients while showcasing Acube AI’s capabilities. Key requirements might include:
Data Integration: Combining data from multiple sources.
Real-time Analysis: Providing up-to-the-minute insights.
Customizable Visuals: Tailoring visuals to different business needs.
User Accessibility: Ensuring the dashboard is easy to use and accessible from various devices.
Key Features of the Power BI Dashboard
Data Integration
Seamless Connectivity: The dashboard can integrate data from various sources such as databases, cloud services, and local files. This integration ensures that users can view comprehensive datasets in one place, enhancing data analysis efficiency.
Automated Data Refresh: Implementing automated data refresh cycles ensures that the dashboard always displays the latest information, facilitating real-time decision-making.
Interactive Visuals
Customizable Charts and Graphs: Users can create and customize a wide range of visuals, including bar charts, pie charts, line graphs, and maps. These visuals help in better understanding complex data sets.
Drill-Down Features: Allowing users to drill down into specific data points provides deeper insights and a more detailed analysis.
Real-Time Analysis
Live Data Streams: Incorporating live data streams enables users to monitor data in real time, crucial for operations that require immediate attention.
Alert and Notification System: Setting up alerts for specific data thresholds helps in proactive management and timely decision-making.
User-Friendly Interface
Intuitive Design: An easy-to-navigate interface ensures that users, regardless of their technical proficiency, can effectively use the dashboard.
Responsive Layout: A design that adapts to different screen sizes ensures accessibility on various devices, including desktops, tablets, and smartphones.

Benefits of Using a Power BI Dashboard
Enhanced Decision-Making
Comprehensive Data View: A centralized dashboard provides a holistic view of all business metrics, making it easier to identify trends and make informed decisions.
Predictive Analytics: Leveraging AI, the dashboard can offer predictive insights, helping businesses forecast trends and prepare accordingly.
Efficiency and Productivity
Automated Reporting: Automating the data reporting process saves time and reduces the likelihood of human error, allowing teams to focus on analysis and strategy.
Collaborative Tools: Features that allow for easy sharing and collaboration on reports and dashboards enhance teamwork and streamline workflows.
Scalability
Adaptability: The dashboard can scale with the business, accommodating growing data sets and more complex analytical needs without compromising performance.
Flexible Licensing: Offering various licensing options allows businesses to choose a plan that best fits their size and needs.
Accessibility
Cloud Integration: Cloud-based dashboards provide the flexibility to access data from anywhere, facilitating remote work and global collaboration.
Role-Based Access: Ensuring that sensitive data is only accessible to authorized users enhances security and compliance.
Applications of the Power BI Dashboard
Sales and Marketing
Performance Metrics: Tracking sales performance, customer acquisition costs, and conversion rates helps in optimizing marketing strategies and improving ROI.
Campaign Analysis: Analyzing marketing campaigns in real time allows for quick adjustments and more effective targeting.
Finance
Financial Health Monitoring: Keeping track of key financial indicators such as revenue, expenses, and profit margins provides a clear picture of the company’s financial health.
Budget Forecasting: Using historical data to forecast budgets and plan financial strategies helps in better resource allocation.
Operations
Efficiency Tracking: Monitoring operational efficiency through metrics like production rates, downtime, and inventory levels helps in optimizing processes.
Supply Chain Management: Real-time tracking of supply chain metrics ensures smooth operations and timely delivery of goods.
Why Choose Acube AI for Power BI Solutions?
Acube AI stands out due to its expertise in data analytics and AI. Their team’s proficiency in Power BI ensures that businesses receive high-quality, tailored solutions that meet their unique needs. Key reasons to choose Acube AI include:
Expertise in AI and Data Analytics: Leveraging advanced AI techniques to provide deeper insights.
Tailored Solutions: Customizing dashboards to align with specific business goals and requirements.
Comprehensive Support: Offering ongoing support and training to ensure clients can maximize the value of their dashboards.
Implementing the Power BI Dashboard
Initial Consultation
Understanding Business Needs: A thorough consultation to understand the client’s business objectives, data sources, and specific requirements.
Setting Goals: Defining clear goals and KPIs that the dashboard should achieve.
Data Integration and Preparation
Data Collection: Gathering data from various sources and ensuring it is clean and ready for analysis.
Data Modeling: Structuring the data in a way that makes it easy to analyze and visualize.
Dashboard Design and Development
Prototyping: Creating initial prototypes to ensure the design meets the client’s expectations.
Development: Building the dashboard with interactive visuals and real-time data capabilities.
Testing and Deployment
User Testing: Conducting thorough testing with end-users to ensure functionality and usability.
Deployment: Implementing the dashboard in the client’s environment and providing training for effective use.
Ongoing Support and Optimization
Continuous Monitoring: Regularly monitoring the dashboard’s performance and making necessary adjustments.
User Feedback: Incorporating user feedback to continuously improve the dashboard’s features and usability.
Conclusion
Investing in a Power BI Dashboard from Acube AI can significantly enhance your data analysis capabilities, leading to more informed business decisions and improved performance. By leveraging Acube AI’s expertise, businesses can ensure they have a powerful tool tailored to their specific needs, driving growth and efficiency in today’s competitive market. For more details and to explore how Acube AI can transform your data strategy, visit Acube AI.
#BI Dashboard Solutions#Acube AI#Data Science Expertise#AI Solutions#Data Engineers#Cutting-edge Technology
0 notes
Text

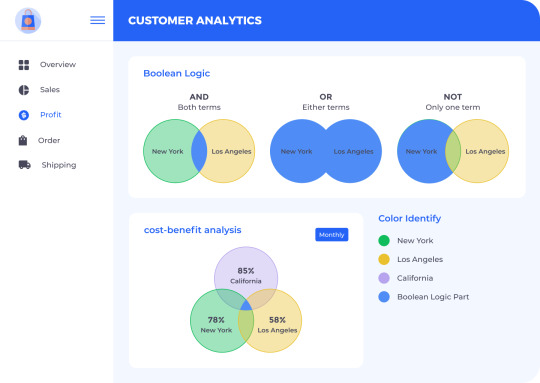

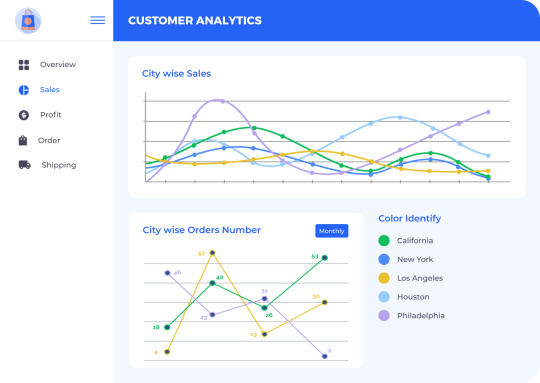
Transform the way you understand your customers with our Customer Analytics Dashboard! It's like having a crystal ball for your business, revealing patterns and guiding your strategy. 📊 Dive into a world where data becomes your superpower – enhancing targeting, boosting sales, and so much more. 📈Step into a new era of informed product strategy and gain that competitive edge. The future is data-driven, and it starts here.
#data#data analytics#data science#data visualization#customer experience#datadriven#dashboard#business#predictive analysis#realtime#omnichannel#storytelling#getondata
1 note
·
View note
Text
Interactive Dashboards in Excel
📢 Exciting news! Check out this amazing tutorial on creating interactive dashboards in Excel using the Superstore dataset from Tableau. 🚀📊 In this step-by-step guide, you'll learn how to create pivot tables, pivot charts (including line charts and bar charts), maps, slicers, and formatting techniques to make your dashboard visually appealing and easily understandable. 📝💡 The author emphasizes that the skills learned in Excel can be applied across different domains and software platforms, as long as you have a solid foundation. So, get ready to enhance your data engineering and analytics expertise! 💪 Click on the link below to access the tutorial and start developing your own interactive dashboards in Excel: 🌐✨ [Interactive Dashboards in Excel](https://ift.tt/3RSFGDb) Happy data exploring! 🎉💼 #Excel #DataVisualization #DataAnalytics #Dashboards List of Useful Links: AI Scrum Bot - ask about AI scrum and agile Our Telegram @itinai Twitter - @itinaicom
#itinai.com#AI#News#Interactive Dashboards in Excel#AI News#AI tools#Innovation#itinai#Jake Teo#LLM#Productivity#Towards Data Science - Medium Interactive Dashboards in Excel
0 notes
Text
The People’s CDC COVID-19 Weather Report: October 14, 2024
The People's CDC has released another updated report on COVID-19 data and action items for the United States of America.
Highlights:
According to data last updated 10/5/2024, the CDC’s national wastewater map shows 16 states with “High” or “Very High” wastewater levels.
According to the Wastewater COVID-19 National and Regional Trends dashboard, all regions continue to show a downward trend over the last several weeks.
Many Bay Area counties are set to reimplement mask mandates in hospitals from November 1 through Spring 2025. Some of the rules apply to only certain healthcare staff while others include visitors and patients. Though these mandates are limited in scope, duration, and geography, a few are expanded compared to last year’s Bay Area mask rules, a sign that pressure on decision makers is working.
In the past week, the California Department of Public Health reported that 6 new cases of bird flu (H5N1) were confirmed in dairy workers in California, with each case being connected to contact with infected cattle in California’s Central Valley. While there is yet no documented human-to-human transmission, each new case presents a greater risk of the virus mutating to spread from human to human.
The Texas State Affairs Committee posted notice of a hearing at the Capitol on October 16 to discuss, among other things, “Unmasking Protestors.” Opposition is mounting, and people are organizing.
Read the rest of the report here:
Please note that the CovidSafeCosplay blog and its admin are unaffiliated with the People's CDC or its management, and are simply sharing the resource.
Via the People's CDC About page:
The People’s CDC is a coalition of public health practitioners, scientists, healthcare workers, educators, advocates and people from all walks of life working to reduce the harmful impacts of COVID-19. We provide guidance and policy recommendations to governments and the public on COVID-19, disseminating evidence-based updates that are grounded in equity, public health principles, and the latest scientific literature. Working alongside community organizations, we are building collective power and centering equity as we work together to end the pandemic. The People’s CDC is volunteer-run and independent of partisan political and corporate interests and includes anonymous local health department and other government employees. The People’s CDC is completely volunteer run with infrastructure support being provided by the People’s Science Network
#news#covid news#covid isn't over#covid 19#covid-19#bird flu#h5n1#health news#bird flu news#people's cdc#the people's cdc#mask up#still coviding#long covid#us news
73 notes
·
View notes
Text
The majority of cases are mild - 1
A mysterious virus is spreading through the city, leaving men with, among other symptoms, disproportionate bubble butts. Mayor Tan speaks in a press briefing while his team debates how long they can keep the situation--and their boss's posterior--under control; Devon, before he ever makes it to the clinic, comes to realize the treatment may not be working with his severe case; and Neil, an ardent journalist, goes to the lab determined to get some information about the crisis.
0 (initial prompt) | 2 (next)
[ ass expansion // bubble butt ]
3102 words
I decided to keep playing around with the ass expansion virus idea (see: previous rambles). I thought a 'triptych' approach might be kind of fun, with three vignettes that are part of an interconnected moment. Which leaves room for a different combination of perspectives told with each part (assuming I ever get around to continuing this). A close second for the title was (thanks to @embarrassedanon !) "Flattening the Curve."
- - - - -
I
“My team has been monitoring the situation, and they assure me, there is nothing to worry about at this time. The majority of cases are–”
“Mayor Tan!” came an insistent voice at the back of the press briefing. “Mr. Mayor, have you seen the latest data about infection rates? What’s your response to the uptick we’re seeing in…”
“Ugh, this guy again,” Ana muttered to the lanky man hovering next to her, both of them posted up just off stage.
Her attention could only last so long for this particular reporter who’d been incessantly crying wolf about this mysterious virus for months. She kept her focus on Mayor Tan, her lips moving along with his response, carefully scripted by her.
“Our rapid response team is world class and will move accordingly when specific thresholds are passed, came the mayor’s voice, as if through Ana’s soundless lips. “Until then, we encourage folks to be careful, but currently there is no need to panic.”
“That’s the guy from The Herald, right?” asked Jay, visibly unused to being even proximate to the spotlight. “He’s been maintaining this super useful data viz dashboard keeping track of the outbreak–”
“Not outbreak,” Ana corrected in a harsh whisper. “It is technically not an outbreak. We’re monitoring the situation until we can determine the appropriate designation for the spread of this…medical anomaly. We don’t need some journalist sowing panic before then.”
Jay, a full head taller than his superior, still managed to collapse in on himself under the heat of her side-eye. “I just think,” he stammered under his breath. “I mean, as the Public Health Advisor to the mayor’s office, I have some…concerns…”
“And as the Chief of Staff of the Office of the Mayor, I will let you know if, how, and when your concerns become the mayor’s concerns.” Ana graced him with a half turn of her face and a practiced, professional smile before turning back to the briefing.
“...like I’ve said repeatedly, we will let you know everything we know as we know it,” said Mayor Tan, hands held out in reassurance. “It’s still early days with this situation, and I know we’ve got plenty other things to cover in this briefing. How about one more before we move on to more pressing matters?”
“Mayor Tan,” began a reporter, “your team was still intimating that this was a hoax just last week. Why have you shifted that stance?”
He rested his palms on the podium and chuckled to himself. “I don’t think that’s the word we used, but our team believes in science, not pseudoscience, and we act on concrete data, not social media theories.” He shifted his posture, his fitted suit jacket bunching up over an eye catching posterior on the thirty-five year old politician. “As reliable data becomes available and new…developments occur, we shift our messaging and our strategies.”
Ana whispered along verbatim. She’d been guiding the mayor through his entire political career, knew him better than anyone else at this point. Working class beginnings, son of immigrants, got into a prestigious college, came back to the city to become a community organizer, got a Masters in Public Policy, won a City Council seat through a brilliant grassroots campaign–organized by her–and now sat in the Office of the Mayor. He was starting to get national attention, not just for his policies, but also his engaging demeanor, whip smart discursive abilities, and the toned, 6’0” frame on display during games of pickup soccer at his local community center. He was an eligible bachelor racking up social media views and a humble public servant who still took the bus to City Hall every morning. He was the kind of young, progressive leader that people needed to believe in right now, and both their sights were already set higher.
“I just,” Jay snapped her out of her reverie. “I just think we could be a little more proactive about this.” He showed her his phone, which displayed the latest statistics visualized by The Herald. Her eyes traced a line that had been lazily rolling up over the past several weeks, but was beginning to crook upward at a worrying angle.
“Look,” she sighed, pinching the bridge of her nose. “We’re taking this seriously, we’re all taking this seriously. But the last thing this city needs is panic over some…BBL virus.”
“That’s not–the official terminology is–”
“Male Gluteal Hyper–yeah yeah yeah, I know,” she said with a subtle, sharp wave of her hand. “I also got that memo. But there’s a lot at play here and a lot at stake. We’re about to get our signature public transport expansion through the council, we’re finalizing contract negotiations with the municipal workers’ union, we’ve almost got the affordable housing plan through the budgetary process. We haven’t even announced the gubernatorial campaign yet and the polls are already showing a tight race. I know you care deeply about this and you’re brilliant at what you do, but so am I. You have to trust me to play this carefully and play it right. Imagine what we could accomplish from the governor’s mansion, let’s not let this…absurd situation derail everything.”
“Yes…yes, ma’am,” said Jay. He refocused on the briefing, the mayor having taken off his jacket and rolled up his sleeves as he settled into his usual rapport with the press, shifting his hips back as he leaned over the podium. “But do we have a plan in place for…that?” He gestured slightly with his chin to the prodigious bubble butt straining the young mayor’s fitted slacks.
“For what,” replied Ana with a quirk of her lips. “The Mayor’s last physical was, as you know, just last month, and, as you know, he’s in excellent condition.”
“Yes,” said Jay carefully, “but that physical was several…pant sizes ago.” The mayor was famous for staying physically active and notably in great shape, but his glutes and hamstrings looked disproportionate compared to just a few weeks ago, crammed into a pair of slacks that had already been adjusted multiple times but still looked liable to burst at any second. “Has he been diagnosed yet?”
“Mm mm mm,” Ana playfully scolded, her attention still locked in to the mayor’s practiced responses. “We don’t use that word until we need to. Fluctuations that may or may not happen with the mayor’s weight are not public concern, his personal tailor signed a solid NDA, and besides…” she once again synced up with the mayor as he gave his parting thoughts and began to walk off stage, carefully controlling his gait to de-emphasize the overdeveloped cheeks switching back and forth behind him.
“The majority of cases are–”
- - - - -
II
“--mild! Mild. I know, I get it, you’ve said that plenty of times.” Devon held his phone at arm’s length out of frustration as the disembodied customer service voice continued to reassure him that there was little to worry about. “Look, I’ve been taking the over the counter meds for three days, and I’m not…” his voice lowered, “I’m not seeing any improvement.”
“We suggest you take those for a week at the onset of symptoms. You started noticing the gluteal swelling three days ago?”
“Closer to three…um…weeks…ago,” he muttered, resting his face in his palm. “I just didn’t know…didn’t think that…didn’t want to…”
“Ask about the clinic!” came his roommate’s voice from the next room.
“Right, the clinic! There’s a clinic, right? Do I need to get a referral?”
“Unfortunately,” responded the voice. “That’s for our more severe cases, and capacity is very limited.”
“Well this case feels pretty severe,” Devon hissed, exasperation entering his voice as he gripped his morning coffee. “I only have so many work from home days and I…” he breathed deep, “I’m ripping through all my office slacks. If I can even get them over my…my–”
“Yes, well that’s to be expected. There are some great online forums popping up for men with your condition. DIY sewing on the fly, retrofitting your car, fashion inspo, the best supportive accessories, office furniture tips…”
“I don’t think I need to–I just don’t think the…symptoms are weakening. Maybe there’s a stronger treatment?”
A drawn out pause on the other end, until finally a pensive breath out. “Okay. Let me see what I can do. Keep taking the medication and we’ll get back to you.”
Click.
Devon punched the air. He’d accomplished basically nothing but at least he had the illusion of some solution to the hefty buns ballooning behind him. He felt acutely the jiggle of his cheeks as he strolled into the living room, where his roommate, Leo, was reading emails while the local news played in the background.
“...we encourage folks to be careful, but currently there is no need to panic…”
“Since when are they livestreaming the mayor’s press briefings?” asked Devon.
“Since that.” Leo pointed toward the corner of the screen, which featured The Herald’s graph of new cases, ending with that worrying upward curve.
Devon sighed, rested his hands on his oversized glutes. He gave them a squeeze, sending a shiver of pleasure up his spine. “Then I guess it’s fitting I’m working from home again.” He rolled his eyes.
“Yeah dude, I assumed based on what’s not fitting,” said Leo, holding up the tattered remains of Devon’s pants, strewn angrily to the floor. “Did you get into the clinic?”
“Ugh, no. Maybe? I don’t know. Probably not.” Devon, clad only in striped bikini briefs and a button down, flopped onto the couch harder than expected. “They mostly gave me tips about…retrofitting my car?”
“Oh, I have a cousin that could help with that. He caught it last month right at the beginning of some trip with his friends, then everybody caught it, and they couldn’t find the meds at a pharmacy anywhere until they got back. They almost got in trouble for public indecency on the flight back because none of their pants…you know…anyway, he like, got a more spacious setup installed in his car. It looks pretty sweet.”
Devon groaned.
“But you won’t have to do that!” Leo rubbed his roommate’s shoulder and gave him a reassuring squeeze. “I mean, he looked like he was smuggling beach balls last I saw him. You’ll be fine, you’re nowhere near that stage.”
“Not yet,” Devon sighed. Three weeks, he scolded himself. After his pancake butt suddenly started putting on mass after years of working out, those first several days were great. He was riding the high of attention and compliments as his perky bubble butt steadily inflated into a donk. After a week, Leo was the first to suggest that maybe it wasn’t just the new leg day routine causing him to fill out his pants so well. Devon demurred, enjoying his fat ass so much that he didn’t notice the attention begin to shift, the stares taking on a different tone, comments becoming mixed with concern, mockery, lust. By the time he was staring down at a positive test, the melons stretching his briefs to the limit were evidence enough. The hemispheres of his backside were now comical, quickly approaching colossal, and nothing seemed to be slowing them down. If that wasn’t severe enough, what was?
Extricating himself from the couch was becoming an ordeal because of the constant shift of his center of gravity. His cheeks bounced wildly as he shuffled to his room, peeling off the bikini briefs with relief so he could slip into a more comfortable pair of extra spacious harem pants. Before he could open the drawer, his eyes locked on to the ten inch teal tower of floppy silicone cock on top of the dresser.
His back arched in anticipation, hole twitching with need as he fell onto the bed, the globes of his ass jiggling out of control and sending waves of pleasure. Of all his symptoms, the increased sensitivity had hit almost as hard as his skyrocketing libido, leading to a newfound enthusiasm for all manner of large and unique toys. Silver linings, I guess, he said to himself with a wry smile, reaching for the lube.
As he lost himself in a pool of morning pleasure, which, he had to admit, was becoming a more than daily thing, his phone sat abandoned on the kitchen counter. Occluded by his muffled moans face down in his pillow, he couldn’t hear it ring.
- - - - -
III
“Hello Devon, this is Randi–with an i–at Phantasy Labs. I’m following up from your call. We may have an option for cases like yours. One of our satellite clinics opening up is specializing in severe infections that aren’t responding to the over the counter meds. Give me a call when you get a chance!”
Randi tapped her left earbud, ending the call, and–with her most adept customer service face–turned her attention to the man anxiously tapping his fingers along the edge of the reception desk.
“Our favorite reporter, back again,” she beamed. “How can we help The Herald, today?”
“Sorry I’m late,” he said. “The mayor had an impromptu press briefing this morning, I had to run across town. I was supposed to meet with someone from Epidemiology about the latest numbers?”
“As you can imagine, the Epi labs are swamped, but I’ll see if I can get you in.”
“Seems to always be the case,” he sighed. “Would it be possible to talk to someone about your data transparency? Research into the virus is publicly funded, if I’m not mistaken.”
“And we are just so grateful to have the support, trust, and financial partnership of the municipal government to tackle the spread. How about I redirect you to our IP specialists in Legal–”
“No, no, that’s fine!” he exclaimed. “Not again.” For months he’d been a fixture at that reception desk, with limited success in getting through to anyone actually working on epidemiological research or vaccine development. But the legal team was a rabbit hole he didn’t want to go back down.
Randi perked up as the earbud in her left ear pulsed with a lavender and green glow.
“It’s the Office of the Mayor,” she said, holding a finger lightly to the device nestled in her ear. “Official business, you understand.”
“Right. Well, if I could just–”
“I’m really sorry,” she cut him off with the gentlest wave of her hand. “Just give me a few moments. Go ahead and have a seat in the lounge. They just restocked.” She turned away and redirected her attention to the screen built into her side of the desk, tapping lightly as she whispered into the air.
Neil was familiar with every option of coffee, tea, and snacks that Phantasy Labs had to offer, having spent many mornings relegated to the waiting area, acutely aware that he would not be making it past the front desk. They're always changing this place around, he thought, wandering through the curvilinear architecture of the main lobby space. The undulating walls and bulbous pillars always looked strangely organic, as if the space was shifting its shape and growing new structures according to its own logic. It had never looked the same from one week to the next, but he had always managed to find the low seamless coffee table surrounded by oddly plush cushions made of a material he still could not figure out.
This morning, however, it was nowhere to be found. In the spot where he felt it should be, he saw only a sheet of paper, placed flat on the floor, with an arrow drawn in permanent marker. The hair stood up on the back of his neck. He had never seen any sort of analog technology used in this place, let alone pen and paper. Nor had he ever had any encounter here that felt outside the realm of a fully coherent, seamless, organic efficiency. Maybe he was finally getting somewhere.
He looked up to find that the arrow pointed to a smooth, blank wall. As he walked up to investigate, a barely perceptible seam appeared at the height of an average door frame, and the wall unfurled further and further with his proximity. He stepped through, finding himself in the middle of a hallway, the door silently shutting behind him.
“Well, shit,” he muttered, unable to reopen the portal he just stepped through, or even detect the seam itself. Instead of the glowing dots he was used to leading him along, he saw the same nondescript pieces of paper with carefully drawn arrows, leading him deeper into the maze of the massive facility. “Okay Neil. You’re a journalist, this is what journalists do,” he told himself. He followed the trail of breadcrumbs to–to his relief–an actual door with a real handle, with the word “UTILITY” printed at the top.
He entered to find row after row of closely packed floor to ceiling shelving, full of what looked like all manner of lab equipment, supplies, and meticulously labeled containers. He wandered in, looking for another arrow, eventually beginning to worry as he came to the conclusion that he had gone on this quest for nothing and simply meandered into a supply closet in the middle of a labyrinthine research complex that he may never escape from.
“Hi.” The quiet voice behind him caused Neil to jump, bumping into a drawer of measuring tape.
Between him and the door was a mousy man holding several sheets of paper, featuring the arrows that had led him here.
“Oh, sorry!” His face a contortion of apology. “Communication is really tight here, I had to find a way to get your attention. I’m Sai,” he added with a helpful smile. He looked like he generally spent most of his waking time in a lab, but the disheveled hair, unkempt stubble, and dark circles under his eyes told Neil he hadn’t gotten much sleep recently, let alone made it home.
From the waist up, he looked petite enough to shove out of the way in a pinch, but Neil’s gaze immediately fell to the pair of globes hovering behind him, stretching his plaid leggings to the limit, rotund enough to see from the front. His svelte waist ballooned into a pair of gargantuan ass cheeks and thick thighs, so comically hefty they effectively blocked any hope of escape. “You don’t know me. I’m just one of the R&D interns. But some of us have been following your work with the, uh, virus, and…could we, um, talk?”
“Yeah,” said Neil, unable to take his eyes off of Sai’s wildly disproportionate posterior. “Yeah, definitely.” He pulled out his voice recorder from his messenger bag. “I have so many questions.”
#the people have been yearning for more local politics in their smut writing#male tf#ass expansion#MOCAM
25 notes
·
View notes
Note
can you elaborate on michael hoerger? I don’t know much about him other than that he runs that covid forecasting thing
i hate his ass because he is one of the loudest voices in the "maximum alarmism is a moral imperative" camp, and you can see this even in the design of his forecasting: tracking spread without any mention of actual clinical outcomes besides the most terrifying possible estimate of long covid incidence---a calculation that rests on very shaky grounds because long covid is poorly, loosely, and variably defined in the existing literature, meaning estimates of both incidence and prevalence vary to an extreme extent. not to mention even the fact that the whole dashboard relies on wastewater counts without dealing with a basic difficulty: extrapolating backwards from these data to estimate an actual number of infected people is inexact and can mask variables like population vaccine uptake or variant's propensity to replicate in the GI tract. but see, talking about any of these things would be contrary to his fundamental position that public health communication is about terrifying people into cautious behaviour, and more terror = a better job done. a scarier number is de facto an ethical good, you see.
i do not think it is a coincidence that hoerger is a psychologist by training, whose work prior to the pandemic focussed on "how personality and emotion science can be applied to enhance decision-making in high-stakes contexts, such as healthcare". this goes to what i've said before about narrativising public health as a matter of public opinion: we don't need to talk about things like the state's motivation to make lines go up, no, what we truly need is random psychological guesswork as to the individual mental 'defence mechanisms' that are ostensibly preventing the unenlightened masses from perceiving the truth (knowledge is not gatekept and communication is seamless, in hoergerland). not to mention every third tweet i see reposted from him is like, the most i-told-them-so lip-pursing cassandra routine, which, aside from being irritating, is just an extremely poor way to convince anyone to do anything and likely just alienates more people from the actually important point that covid is endangering all of us and there are things we should be doing to mitigate this.
54 notes
·
View notes
Text
Empowering Data Insights: Build a Real-Time Data Dashboard with PolusAI
PolusAI, developed by NewFangled, stands at the forefront of a transformative wave in Data Analytics. This Generative AI-driven No-Code platform democratizes access to data insights, eliminating the barriers posed by traditional tools' steep learning curves. Offering seamless integration with various data sources, PolusAI's advanced machine-learning algorithms automate analysis, pattern identification, and real-time dashboard creation. Its intuitive drag-and-drop interface facilitates easy dashboard building, while customizable alerts ensure prompt responses to significant changes. With accessibility, speed, cost-effectiveness, and adaptability as its hallmarks, PolusAI is revolutionizing data analysis, enabling both technical and non-technical users to harness the power of real-time analytics effortlessly. As the landscape of Data Analytics evolves, platforms like PolusAI pave the way for a future where data-driven insights are accessible to all.
#newfangled#polusai#data democratization#big data#business data#ai to generate dashboard#etl#business dashboard#nlp#bi report#generativeai#generativebi#nocode#nocodedataanalytics#data visualization#data analytics#datascience#data science#data management#data analysis
1 note
·
View note
Text
Aaron Siri, Esq. is a vaccine and civil rights attorney and the Managing Partner of the law firm Siri & Glimstad who have offices across the USA. Aaron earned his law degree at the University of California, Berkeley School of Law where he received four Prosser Prizes and ten High Honors – REF
Following a screening of the movie Vaxxed in 2016, Aaron insisted on meeting personally with Del Bigtree to discuss working together. Del’s non-profit the Informed Consent Action Network (ICAN) an activist, litigious and fundraising organisation instructs Siri & Glimstad to, amongst other things, submit Freedom of Information Act (FOIA) requests to government health agencies such as the FDA, CDC, HHS & NIH to seek the evidence to prove claims made by these “trusted” government bodies regarding vaccine safety and policy.
As of December 2022 Siri & Glimstad had over 20 individuals in the law firm that exculsively work on vaccine related matters.
In case you are not aware, vaccine manufactures are the only product developer who can’t be sue for damages caused by their products, and there is no trial process to access discovery. All liability and accountability rests with the government, the very entity that promotes the products and ensures they are “safe and effective”!
Suing the government for evidence
Since 2018 Siri & Glimstad, on ICAN’s behalf, have been submitting FOIA requests to US government agencies, they too often do not comply, so Aaron and his team then sues the government in order to obtain the public record documents sort. When ICAN win’s lawsuits, this means the court has ruled that the government agency has to turn over the FOIA documents/data requested. Too often this process reveals that the govenment agency has no evidence to support their public claims, or appear to be hiding evidence of harm.
“A search of our records failed to reveal any documents pertaining to your request” is too often the reply following court action such as HERE, HERE, HERE, HERE, HERE, HERE etc.
The FOIA process can take up to 3 years or more – seemingly delay-tactics by the government who clearly knows they don’t have the evidence to back up their bold claims! The public trust that these health agencies are doing their job to protect the public, and have the evidence to back their claims. ICAN via Siri & Glimstad are revealing, time and time again, that public health make claims on “hope” not science based data.
During the COVID-19 pandemic Aaron and his team have lead many lawsuits pertaining to COVID-19 vaccine mandates, seeking Pfizer documents from the FDA, and following up on all things deemed “misinformation” and more. The work continues today – building an “informed choice” public record.
“Vaccine” depositions
Aaron knew next to nothing about immunology and vaccines when he started out, but through devours text books he gained a basic understanding for when he deposes long-standing vaccine experts like Dr Stanley Plotkin (2018) and Dr Katherine Edwards (2022). Depositions that YouTube deleted!
This page contains interviews and articles that provide little-known insight into the litigious aspects of vaccines in the US (which affects the entire world) – insights that the medical community have not been aware of…but the COVID response is waking people up to the public-private vaccine industry house-of-cards!
Aaron Siri Official links:
Substack – Injecting Freedom – HERE, INTRO
Twitter – HERE
ICAN decide website – HERE
FOIA Filter search – HERE
Pfizer Documents – HERE
V-Safe Dashboard & Data files – HERE
On this website relates to Aaron Siri’s work:
ICAN major lawsuit wins – HERE
Revelations from the Pfizer Document FOIA win – HERE
6 notes
·
View notes
Text
Collaborative effort supports an MIT resilient to the impacts of extreme heat
New Post has been published on https://thedigitalinsider.com/collaborative-effort-supports-an-mit-resilient-to-the-impacts-of-extreme-heat/
Collaborative effort supports an MIT resilient to the impacts of extreme heat

Warmer weather can be a welcome change for many across the MIT community. But as climate impacts intensify, warm days are often becoming hot days with increased severity and frequency. Already this summer, heat waves in June and July brought daily highs of over 90 degrees Fahrenheit. According to the Resilient Cambridge report published in 2021, from the 1970s to 2000, data from the Boston Logan International Airport weather station reported an average of 10 days of 90-plus temperatures each year. Now, simulations are predicting that, in the current time frame of 2015-44, the number of days above 90 F could be triple the 1970-2000 average.
While the increasing heat is all but certain, how institutions like MIT will be affected and how they respond continues to evolve. “We know what the science is showing, but how will this heat impact the ability of MIT to fulfill its mission and support its community?” asks Brian Goldberg, assistant director of the MIT Office of Sustainability. “What will be the real feel of these temperatures on campus?” These questions and more are guiding staff, researchers, faculty, and students working collaboratively to understand these impacts to MIT and inform decisions and action plans in response.
This work is part of developing MIT’s forthcoming Climate Resiliency and Adaptation Roadmap, which is called for in MIT’s climate action plan, and is co-led by Goldberg; Laura Tenny, senior campus planner; and William Colehower, senior advisor to the vice president for campus services and stewardship. This effort is also supported by researchers in the departments of Urban Studies and Planning, Architecture, and Electrical Engineering and Computer Science (EECS), in the Urban Risk Lab and the Senseable City Lab, as well as by staff in MIT Emergency Management and Housing and Residential Services. The roadmap — which builds upon years of resiliency planning and research at MIT — will include an assessment of current and future conditions on campus as well as strategies and proposed interventions to support MIT’s community and campus in the face of increasing climate impacts.
A key piece of the resiliency puzzle
When the City of Cambridge released their Climate Change Vulnerability Assessment in 2015, the report identified flooding and heat as primary resiliency risks to the city. In response, Institute staff worked together with the city to create a full picture of potential flood risks to both Cambridge and the campus, with the latter becoming the MIT Climate Resiliency Dashboard. The dashboard, published in the MIT Sustainability DataPool, has played an important role in campus planning and resiliency efforts since its debut in 2021, but heat has been a missing piece of the tool. This is largely because for heat, unlike flooding, few data exist relative to building-level impacts. The original assessment from Cambridge showed a model of temperature averages that could be expected in portions of the city, but understanding the measured heat impacts down to the building level is essential because impacts of heat can vary so greatly. “Heat also doesn’t conform to topography like flooding, making it harder to map it with localized specificity,” notes Tenny. “Microclimates, humidity levels, shade or sun aspect, and other factors contribute to heat risk.”
Collection efforts have been underway for the past three years to fill in this gap in baseline data. Members of the Climate and Resiliency Adaptation Roadmap team and partners have helped build and place heat sensors to record and analyze data. The current heat sensors, which are shoebox-shaped devices on tripods, can be found at multiple outdoor locations on campus during the summer, capturing and recording temperatures multiple times each hour. “Urban environmental phenomena are hyperlocal. While National Weather Service readouts at locations like Logan Airport are extremely valuable, this gives us a more high-resolution understanding of the urban microclimate on our campus,” notes Sanjana Paul, past technical associate with Senseable City and current graduate student in the Department of Urban Studies and Planning who helps oversee data collection and analysis.
After collection, temperature data are analyzed and mapped. The data will soon be published in the updated Climate Resiliency Dashboard and will help inform actions through the Climate Resiliency and Adaptation Roadmap, but in the meantime, the information has already provided some important insights. “There were some parts of campus that were much hotter than I expected,” explains Paul. “Some of the temperature readings across campus were regularly going over 100 degrees during heat waves. It’s a bit surprising to see three digits on a temperature reading in Cambridge.” Some strategies are also already being put into action, including planting more trees to support the urban campus forest and launching cooling locations around campus to open during days of extreme heat.
As data gathering enters its fourth summer, partners continue to expand. Senseable City first began capturing data in 2021 using sensors placed on MIT Recycling trucks, and the Urban Risk Lab has offered community-centered temperature data collection with the help of its director and associate professor of architecture, Miho Mazereeuw. More recently, students in course 6.900 (Engineering for Impact) worked to design heat sensors to aid in the data collection and grow the fleet of sensors on campus. Co-instructed by EECS senior lecturer Joe Steinmeyer and EECS professor Joel Voldman, students in the course were tasked with developing technology to solve challenges close at hand. “One of the goals of the class is to tackle real-world problems so students emerge with confidence as an engineer,” explains Voldman. “Having them work on a challenge that is outside their comfort zone and impacts them really helps to engage and inspire them.”
Centering on people
While the temperature data offer one piece of the resiliency planning puzzle, knowing how these temperatures will affect community members is another. “When we look at impacts to our campus from heat, people are the focus,” explains Goldberg. “While stress on campus infrastructure is one factor we are evaluating, our primary focus is the vulnerability of people to extreme heat.” Impacts to community members can range from disrupted nights of sleep to heat-related illnesses.
As the team looked at the data and spoke with individuals across campus, it became clear that some community members might be more vulnerable than others to the impact of extreme heat days, including ground, janitorial, and maintenance crews who work outside; kitchen staff who work close to hot equipment; and student athletes exerting themselves on hot days. “We know that people on our campus are already experiencing these extreme heat days differently,” explains Susy Jones, senior sustainability project manager in the Office of Sustainability who focuses on environmental and climate justice. “We need to design strategies and augment existing interventions with equity in mind, ensuring everyone on campus can fulfill their role at MIT.”
To support those strategy decisions, the resiliency team is seeking additional input from the MIT community. One hoped-for outcome of the roadmap and dashboard is for community members to review them and offer their own insight and experiences of heat conditions on campus. “These plans need to work at the campus level and the individual,” says Goldberg. “The data tells an important story, but individuals help us complete the picture.”
A model for others
As the dashboard update nears completion and the broader resiliency and adaptation roadmap of strategies launches, their purpose is twofold: help MIT develop and inform plans and procedures for mitigating and addressing heat on campus, and serve as a model for other universities and communities grappling with the same challenges. “This approach is the center of how we operate at MIT,” explains Director of Sustainability Julie Newman. “We seek to identify solutions for our own campus in a manner that others can learn from and potentially adapt for their own resiliency and climate planning purposes. We’re also looking to align with efforts at the city and state level.” By publishing the roadmap broadly, universities and municipalities can apply lessons and processes to their own spaces.
When the updated Climate Resiliency Dashboard and Climate Resiliency and Adaptation Roadmap go live, it will mark the beginning of the next phase of work, rather than an end. “The dashboard is designed to present these impacts in a way everyone can understand so people across campus can respond and help us understand what is needed for them to continue to fulfill their role at MIT,” says Goldberg. Uncertainty plays a big role in resiliency planning, and the dashboard will reflect that. “This work is not something you ever say is done,” says Goldberg. “As information and data evolves, so does our work.”
#Airport#Analysis#approach#architecture#assessment#Building#Cambridge#Boston and region#Campus buildings and architecture#Campus services#centering#challenge#change#climate#climate change#Collaboration#collaborative#Community#computer#Computer Science#cooling#course#dashboard#data#data collection#Design#devices#Electrical Engineering&Computer Science (eecs)#Engineer#engineering
0 notes
Text
Python for Beginners: Launch Your Tech Career with Coding Skills
Are you ready to launch your tech career but don’t know where to start? Learning Python is one of the best ways to break into the world of technology—even if you have zero coding experience.
In this guide, we’ll explore how Python for beginners can be your gateway to a rewarding career in software development, data science, automation, and more.
Why Python Is the Perfect Language for Beginners
Python has become the go-to programming language for beginners and professionals alike—and for good reason:
Simple syntax: Python reads like plain English, making it easy to learn.
High demand: Industries spanning the spectrum are actively seeking Python developers to fuel their technological advancements.
Versatile applications: Python's versatility shines as it powers everything from crafting websites to driving artificial intelligence and dissecting data.
Whether you want to become a software developer, data analyst, or AI engineer, Python lays the foundation.
What Can You Do With Python?
Python is not just a beginner language—it’s a career-building tool. Here are just a few career paths where Python is essential:
Web Development: Frameworks like Django and Flask make it easy to build powerful web applications. You can even enroll in a Python Course in Kochi to gain hands-on experience with real-world web projects.
Data Science & Analytics: For professionals tackling data analysis and visualization, the Python ecosystem, featuring powerhouses like Pandas, NumPy, and Matplotlib, sets the benchmark.
Machine Learning & AI: Spearheading advancements in artificial intelligence development, Python boasts powerful tools such as TensorFlow and scikit-learn.
Automation & Scripting: Simple yet effective Python scripts offer a pathway to amplified efficiency by automating routine workflows.
Cybersecurity & Networking: The application of Python is expanding into crucial domains such as ethical hacking, penetration testing, and the automation of network processes.
How to Get Started with Python
Starting your Python journey doesn't require a computer science degree. Success hinges on a focused commitment combined with a thoughtfully structured educational approach.
Step 1: Install Python
Download and install Python from python.org. It's free and available for all platforms.
Step 2: Choose an IDE
Use beginner-friendly tools like Thonny, PyCharm, or VS Code to write your code.
Step 3: Learn the Basics
Focus on:
Variables and data types
Conditional statements
Loops
Functions
Lists and dictionaries
If you prefer guided learning, a reputable Python Institute in Kochi can offer structured programs and mentorship to help you grasp core concepts efficiently.
Step 4: Build Projects
Learning by doing is key. Start small:
Build a calculator
Automate file organization
Create a to-do list app
As your skills grow, you can tackle more complex projects like data dashboards or web apps.
How Python Skills Can Boost Your Career
Adding Python to your resume instantly opens up new opportunities. Here's how it helps:
Higher employability: Python is one of the top 3 most in-demand programming languages.
Better salaries: Python developers earn competitive salaries across the globe.
Remote job opportunities: Many Python-related jobs are available remotely, offering flexibility.
Even if you're not aiming to be a full-time developer, Python skills can enhance careers in marketing, finance, research, and product management.
If you're serious about starting a career in tech, learning Python is the smartest first step you can take. It’s beginner-friendly, powerful, and widely used across industries.
Whether you're a student, job switcher, or just curious about programming, Python for beginners can unlock countless career opportunities. Invest time in learning today—and start building the future you want in tech.
Globally recognized as a premier educational hub, DataMites Institute delivers in-depth training programs across the pivotal fields of data science, artificial intelligence, and machine learning. They provide expert-led courses designed for both beginners and professionals aiming to boost their careers.
Python Modules Explained - Different Types and Functions - Python Tutorial
youtube
#python course#python training#python#learnpython#pythoncourseinindia#pythoncourseinkochi#pythoninstitute#python for data science#Youtube
2 notes
·
View notes
Text
How to Become a Data Scientist in 2025 (Roadmap for Absolute Beginners)

Want to become a data scientist in 2025 but don’t know where to start? You’re not alone. With job roles, tech stacks, and buzzwords changing rapidly, it’s easy to feel lost.
But here’s the good news: you don’t need a PhD or years of coding experience to get started. You just need the right roadmap.
Let’s break down the beginner-friendly path to becoming a data scientist in 2025.
✈️ Step 1: Get Comfortable with Python
Python is the most beginner-friendly programming language in data science.
What to learn:
Variables, loops, functions
Libraries like NumPy, Pandas, and Matplotlib
Why: It’s the backbone of everything you’ll do in data analysis and machine learning.
🔢 Step 2: Learn Basic Math & Stats
You don’t need to be a math genius. But you do need to understand:
Descriptive statistics
Probability
Linear algebra basics
Hypothesis testing
These concepts help you interpret data and build reliable models.
📊 Step 3: Master Data Handling
You’ll spend 70% of your time cleaning and preparing data.
Skills to focus on:
Working with CSV/Excel files
Cleaning missing data
Data transformation with Pandas
Visualizing data with Seaborn/Matplotlib
This is the “real work” most data scientists do daily.
🧬 Step 4: Learn Machine Learning (ML)
Once you’re solid with data handling, dive into ML.
Start with:
Supervised learning (Linear Regression, Decision Trees, KNN)
Unsupervised learning (Clustering)
Model evaluation metrics (accuracy, recall, precision)
Toolkits: Scikit-learn, XGBoost
🚀 Step 5: Work on Real Projects
Projects are what make your resume pop.
Try solving:
Customer churn
Sales forecasting
Sentiment analysis
Fraud detection
Pro tip: Document everything on GitHub and write blogs about your process.
✏️ Step 6: Learn SQL and Databases
Data lives in databases. Knowing how to query it with SQL is a must-have skill.
Focus on:
SELECT, JOIN, GROUP BY
Creating and updating tables
Writing nested queries
🌍 Step 7: Understand the Business Side
Data science isn’t just tech. You need to translate insights into decisions.
Learn to:
Tell stories with data (data storytelling)
Build dashboards with tools like Power BI or Tableau
Align your analysis with business goals
🎥 Want a Structured Way to Learn All This?
Instead of guessing what to learn next, check out Intellipaat’s full Data Science course on YouTube. It covers Python, ML, real projects, and everything you need to build job-ready skills.
https://www.youtube.com/watch?v=rxNDw68XcE4
🔄 Final Thoughts
Becoming a data scientist in 2025 is 100% possible — even for beginners. All you need is consistency, a good learning path, and a little curiosity.
Start simple. Build as you go. And let your projects speak louder than your resume.
Drop a comment if you’re starting your journey. And don’t forget to check out the free Intellipaat course to speed up your progress!
2 notes
·
View notes
Text
Is AT8XM Robot Legit Or Not? - AT8XM Robot PayPal Review

Explore the AT8XM Robot Paypal Review to uncover how this AI-driven forex trading system operates, its PayPal integration, and why it could be a game-changer for both new and seasoned traders.
The AT8XM Robot Paypal system combines artificial intelligence with PayPal integration to simplify forex trading. Learn how it works, who it’s for, and what makes it an appealing choice for automated traders.
Introduction
Let’s face it—forex trading can be a tricky beast. With markets shifting in the blink of an eye and economic news constantly rolling in, it’s tough to stay ahead of the curve. That’s where the AT8XM Robot Paypal steps into the spotlight. This AI-powered forex trading tool doesn’t just promise ease of use and smart trading; it also connects with PayPal, making transactions smooth as silk.
So, whether you're green around the gills or a trading veteran, this review will walk you through what makes the AT8XM Robot Paypal stand out in the world of automated forex systems.
What Is AT8XM Robot Paypal?
The AT8XM Robot Paypal is an automated forex trading application that leverages AI to scan markets, spot trading opportunities, and execute trades without needing constant human input. As if that wasn’t enough, it’s designed to be compatible with PayPal, adding a trusted layer of convenience for users handling deposits and withdrawals.
Top Features at a Glance
Smart AI Trading Engine
24/7 Market Monitoring
PayPal Payment Integration
User-Friendly Dashboard
Beginner-Friendly Setup
Real-Time Data Analysis
Customizable Risk Settings
This robot doesn’t sleep, doesn’t hesitate, and doesn’t complain—it just keeps scanning the forex market, aiming for profitable trades while the user can sit back and relax.
How AT8XM Robot Paypal Works
It might sound like rocket science, but the logic behind the AT8XM Robot Paypal is fairly straightforward:
Setup & Connect Broker – Users first create an account and connect it with a recommended broker.
Link PayPal – Funds can be deposited or withdrawn using PayPal, adding a layer of convenience.
Activate Robot – Once active, the robot starts scanning market conditions in real-time.
Trade Execution – Based on algorithmic decisions, it places trades aimed at maximizing profit.
Profit Monitoring – All gains go straight into the broker account, accessible via PayPal.
Pretty neat, huh? With minimal effort, users get a full-fledged trading partner running in the background.
Why Traders Are Buzzing About AT8XM Robot Paypal
There’s no shortage of reasons why this trading tool is gaining popularity:
Saves Time – No need to analyze charts all day.
Emotion-Free Trading – Decisions are driven by data, not by human impulse.
Trusted Payments – PayPal support adds an extra layer of user trust.
Ease of Use – Setup takes minutes, not hours.
Flexible Trading Options – Users can set their own trading limits and preferences.
Low Barrier to Entry – No prior trading knowledge required.
Who Stands to Benefit from AT8XM Robot Paypal?
The short answer? Just about anyone looking to dip their toes into the forex market or take their trading to the next level.
Complete Beginners – It’s plug-and-play simplicity helps new traders ease in.
Busy Professionals – They can let the bot do the legwork while they focus on other things.
Cautious Investors – The customizable risk settings are ideal for those who like to play it safe.
Experienced Traders – Automation lets them scale their strategies without burning out...
Is AT8XM Robot Legit Or Not? Full AT8XM Robot PayPal Review here! at https://scamorno.com/Robot-AT8XM-Review-App/?id=tumblr-legitornotpaypal
Security & Reliability: Is It the Real Deal?
Ah, the million-dollar question. The AT8XM Robot Paypal is reportedly backed by strong encryption and secure broker partnerships. And when PayPal’s in the mix, users often feel a bit more at ease, knowing that their transactions are protected by one of the most trusted online payment platforms out there.
Still, no system is perfect. As always, users should stick with well-reviewed brokers and do a touch of homework before diving in headfirst.
FAQs About AT8XM Robot Paypal
1. Is AT8XM Robot Paypal compatible with any broker?
Not quite. It usually works best with specific recommended brokers that support its integration and features.
2. Do I need trading experience to use it?
Nope! The platform is beginner-friendly, offering automated decisions without requiring deep knowledge of the forex market.
3. How does PayPal come into play?
Users can link their PayPal accounts for depositing and withdrawing funds, which adds a safe and well-known payment method into the mix.
4. Are the profits guaranteed?
Well, let’s not count chickens before they hatch. Like all trading, there’s risk involved. However, the robot is designed to increase the odds in the user’s favor.
5. Can I adjust the robot’s settings?
Absolutely! Users can customize risk levels, stop-loss limits, and trade sizes according to their comfort level...
Is AT8XM Robot Legit Or Not? Full AT8XM Robot PayPal Review here! at https://scamorno.com/Robot-AT8XM-Review-App/?id=tumblr-legitornotpaypal
2 notes
·
View notes