#data science life cycle model
Text
Stages of the Data Science Lifecycle: From Idea to Deployment
In this short video, we'll discuss the stages of the data science lifecycle, from idea to deployment. We'll cover the different stages of a data science project, from data collection to data analysis and finally, the presentation of the results.
If you're new to data science or you're looking for a better understanding of the life cycle of a data science project, then this video is for you!
By the end of this short video, you'll have a clearer understanding of the stages of the data science lifecycle, and you'll be able to move from idea to deployment with ease!
#data science life cycle#data science life cycle phases#data science project life cycle#complete life cycle of a data science project#data science project#data science project step by step#data science project management#data science#data science tutorial#data science for beginners#data science project from scratch#learn data science#simplilearn data science#machine learning#data science life cycle model#overview of data science life cycle
0 notes
Text
The Gargantuan Fossil
This post was from the beginning of my project, thus some information I’ve written here is outdated. Please read my recent posts to see up to date information.
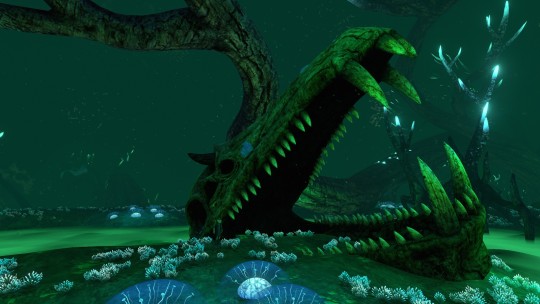
The Gargantuan Fossil is one of the most recognizable parts of the mid-portion of Subnautica’s gameplay. Its sheer size strikes both terror and awe into the hearts of players who stumble upon it. It’s unfortunate that only a third of the creature’s fossilized remains can be seen. Even using the Freecam command to check under the map reveals that the rest of the skeleton remains unmodeled. This is all we have of the Leviathan.

“Gargantuan Fossil” is quite the accurate name, considering just a third of this creature’s skeleton measures 402 meters in length, with the creature’s total size being an estimated 1,100-1,500 meters. Just the skull itself is under 100 meters, and our human player character can nestle comfortably in even its smallest eye socket. I would’ve tried to show our human character’s model for a size comparison, but this thing is so large you wouldn’t even be able to see him.
There have been many different reconstructions of this behemoth of a fossil, the most popular being this commission piece made by Tapwing, for the YouTuber Anthomnia, shown below. And while it’s cool, it’s... not all that accurate.

In the past, I actually helped create a Gargantuan Leviathan mod based off Tapwing’s concept, working alongside other incredibly talented artists (who will remain anonymous, they can talk about their experiences as they please) and some... not so savory individuals. I don’t want to be associated with that old Garg. This reconstruction project is both a way for me to move on and make something better than what I had in the past, and to test my skills and knowledge in the various natural sciences.
Although there is a second specimen, the skull of a younger instance, this fossil holds no significant data outside of showing just how small these creatures start out as. As shown in the image below, despite being a much younger instance, our player character could still fit inside the Leviathan’s smallest eye socket, although it wouldn’t be as spacious as its adult counterpart.
The game’s PDA (Personal Data Assistant) states that the Gargantuan Fossil is approximately 3 million years old, which is INCREDIBLY RECENT. For reference, 3 million years ago we still shared the planet with multiple other hominid species like Australopithecus afarensis back in the mid Pliocene. The Subnautica we know today is a byproduct of a mass-extinction of megafauna, such as Leviathans. My guess as to how the Gargantuan got this big is a combination of deep-sea gigantism and an evolutionary arms race against the other megafauna alive during its time, with prey attempting to become larger than its predator to avoid predation, and the predator growing to continue this cycle. When this ancient ecosystem of leviathan-class super predators collapsed, likely because of the meteor that struck Planet 4546B, the Gargantuan Leviathan was out of a substantial food source and went extinct.
It could be possible that these creatures even gave live birth due to their serpentine body and massive size, making them too large for life in the shallows, where laying eggs is easiest.
NOW. LET’S TALK ABOUT THE BONES!! It’s important to figure out if the Gargantuan Leviathan had a cartilaginous skeleton or a bony one, so let’s count the bones!!

There’s TWO WHOLE BONES!!! AND IF YOU LOOK NEXT TO IT!! THOSE RIBS ARE BONES TOO!!!! UWAA!!! SO MANY BONES!!!! How can we tell this is bones? It’s simple!
Cartilage is rubbery and flexible, so it doesn't fossilize well, while bone is hard and rigid, perfect fossil material!! Cartilaginous skulls also tend to be made up of many little interlocking bones, with bony skulls being made up of only a small handful!

Another thing I found interesting about the Gargantuan Skull is that it seems to have a ball and socket joint? This could have just been a similar mishap to the top and bottom jaws being fused in the skull’s model, but I’m trying to keep things as close to the original anatomy as possible. The ball and socket joint probably evolved to help with the burden of such a massive and heavy skull and allowing for greater speed and range of motion. In a world full of Leviathan-class predators, being able to have a wide range of motion would be extremely beneficial in locating both potential predators and prey.
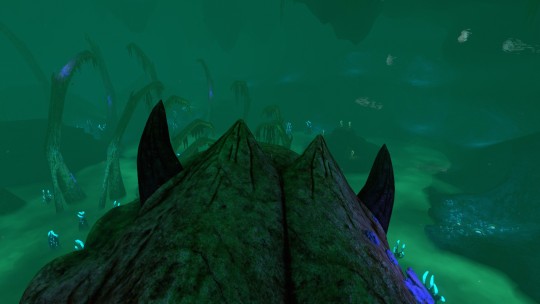
Despite its immense size pushing the claim this Leviathan was an apex predator, it sports a small pair of horns, which is unheard of in large apex predators here on Earth. The darker coloration leads me to believe that these aren’t just horn cores, but the entire horn. These horns were most likely used to assist in defending itself against predators while it’s still small and vulnerable. It could also be a possibility they were used for threat displays and territory fights though it seems unlikely due to their small size. Sexual displays are also unlikely since just about every creature in Subnautica seems capable of asexual reproduction, as noted in the PDA entry for eggs. Asexual reproduction seems to be a very ancient basal trait in Planet 4546B’s evolutionary lineage and was most likely evolved to help species persevere even with low numbers and harsh conditions, preventing the dangers of inbreeding.
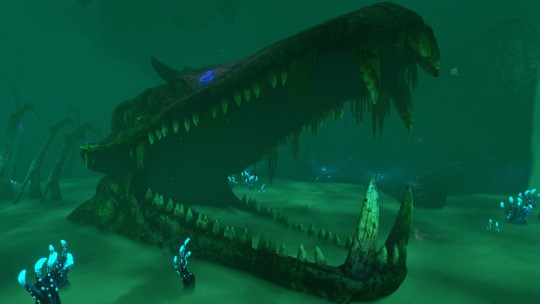
Overall, the skull’s shape and tooth structure suggest a piscivorous diet (of course it eats fish, the planet’s 99% water), and its shape specifically is reminiscent of an Orca and Redondasaurus.
The lack of nostrils stumps me, there’s no openings in the skull aside from its eye sockets, however there’s also no evidence for a gill apparatus. I’m... going to have to come back to that at a later date. Though I personally believe the Gargantuan Leviathan was an air breather due to the lack of evidence for gills.
OKOK, ENOUGH ABOUT THE SKULL ASRIEL, WHAT ABOUT THE RIBS?
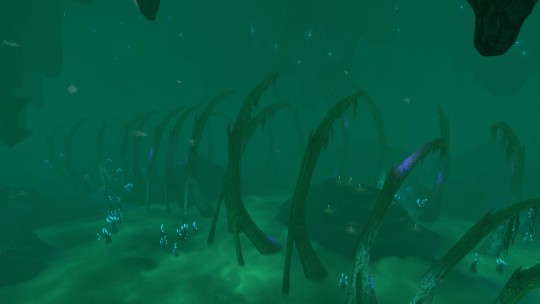
WELL... THE RIBS ARE... SOMETHING.


Behold! My very poor photomash of the same two images to show the total approximate length of the Gargantuan Leviathan, and a bad edit to show off what I believe the whole skeletal system would look like! (skeleton image credit)
Despite the game’s PDA describing the Gargantuan Leviathan’s body as “eel-like,” its skeletal structure is more reminiscent of a snake. The ribs show no indication of limbs, so it probably had a dorsal fin similar to eels or sea kraits.

One thing I’ve noticed about the Gargantuan’s ribcage is the existence of what appear to be bony, avian-like uncinate processes, which help the trunk’s muscles pump in and air out of the body, adding onto the idea that this leviathan breathed air. These uncinate processes in diving birds are especially long, which help reinforce the body and musculature, allowing the animal to stay underwater for longer periods of time.
My hypothesis for the role the Gargantuan Leviathan played in its ecosystem is similar to the Sperm Whales of our world, taking in large amounts of air before diving into the depths to fetch their food.
Next week, I’ll be doing more research into the skeleton and possibly beginning work on fleshing the Garg out! If there are any sciencey folks out on Tumblr who want to add their own input, feel free!! I want information!! Correct me if I got anything wrong!!
#long post#VERY long post#speculative biology#speculative paleobiology#paleontology#marine biology#fictional biology#subnautica#character analysis#monster biology#leviathan#gargantuan leviathan#essay
434 notes
·
View notes
Text
“There are no forbidden questions in science, no matters too sensitive or delicate to be probed, no sacred truths.” Carl Sagan
Ecoinvent, the world’s largest database on the environmental impact of wind and solar technologies, has no data from China, even though it makes most of the world's solar panels
The UN IPCC and IEA have relied on Ecoinvent estimates of life cycle CO2 emissions from solar, but given China refuses to be transparent in their reporting, Ecoinvent fudged the numbers using values from EU and US manufacturing.
As a result, Chinese derived solar PV panels have life cycles in the range of 170 to 250 kg CO2 equivalent per MWh versus the 50 kg CO2 per MWh so commonly used by the IPCC and others in calculating CO2 emission offset credits and in climate modelling.
Consider that advanced combined cycle gas turbine power plants have CO2 emission factors ranging from 300 to 350 kg CO2 per MWh and use a much smaller fraction of the amount of non-renewable materials per unit of energy produced than do solar PV facilities.
It is a well known fact that paring natural gas turbine technologies in a load balancing subservient role to solar PV gives rise to reduced thermal efficiencies of the turbine system. Thereby acting to further reduce the emission reduction benefits of solar PV and its already small marginal difference with a stand alone natural gas system.
The moral of the story is carbon credits are a scam, as are modelling projections of the climate effects of solar PV technologies.
123 notes
·
View notes
Text

Oceans of water found on Mars
Using seismic activity to probe the interior of Mars, geophysicists have found evidence for a large underground reservoir of liquid water — enough to fill oceans on the planet's surface.
The data from NASA's Insight lander allowed the scientists to estimate that the amount of groundwater could cover the entire planet to a depth of between 1 and 2 kilometers, or about a mile.
While that’s good news for those tracking the fate of water on the planet after its oceans disappeared more than 3 billion years ago, the reservoir won't be of much use to anyone trying to tap into it to supply a future Mars colony. It's located in tiny cracks and pores in rock in the middle of the Martian crust, between 11.5 and 20 kilometers below the surface. Even on Earth, drilling a hole a kilometer deep is a challenge.
The finding does pinpoint another promising place to look for life on Mars, however, if the reservoir can be accessed. For the moment, it helps answer questions about the geological history of the planet.
“Understanding the Martian water cycle is critical for understanding the evolution of the climate, surface and interior,” said Vashan Wright, a former UC Berkeley postdoctoral fellow who is now an assistant professor at UC San Diego’s Scripps Institution of Oceanography. “A useful starting point is to identify where water is and how much is there.”
Wright, alongside colleagues Michael Manga of UC Berkeley and Matthias Morzfeld of Scripps Oceanography, detailed their analysis in a paper that will appear this week in the journal Proceedings of the National Academy of Sciences.
The scientists employed a mathematical model of rock physics, identical to models used on Earth to map underground aquifers and oil fields, to conclude that the seismic data from Insight are best explained by a deep layer of fractured igneous rock saturated with liquid water. Igneous rocks are cooled hot magma, like the granite of the Sierra Nevada.
"Establishing that there is a big reservoir of liquid water provides some window into what the climate was like or could be like," said Manga, a UC Berkeley professor of earth and planetary science. "And water is necessary for life as we know it. I don't see why [the underground reservoir] is not a habitable environment. It's certainly true on Earth — deep, deep mines host life, the bottom of the ocean hosts life. We haven't found any evidence for life on Mars, but at least we have identified a place that should, in principle, be able to sustain life."
Manga was Wright's postdoctoral adviser. Morzfeld was a former postdoctoral fellow in UC Berkeley’s mathematics department and is now an associate professor of geophysics at Scripps Oceanography.
Manga noted that lots of evidence — river channels, deltas and lake deposits, as well as water-altered rock — supports the hypothesis that water once flowed on the planet's surface. But that wet period ended more than 3 billion years ago, after Mars lost its atmosphere. Planetary scientists on Earth have sent many probes and landers to the planet to find out what happened to that water — the water frozen in Mars' polar ice caps can't account for it all — as well as when it happened, and whether life exists or used to exist on the planet.
The new findings are an indication that much of the water did not escape into space but filtered down into the crust.
The Insight lander was sent by NASA to Mars in 2018 to investigate the crust, mantle, core and atmosphere, and it recorded invaluable information about Mars' interior before the mission ended in 2022.
"The mission greatly exceeded my expectations," Manga said. "From looking at all the seismic data that Insight collected, they've figured out the thickness of the crust, the depth of the core, the composition of the core, even a little bit about the temperature within the mantle."
Insight detected Mars quakes up to about a magnitude of 5, meteor impacts and rumblings from volcanic areas, all of which produced seismic waves that allowed geophysicists to probe the interior.
An earlier paper reported that above a depth of about 5 kilometers, the upper crust did not contain water ice, as Manga and others suspected. That may mean that there's little accessible frozen groundwater outside the polar regions.
The new paper analyzed the deeper crust and concluded that the "available data are best explained by a water-saturated mid-crust" below Insight’s location. Assuming the crust is similar throughout the planet, the team argued, there should be more water in this mid-crust zone than the "volumes proposed to have filled hypothesized ancient Martian oceans."
IMAGE: A cutout of the Martian interior beneath NASA's Insight lander. The top 5 kilometers of the crust appear to be dry, but a new study provides evidence for a zone of fractured rock 11.5-20 km below the surface that is full of liquid water — more than the volume proposed to have filled hypothesized ancient Martian oceans. Credit James Tuttle Keane and Aaron Rodriquez, courtesy of Scripps Institute of Oceanography
#science#space#astronomy#physics#news#nasa#astrophysics#esa#spacetimewithstuartgary#starstuff#spacetime#hubble space telescope#jwst
9 notes
·
View notes
Text


Reading List: Spirituality, Globalisation, Parenting and the 0.99 Cent Pricing Bias
What I’ve read (🖤) and planning to read (🤍)
Books
• Fall of human intellect - A Parvasarthy (genre: spirituality, humanness) 🖤
Academic Papers
The backlash against globalisation - Stefanie Walter (from annual review) 🤍
In recent years, the world has seen a rising backlash against globalization. This article reviews the nature, causes, and consequences of the globalization backlash. It shows that, contrary to a popular narrative, the backlash is not associated with a large swing in public opinion against globalization but is rather a result of its politicization. The increasing influence of globalization- skeptic actors has resulted in more protectionist, isolationist, and nationalist policies, some of which fundamentally threaten pillars of the contemporary international order. Both material and nonmaterial causes drive the glob- alization backlash, and these causes interact and mediate each other. The consequences are shaped by the responses of societal actors, national gov- ernments, and international policy makers. These responses can either yield to and reinforce the global backlash or push back against it. Understanding these dynamics will be an important task for future research.
The causes and consequences of urban riot and unrest - Tim Newburn (from annual review) 🤍
This review explores those varied bodies of work that have sought to un- derstand crowd behavior and violent crowd conduct in particular. Although the study of such collective conduct was once considered central to social science, this has long ceased to be the case and in many respects the study of protest and riot now receives relatively little attention, especially within criminology. In addition to offering a critical overview of work in this field, this review argues in favor of an expanded conception of its subject matter. In recent times, scholarly concern has increasingly been focused on ques- tions of etiology, i.e., asking how and why events such as riots occur, with the consequence that less attention is paid to other, arguably equally impor- tant questions, including how riots spread, how they end, and, critically, what happens in their aftermath. Accordingly, as a corrective, the review proposes a life cycle model of riots.
Parenting and it’s effects on children : reading and misreading behaviour genetics (from annual review) 🖤
There is clear evidence that parents can and do influence children. There is equally clear evidence that children’s genetic makeup affects their own behavioral characteristics, and also influences the way they are treated by their parents. Twin and adoption studies provide a sound basis for estimating the strength of genetic effects, although heritability estimates for a given trait vary widely across samples, and no one estimate can be considered definitive. This chapter argues that knowing only the strength of genetic factors, however, is not a sufficient basis for estimating environmental ones and indeed, that attempts to do so can systematically underestimate parenting effects. Children’s genetic predispositions and their parents’ childrearing regimes are seen to be closely interwoven, and the ways in which they function jointly to affect children’s development are explored.
More than a penny’s worth: left-digit bias and firm pricing- Avner Strulov-Shlain (from MorningBrew) 🤍
A penny saved. What’s the difference between $2.99 and $3.00? Basic math says one cent, but you probably perceive the difference to be about 22 cents, a new paper by a University of Chicago business school professor estimated. The research explores left digit bias—the phenomenon where consumers’ perceptions are overly influenced by the leftmost number in the price—and it brought receipts, analyzing retail scanner data on 3,500 products sold by 25 US chains. And while it might seem like every price you see ends in .99, the paper argues that retailers are leaving money on the table by underestimating this bias when setting prices.
#c suite#powerful woman#strong women#ceo aesthetic#personal growth#c suite aesthetic#working woman#beauty#empire#that girl#books#academic papers#parenting#globalisation#99 cents#0.99 marketing#marketing strategy#riots#spirituality#spiritual books
211 notes
·
View notes
Text
Space Suits - Then and Now
Since the dawn of the space age on Reyal, it became abundantly clear that there were many challenges they'd have to face.
As a social species, they struggle with solitude; the first few missions were a nightmare, as the panic from being detached from friends and family became a big issue. However, that was manageable with therapy and much shorter solo missions.
Radiation was a much more pressing issue, and after the long-term health affects became clear from the relative lack of protection, major steps were taken to build suits that would withstand the harsh environs of space.
Reyal is a very unique world, in that its thick atmosphere and highly active core provided much more shielding from cosmic and solar radiation than our own Earth would. This led to pretty much every life form on Reyal being much more susceptible to radiation's harmful effects, which would prove to be a very difficult roadblock on their technological voyage.
There was much discussion as what type of suit would be better after regular flight suits were proven to be ineffective; hardshell, which was heavy and hard to maneuver in but gave incredible protection, or soft shell, which was a tiny bit easier to work in, but offered barely any protection.
After some research and development, a mix was approved for use; soft around the joints, with most of the rest of the body being hardshell. It wasn't ideal, but there was very little else that can be done to combat the lack of mobility.

Art by @bjekkergauken
After years of development, hard work, and testing, the first deep space suits were approved for regular use. The above is a display model; showing heraldry only for the Global Resource Committee's Space Division, and crampons for a rocky or icy moon.
These used many new technologies and techniques to help protect the wearer, such as a camera based vision system. This not only helps protect the eyes, but can allow for a better understanding of the environment around the wearer, being able to cycle into different types of light wavelengths.
Some other useful features are the claw grabbers that replace the gloves, allowing for much easier mobility in the vacuum. Initial testing proved that softshell gloves were a nightmare to work with, causing many engineers to nearly quit out of frustration. A few late night brainstorming sessions later, they figured out that using a manipulator was much easier than anything else. This would become a mainstay for future suit design, and open up a massive world of possibilities for on-orbit construction and more.
Aside from that, the suit also boasts a data pad for easy communication & lookup, a jetpack for low-or-no gravity environments (fueled by pure nitrogen), and a hatchback for hooking up into vehicles for easy doffing and donning.
These suits were used en masse for many years, in a massive variety of situations; from low Reyal orbit and all the way out to Alkan and her twin, they saw very heavy use for the first few decades of the Lyratet's expansion into space.
However, as their needs expanded, the old generation of suits would prove to need an upgrade. Cameras failing while out, data pads falling off, life support issues, outdated technology, and more would be the sign that things had to change.

Art by @hellagator
Five years before the launch of the First Extended Thrallit Expedition, the Global Resource Committee finally approved and released the latest design; the Modular Deep Space Maneuvering Unit, or the MDSMU for short. This would be a massive upgrade from the previous design, making up for most of its shortfalls.
With advances in material science and a better understanding of life and work in space, the MDSMU sported much better mobility, all without sacrificing any radiation protection. A thin layer of a lead alloy, alongside water ice, was added to help aid in deflecting any harmful radiation. Aside from this, most everything is the same.
The same applies for the new and improved helmet, which allows for both regular vision, alongside the original camera vision. The visor is made of a heavy layer of leaded titanium glass on the outside, followed by a thin layer of water ice, and finally a quantum dot display on the inside. While it's just as safe to use regular vision these days, many still opt to cover up the outside, and use only the camera.
Another major advancement is the modular ability of the suit; while the previous design was used in a variety of situations, it wasn't very practical for exploration out past Alkan, or in the inner system past Reyal. The suit has dozens of other parts that can be swapped out or added, ranging from underwater maneuvering addons for Alkan, to an extended heating system for cave diving on Lejag, the outermost planet.
The suit can also be very easily modified to suit any changes to the wearer’s body, or in a swapping of people wearing it, thanks to machine learning and a complex system of elastic and memory foam. The only thing that doesn't change is the horn armor; GRCSED standards have them set to a certain height, mainly for ease of access among their many bases and outposts, and the dangers that come with overgrowth.
The only thing that would change would be the fuel used over the centuries; originally, monomethylhydrazine was used for fuel as an improvement upon just raw nitrogen. However, as some spills occurred in a few bases, it was quickly replaced with nitrogen once more due to the toxicity of the prior.
This suit design would be the last they would ever design, as the base was very easy to modify for practically any situation. From routine maintenance on Ro, all the way to the interstellar colony of Reyal-Lontag, the suit would see continued use until the end of civilization as we know it.
#my posts#worldbuilding#writeblr#creative writing#reyal#sophonts#as we go along#scifi#science fiction#scifi writing#scifiart#space opera#space exploration#spacesuit#spacesuits#radiation#writing#authors of tumblr#bookblr#booklr#novelist#aliens#alien#lyratet life & work#lyratet tech#<new tags for future posts!
18 notes
·
View notes
Text

Astronomy is the scientific study of celestial objects, space, and the universe as a whole, aiming to understand their origins, behavior, and interactions. Here are some branches of Astronomy
Astrophysics: Examining the physical properties and behavior of celestial objects and phenomena.
Planetary Science: Investigating planets, moons, and other objects within our solar system.
Stellar Astronomy: Analyzing the life cycles, properties, and behavior of stars.
Galactic Astronomy: Studying the formation, dynamics, and evolution of galaxies.
Cosmology: Exploring the structure, origin, evolution, and fate of the universe.
Exoplanet Studies: Searching for and characterizing planets orbiting other stars.
Astrobiology: Investigating the potential for life beyond Earth in various environments.
Astrochemistry: Exploring the chemical compositions of space objects and interstellar matter.
Astrometry: Precise measurement of positions and motions of celestial bodies.
Radio Astronomy: Studying celestial objects using radio waves and radio telescopes.
Infrared Astronomy: Observing objects by detecting their infrared radiation.
Ultraviolet Astronomy: Examining space objects through their ultraviolet emissions.
Gamma-Ray Astronomy: Studying extremely energetic phenomena through gamma-ray emissions.
X-ray Astronomy: Investigating high-energy phenomena using X-ray observations.
Optical Astronomy: Exploring space through visible light observations.
Meteoritics: Analyzing meteorites to understand the early solar system.
Celestial Mechanics: Studying the motion and interactions of celestial bodies.
Space Weather: Monitoring and predicting space-based phenomena that affect Earth.
Solar Physics: Examining the behavior and properties of the Sun.
Gravitational Astronomy: Detecting gravitational waves to study cosmic events.
Astrodynamics: Calculating the trajectories of objects in space.
Dark Matter Research: Investigating the elusive matter that affects the cosmos.
High-Energy Astrophysics: Studying extremely energetic processes in the universe.
Neutron Star Studies: Analyzing the properties and behavior of neutron stars.
Black Hole Research: Investigating the nature and effects of black holes.
Stellar Evolution: Understanding the life stages and changes of stars.
Observational Astronomy: Collecting and interpreting data from observations.
Theoretical Astronomy: Developing models and theories to explain celestial phenomena.
Astrostatistics: Applying statistical methods to analyze astronomical data.
Astroinformatics: Developing and using computer tools for astronomical research.
Cosmic Microwave Background: Studying the afterglow of the Big Bang.
Meteor Astronomy: Observing meteors, meteor showers, and their origins.
Space Archaeology: Applying satellite imagery to discover ancient sites.
Astrocartography: Mapping celestial objects and phenomena.
Space Debris Research: Monitoring and mitigating human-made space debris.
Astrophotography: Capturing images of celestial objects and events.
Variable Star Observations: Monitoring stars that change in brightness.
Astronomical Spectroscopy: Analyzing the interaction of light with matter in space.
Astrogeology: Applying geological principles to study extraterrestrial surfaces.
Astronomical Surveys: Systematic observations of large portions of the sky to discover new phenomena.
2 notes
·
View notes
Text
Researchers call it the “sea cow effect”: To save the kelp forests, read history
In findings published today in Frontiers in Ecology and Evolution, scientists from the California Academy of Sciences describe how one unassuming undulator, the Stellar’s sea cow, affected the kelp forests ringing North America’s Pacific coast before European visitors hunted it to extinction in the 1760s.
According to the authors, our tendency to assess ecosystems based on current and recent factors, which they call shifting baseline syndrome, may prevent us from seeing the big picture. Ecologically speaking, the sea cows were around until relatively recently, but because “relatively” here means “before scientific method came into its own,” they’ve been left out of most model.s
Much like how beavers create openings in the terrestrial canopy by damming streams to create lakes, the sea cow’s mighty megaherbivory cleared away the upper fronds of the kelp forests, allowing shafts of sunlight to pass through the otherwise photon-thirsty upper kelp into the marine understory and smaller plants, most significantly algae. The algae in turn provided food for other organisms.
Over the past few decades, California’s kelp forests have been dying off. Sea urchins have thrived in the area’s warming waters and have devoured the kelp plants, creating desolate stretches called urchin barrens. This may be due to human overhunting of their principal predators—sea otters. But unlike the Stellar’s sea cow, sea otters survived the European onslaught until the advent of protective legislation and are now in recovery. In efforts to save the kelp forests, researchers usually remembered sea otters but forgot the sea cows.
“When kelp forests were evolving millions of years ago, there were large marine herbivores like the Steller’s sea cow, which are now extinct,” says study co-author Dr. Peter Roopnarine. “So when it comes to what’s driving their widespread decline, there might be a major component we’re missing.” Roopnarine went on to compare the sea cows to terrestrial wildfires. Human beings might think they’re helping the forests by putting them out, but they’re actually a necessary and natural part of its life cycle.
Roopnarine and co-authors proposed a new model: the Past-Present-Future approach (PPF). This model incorporates what we think of as modern scientific data, museum samples, and ecological knowledge from traditional Indigenous sources.
The research team built a mathematical model of a kelp forest using data about sea urchins, sea otters, and other extant factors and then added the sea cows. According to study co-author Dr. Roxanne Banker of the University of Nevada, this transformed the forest completely. Their findings suggested that before about 1750, the kelp forests would have been better described as kelp-and-algae forests. With the sea cows clearing the upper layers of kelp away, algae would have dominated the middle levels.
This kelp-algae ecosystem would have been much more resilient to such challenges as drastic changes in temperature or hordes of oncoming urchins. Urchins, Banker points out, like to eat algae, and their voracious appetite for kelp may have been caused by the disappearance of this other food source. The researchers call this the “sea cow effect”: Even though, intuitively, it might seem like removing the large herbivores would help the kelp, it seems to have hurt them and every other organism nearby.
Roopnarine hypothesizes that sending human beings out to trim the kelp fronds might be produce something similar to this older, healthier kelp ecosystem.
Read the full text in Frontiers in Ecology and Evolution.
Roopnarine P, Banker R, Sampson S. Impact of the extinct megaherbivore Steller’s sea cow (Hydrodamalis gigas) on kelp forest resilience. Front. Ecol. Evol. November 28, 2022. https://doi.org/10.3389/fevo.2022.983558
www.lifescienceediting.com
4 notes
·
View notes
Text
Unlocking Business Growth: Harnessing the Power of Business Intelligence

Overview
Imagine you're the captain of a ship in the vast ocean of the business world. Business intelligence (BI) is your compass, your map, and your lookout, all rolled into one. It's the art and science of combining business acumen and technical knowledge to provide valuable data insights that guide your strategic and tactical decisions. The goal? To deliver the right data to the right people at the right time, propelling your organization forward with Microsoft Business Intelligence Consultant. Some of the components you might recognize include:
Business Reporting: The "What's happening?" of your data narrative.
Data Warehousing: Your data's safe harbor.
Decision Support Systems: The council that aids your choices.
Data Mining: Unearthing the hidden gems of information.
Online Analytical Processing: The looking glass that offers various perspectives.
Forecasting: Your business's weather forecast.
Data Mining Algorithms: The tools to sift through your data mines.
Predictive Analytics: Your crystal ball for business foresight.
Balanced Scorecard: The scoreboard of your organization's health.
Digital Dashboards: The control panel for your enterprise.
Reporting Portals: The gateways to your data discoveries.
Statistical Analysis: The magnifying glass over your numbers.
Business Process Improvement: The quest for the better way.
BI Business Components
Every organization's journey to business intelligence is unique. You might encounter scattered datasets, isolated reporting solutions, or conflicting metrics. When decision-makers start pondering questions like 'How do we define success?' or 'Are we tracking the right performance indicators?' - it's a clear sign that your organization might need to befriend the BI Maturity Model and embrace a BI Strategy Mapping. It's about weighing the value of your data to make more informed, holistic strategic decisions.
As per a recent survey, "only 24% of decision-makers say their organization is data-driven." This demonstrates a significant opportunity for organizations to harness BI and increase their competitive edge.
BI Technical Components
Your BI technical solution is like a custom-built vessel designed for the unique seas of your business. It could range from ad-hoc solutions to integrated dashboards and collaboration portals. The key questions are: Does your crew have the right skills? Are your BI tools seaworthy for the long haul in terms of scalability, security, and performance? Ensuring that your architecture and toolsets are not only functional today but can also adapt to the future is crucial.
Next Steps
The secret to successfully navigating the waters of data lies in a united effort across all decks of your organization. From the executive suite to the individual contributors, everyone must row in unison towards the organization's goals. Performance-based incentives, clear and motivating internal communication, and specialized skill sets experienced in coordinating multi-faceted efforts are essential.
Whether you're considering a partnership with a company like Ataira for outsourced business intelligence consulting or seeking trusted advisors for your internal team, it's important to work with certified experts who can support the entire life cycle of your BI initiatives - from the first blueprint to full-scale deployment and management.
Remember, "Data is the oil of the 21st century, and analytics is the combustion engine." - Peter Sondergaard. So let's fuel up and set sail towards a future where your data empowers every decision you make.
Click here to see how Power BI analytics development can improve performance in your organization
0 notes
Text
Your Guide to Learn about Data Science Life Cycle
Summary: This guide covers the Data Science Life Cycle's key stages, offering practical tips for managing data science projects efficiently. Learn how to transform raw data into actionable insights that drive business decisions.

Introduction
Understanding the Data Science Life Cycle is crucial for anyone looking to excel in data science. This cycle provides a structured approach to transforming raw data into actionable insights. By mastering each stage, you ensure that your data science projects are not only efficient but also yield accurate and meaningful results.
This guide will walk you through the essential stages of the Data Science Life Cycle, explaining their significance and offering practical tips for each step. By the end, you’ll have a clear roadmap for managing data science projects from start to finish.
What is the Data Science Life Cycle?
The Data Science Life Cycle is a systematic approach to managing data science projects, guiding the entire process from understanding the problem to deploying the solution.
It consists of several stages, including business understanding, data collection, data preparation, data exploration and analysis, modeling, and deployment. Each stage plays a critical role in transforming raw data into valuable insights that can drive decision-making.
Importance of the Life Cycle in Data Science Projects
Understanding the Data Science Life Cycle is essential for ensuring the success of any data-driven project. By following a structured process, data scientists can effectively manage complex tasks, from handling large datasets to building and refining predictive models.
The life cycle ensures that each step is completed thoroughly, reducing the risk of errors and enhancing the reliability of the results.
Moreover, the iterative nature of the life cycle allows for continuous improvement. By revisiting earlier stages based on new insights or changes in requirements, data scientists can refine models and optimize outcomes.
This adaptability is crucial in today’s dynamic business environment, where data-driven decisions must be both accurate and timely. Ultimately, the Data Science Life Cycle enables teams to deliver actionable insights that align with business goals, maximizing the value of data science efforts.
Read: Data Destruction: A Comprehensive Guide.
Stages of the Data Science Life Cycle

The Data Science Life Cycle is a systematic process that guides data scientists in turning raw data into meaningful insights. Each stage of the life cycle plays a crucial role in ensuring the success of a data science project.
This guide will walk you through each stage, from understanding the business problem to communicating the results effectively. By following these stages, you can streamline your approach and ensure that your data science projects are aligned with business goals and deliver actionable outcomes.
Business Understanding
The first stage of the Data Science Life Cycle is Business Understanding. It involves identifying the problem or business objective that needs to be addressed.
This stage is critical because it sets the direction for the entire project. Without a clear understanding of the business problem, data science efforts may be misaligned, leading to wasted resources and suboptimal results.
To begin, you must collaborate closely with stakeholders to define the problem or objective clearly. Ask questions like, "What is the business trying to achieve?" and "What are the pain points that data science can address?"
This helps in framing the data science goals that align with the broader business goals. Once the problem is well-defined, you can translate it into data science objectives, which guide the subsequent stages of the life cycle.
Data Collection
With a clear understanding of the business problem, the next step is Data Collection. In this stage, you gather relevant data from various sources that will help address the business objective. Data can come from multiple channels, such as databases, APIs, sensors, social media, and more.
Understanding the types of data available is crucial. Data can be structured, such as spreadsheets and databases, or unstructured, such as text, images, and videos.
Additionally, you must be aware of the formats in which data is stored, as this will impact how you process and analyze it later. The quality and relevance of the data you collect are paramount, as poor data quality can lead to inaccurate insights and faulty decision-making.
Data Preparation
Once you have gathered the data, the next stage is Data Preparation. This stage involves cleaning and preprocessing the data to ensure it is ready for analysis.
Data cleaning addresses issues such as missing data, outliers, and anomalies that could skew the analysis. Preprocessing may involve normalizing data, encoding categorical variables, and transforming data into a format suitable for modeling.
Handling missing data is one of the critical tasks in this stage. You might choose to impute missing values, drop incomplete records, or use algorithms that can handle missing data.
Additionally, outliers and anomalies need to be identified and addressed, as they can distort the results. Data transformation and feature engineering are also part of this stage, where you create new features or modify existing ones to better capture the underlying patterns in the data.
Data Exploration and Analysis
Data Exploration and Analysis is where you begin to uncover the insights hidden within the data. This stage involves conducting exploratory data analysis (EDA) to identify patterns, correlations, and trends. EDA is an essential step because it helps you understand the data's structure and relationships before applying any modeling techniques.
During this stage, you might use various tools and techniques for data visualization, such as histograms, scatter plots, and heatmaps, to explore the data. These visualizations can reveal important insights, such as the distribution of variables, correlations between features, and potential areas for further investigation.
EDA also helps in identifying any remaining issues in the data, such as biases or imbalances, which need to be addressed before moving on to the modeling stage.
Data Modeling
After exploring the data, the next stage is Data Modeling. This stage involves selecting appropriate algorithms and models that can help solve the business problem. The choice of model depends on the nature of the data and the specific problem you are trying to address, whether it's classification, regression, clustering, or another type of analysis.
Once you've selected the model, you'll train it on your data, testing different configurations and parameters to optimize performance. After training, it's crucial to evaluate the model's performance using metrics such as accuracy, precision, recall, and F1 score. This evaluation helps determine whether the model is robust and reliable enough for deployment.
Model Deployment
With a well-trained model in hand, the next step is Model Deployment. In this stage, you deploy the model into a production environment where it can start generating predictions and insights in real-time. Deployment may involve integrating the model with existing systems or setting up a new infrastructure to support it.
Continuous monitoring and maintenance of the model are vital to ensure it remains effective over time. Models can degrade due to changes in data patterns or shifts in business needs, so regular updates and retraining may be necessary. Addressing these issues promptly ensures that the model continues to deliver accurate and relevant results.
Communication of Results
The final stage of the Data Science Life Cycle is Communication of Results. Once the model is deployed and generating insights, it's essential to communicate these findings to stakeholders effectively. Visualization plays a key role in this stage, as it helps translate complex data into understandable insights.
You should present the results clearly, highlighting the key findings and their implications for the business. Creating actionable recommendations based on these insights is crucial for driving decision-making and ensuring that the data science project delivers tangible value.
Challenges in the Data Science Life Cycle
In the Data Science Life Cycle, challenges are inevitable and can arise at every stage. These obstacles can hinder progress if not addressed effectively. However, by recognizing common issues and implementing strategies to overcome them, you can ensure a smoother process and successful project outcomes.
Data Collection Issues: Incomplete or inconsistent data can disrupt analysis. To overcome this, establish clear data collection protocols and use automated tools for consistency.
Data Quality Problems: Poor data quality, including missing values or outliers, can lead to inaccurate models. Regular data cleaning and validation checks are crucial to maintain data integrity.
Complex Data Modeling: Selecting the right model and parameters can be challenging. To tackle this, experiment with different algorithms, and consider cross-validation techniques to refine your model.
Deployment Hurdles: Deploying models into production environments can face integration issues. Collaborate with IT teams and ensure proper infrastructure is in place for smooth deployment.
Communication Barriers: Effectively communicating insights to non-technical stakeholders is often difficult. Use visualizations and clear language to bridge this gap.
Collaboration and domain knowledge play a pivotal role in addressing these challenges. By working closely with domain experts and cross-functional teams, you can ensure that the data science project aligns with business objectives and achieves desired outcomes.
Best Practices for Managing the Data Science Life Cycle
Managing the Data Science Life Cycle effectively is crucial for ensuring project success and delivering actionable insights. By following best practices, you can streamline processes, enhance collaboration, and achieve better results. Here are some key tips for efficient project management in data science:
Prioritize Clear Communication: Maintain open channels of communication among team members to ensure everyone is aligned with project goals and timelines. Regular check-ins and updates help in addressing issues promptly.
Document Every Step: Proper documentation is essential for tracking progress and maintaining a clear record of decisions and methodologies. This not only aids in replication and debugging but also provides a reference for future projects.
Emphasize Version Control: Use version control systems like Git to manage changes in code, data, and models. This ensures that all team members work on the latest versions and can easily revert to previous states if necessary.
Choose the Right Tools and Technologies: Selecting appropriate tools for each stage of the data science life cycle is vital. Use powerful data processing tools like Python or R, data visualization tools like Tableau, and cloud platforms like AWS for scalability and efficiency.
By implementing these best practices, you can manage the Data Science Life Cycle more effectively, leading to more successful and impactful data science projects.
Frequently Asked Questions
What are the stages of the Data Science Life Cycle?
The Data Science Life Cycle consists of six key stages: Business Understanding, Data Collection, Data Preparation, Data Exploration and Analysis, Data Modeling, and Model Deployment. Each stage plays a crucial role in transforming raw data into actionable insights.
Why is the Data Science Life Cycle important?
The Data Science Life Cycle is essential because it provides a structured approach to managing data science projects. By following each stage methodically, data scientists can ensure accurate results, efficient workflows, and actionable outcomes aligned with business goals.
How does Data Exploration differ from Data Modeling?
Data Exploration involves analyzing and visualizing data to uncover patterns, correlations, and trends, while Data Modeling focuses on selecting and training algorithms to create predictive models. Exploration helps understand the data, and modeling leverages this understanding to solve specific business problems.
Conclusion
Mastering the Data Science Life Cycle is key to driving successful data-driven projects.
By understanding and meticulously following each stage—from business understanding to communication of results—you can ensure that your data science efforts yield accurate, actionable insights. Implementing best practices, such as clear communication, documentation, and tool selection, further enhances the efficiency and impact of your projects.
0 notes
Text

NASA’s PACE satellite’s Ocean Color Instrument (OCI) detects light across a hyperspectral range, which gives scientists new information to differentiate communities of phytoplankton – a unique ability of NASA’s newest Earth-observing satellite. This first image released from OCI identifies two different communities of these microscopic marine organisms in the ocean off the coast of South Africa on Feb. 28, 2024. The central panel of this image shows Synechococcus in pink and picoeukaryotes in green. The left panel of this image shows a natural color view of the ocean, and the right panel displays the concentration of chlorophyll-a, a photosynthetic pigment used to identify the presence of phytoplankton.
NASA is now publicly distributing science-quality data from its newest Earth-observing satellite, providing first-of-their-kind measurements of ocean health, air quality, and the effects of a changing climate.
The Plankton, Aerosol, Cloud, ocean Ecosystem (PACE) satellite was launched on Feb. 8, and has been put through several weeks of in-orbit testing of the spacecraft and instruments to ensure proper functioning and data quality. The mission is gathering data that the public now can access at https://pace.oceansciences.org/access_pace_data.htm.
PACE data will allow researchers to study microscopic life in the ocean and particles in the air, advancing the understanding of issues including fisheries health, harmful algal blooms, air pollution, and wildfire smoke. With PACE, scientists also can investigate how the ocean and atmosphere interact with each other and are affected by a changing climate.
“These stunning images are furthering NASA’s commitment to protect our home planet,” said NASA Administrator Bill Nelson. “PACE’s observations will give us a better understanding of how our oceans and waterways, and the tiny organisms that call them home, impact Earth. From coastal communities to fisheries, NASA is gathering critical climate data for all people.”
“First light from the PACE mission is a major milestone in our ongoing efforts to better understand our changing planet. Earth is a water planet, and yet we know more about the surface of the moon than we do our own oceans. PACE is one of several key missions – including SWOT and our upcoming NISAR mission – that are opening a new age of Earth science,” said Karen St. Germain, NASA Earth Science Division director.
PACE’s OCI instrument also collects data that can be used to study atmospheric conditions. The top three panels of this OCI image depicting dust from Northern Africa carried into the Mediterranean Sea, show data that scientists have been able to collect in the past using satellite instruments – true color images, aerosol optical depth, and the UV aerosol index. The bottom two images visualize novel pieces of data that will help scientists create more accurate climate models. Single-Scattering Albedo (SSA) tells the fraction of light scattered or absorbed, which will be used to improve climate models. Aerosol Layer Height tells how low to the ground or high in the atmosphere aerosols are, which aids in understanding air quality.
Credit: NASA/UMBC
The satellite’s Ocean Color Instrument, which was built and managed by NASA’s Goddard Space Flight Center in Greenbelt, Maryland, observes the ocean, land, and atmosphere across a spectrum of ultraviolet, visible, and near infrared light. While previous ocean color satellites could only detect a handful of wavelengths, PACE is detecting more than 200 wavelengths. With this extensive spectral range, scientists can identify specific communities of phytoplankton. Different species play different roles in the ecosystem and carbon cycle — most are benign, but some are harmful to human health — so distinguishing phytoplankton communities is a key mission of the satellite.
PACE’s two multi-angle polarimeters, HARP2 and SPEXone, measure polarized light that has reflected off clouds and tiny particles in the atmosphere. These particles, known as aerosols, can range from dust to smoke to sea spray and more. The two polarimeters are complementary in their capabilities. SPEXone, built at the Netherlands Institute for Space Research (SRON) and Airbus Netherlands B.V., will view Earth in hyperspectral resolution – detecting all the colors of the rainbow – at five different viewing angles. HARP2, built at the University of Maryland, Baltimore County (UMBC), will observe four wavelengths of light, with 60 different viewing angles.
Early data from the SPEXone polarimeter instrument aboard PACE show aerosols in a diagonal swath over Japan on Mar. 16, 2024, and Ethiopia on Mar. 6, 2024. In the top two panels, lighter colors represent a higher fraction of polarized light. In the bottom panels, SPEXone data has been used to differentiate between fine aerosols, like smoke, and coarse aerosols, like dust and sea spray. SPEXone data can also measure how much aerosols are absorbing light from the Sun. Above Ethiopia, the data show mostly fine particles absorbing sunlight, which is typical for smoke from biomass burning. In Japan, there are also fine aerosols, but without the same absorption. This indicates urban pollution from Tokyo, blown toward the ocean and mixed with sea salt. The SPEXone polarization observations are displayed on a background true color image from another of PACE’s instruments, OCI.
Credit: SRON
With these data, scientists will be able to measure cloud properties — which are important for understanding climate — and monitor, analyze, and identify atmospheric aerosols to better inform the public about air quality. Scientists will also be able to learn how aerosols interact with clouds and influence cloud formation, which is essential to creating accurate climate models.
Early images from PACE’s HARP2 polarimeter captured data on clouds over the west coast of South America on Mar. 11, 2024. The polarimetry data can be used to determine information about the cloud droplets that make up the cloudbow – a rainbow produced by sunlight reflected by cloud droplets instead of rain droplets. Scientists can learn how the clouds respond to man-made pollution and other aerosols and can measure the size of the cloud droplets with this polarimetry data.
Credit: UMBC
“We’ve been dreaming of PACE-like imagery for over two decades. It’s surreal to finally see the real thing,” said Jeremy Werdell, PACE project scientist at NASA Goddard. “The data from all three instruments are of such high quality that we can start distributing it publicly two months from launch, and I’m proud of our team for making that happen. These data will not only positively impact our everyday lives by informing on air quality and the health of aquatic ecosystems, but also change how we view our home planet over time.”
The PACE mission is managed by NASA Goddard, which also built and tested the spacecraft and the ocean color instrument. The Hyper-Angular Rainbow Polarimeter #2 (HARP2) was designed and built by the University of Maryland, Baltimore County, and the Spectro-polarimeter for Planetary Exploration (SPEXone) was developed and built by a Dutch consortium led by Netherlands Institute for Space Research, Airbus Defence, and Space Netherlands.
By Erica McNamee
NASA’s Goddard Space Flight Center, Greenbelt, Md.
News Media Contact
Jacob Richmond
NASA’s Goddard Space Flight Center, Greenbelt, Md.
0 notes
Text
Industrial Engineering: Enhancing Efficiency and Productivity
Industrial Engineering: Enhancing Efficiency and Productivity
Industrial engineering is a multifaceted field that focuses on optimizing complex processes, systems, and organizations. It integrates principles from engineering, mathematics, and social sciences to improve efficiency, productivity, and quality in various industries. As businesses strive to operate more effectively in a competitive global market, the role of industrial engineers becomes increasingly vital.
The Scope of Industrial Engineering
The scope of industrial engineering is broad and encompasses several key areas, including process optimization, quality control, supply chain management, ergonomics, and systems engineering. Industrial engineers work in diverse industries such as manufacturing, healthcare, logistics, and service industries, applying their skills to enhance operations and reduce waste.
Process Optimization
Process optimization is at the heart of industrial engineering. It involves analyzing and improving workflows to enhance efficiency and reduce costs. Industrial engineers use various tools and techniques, such as lean manufacturing, Six Sigma, and simulation modeling, to streamline processes and eliminate inefficiencies.
For example, in a manufacturing setting, an industrial engineer might analyze the production line to identify bottlenecks and implement changes that increase throughput. This could involve rearranging equipment, improving worker training, or adopting new technologies. The goal is to create a more efficient production process that maximizes output while minimizing waste and costs.
Quality Control
Quality control is another critical aspect of industrial engineering. Ensuring that products meet specified standards and customer expectations is essential for maintaining competitiveness and customer satisfaction. Industrial engineers develop and implement quality control systems that monitor production processes and detect defects early.
Techniques such as statistical process control (SPC) and total quality management (TQM) are commonly used in quality control. These methods help identify variations in the production process and take corrective actions before defects become widespread. By maintaining high quality standards, industrial engineers help companies reduce rework, recalls, and customer complaints.
Supply Chain Management
Supply chain management is a complex area that involves coordinating the flow of materials, information, and finances from suppliers to customers. Industrial engineers play a key role in optimizing supply chains to ensure timely delivery of products and minimize costs.
They use tools like demand forecasting, inventory management, and logistics planning to improve supply chain efficiency. By analyzing data and identifying trends, industrial engineers can develop strategies to reduce lead times, optimize inventory levels, and improve supplier relationships. Effective supply chain management helps companies respond quickly to market changes and customer demands.
Ergonomics and Human Factors
Ergonomics, or human factors engineering, is the study of how people interact with systems and environments. Industrial engineers use ergonomic principles to design workplaces, tools, and processes that enhance human performance and reduce the risk of injury.
In a manufacturing plant, for example, an industrial engineer might design workstations that minimize awkward postures and repetitive motions, thereby reducing the risk of musculoskeletal disorders. By improving the ergonomics of the workplace, industrial engineers help increase productivity, reduce absenteeism, and enhance worker satisfaction.
Systems Engineering
Systems engineering is an interdisciplinary approach that focuses on designing and managing complex systems throughout their life cycles. Industrial engineers use systems engineering principles to integrate various components and ensure they work together effectively.
This involves considering the entire system, from initial design to operation and maintenance. Industrial engineers use techniques like systems analysis, risk management, and project management to ensure that systems are efficient, reliable, and cost-effective. Systems engineering is particularly important in industries such as aerospace, defense, and healthcare, where complex systems must meet stringent performance and safety requirements.
Technological Advancements
Industrial engineering continually evolves with technological advancements. The integration of digital technologies, such as the Internet of Things (IoT), big data analytics, and artificial intelligence (AI), is transforming industrial engineering practices. These technologies enable real-time monitoring, predictive maintenance, and data-driven decision-making, further enhancing efficiency and productivity.
Conclusion
Industrial engineering plays a crucial role in enhancing efficiency and productivity across various industries. By optimizing processes, ensuring quality, managing supply chains, improving ergonomics, and integrating systems, industrial engineers help organizations operate more effectively. As technology continues to advance, the field of industrial engineering will remain essential in driving innovation and competitiveness in the global market.
Industrial Engineering: Enhancing Efficiency and Productivity
0 notes
Text

Ice caps on Mars offer clues to ancient climates
As a first-year master's student in the Department of Earth Sciences, Katherine Lutz became fascinated by satellite images of Mars that showed spiraling shapes swirling across the planet's polar ice caps.
Consisting of alternating layers of ice and dusty deposits and measuring 400 to 1,000 meters deep, these spiral patterns aren't seen anywhere on Earth.
"These look amazing, but do we actually understand why they form or how they evolve over time?" asks Lutz, now a Guarini School of Graduate and Advanced Studies Ph.D. student and National Science Foundation Fellow in the lab of professor Marisa Palucis, whose research areas include planetary landscape evolution. "Why are they here? How can we use these features?"
The layers on the polar ice cap offer scientists one of the best climate records for the Red Planet.
"Mars has undergone massive climate change and we spend a lot of time as planetary scientists trying to understand that," Palucis says. "The question of how much water has flowed across its surface (and when) has been central to its exploration."
Research from 2013 had suggested these "troughs" might be caused by katabatic winds—winds that start off moving rapidly, causing erosion, and then quickly drop and slow down, resulting in deposits. As a result, the troughs would be expected to have asymmetric walls as well as cloud formations hovering over them that correspond with katabatic wind activity.
With Palucis and Earth sciences professor Robert Hawley, Lutz analyzed a decade's worth of new Mars images and data and discovered that while 80% of the troughs were indeed asymmetric, roughly 20% were not. Rather, the troughs on the outer edges of the ice cap form a fairly uniform "V" shape, with the walls on either side measuring about the same height. Further, not all troughs had cloud cover.
In a paper published in the Journal of Geophysical Research: Planets, the researchers posit that these outer troughs are younger than those in the center of the polar ice cap and are likely caused by heavy erosion versus a katabatic wind cycle.
That could suggest, Lutz says, that 4 to 5 million years ago, there was a shift in the Martian climate that altered the planet's water cycle, causing winds, clouds, and ice to flow differently.
This would help explain why the troughs in the center of the ice cap are different from the ones on the edges, Lutz says, they formed at different times, under different climate conditions.
This type of discovery is crucial in trying to decipher whether Mars can support—or has ever supported—life.
"If we ever want to have people on Mars, we need to figure out the history of this water source," says Lutz, referring to the ice layers in these spirals.
"Could we potentially be using it to, say, extract drinkable water? And if we ever want to find evidence of life there now, we're not going to look at the outer edges of the ice cap, where it's just a lot of erosion and no water going into the system and there's not a lot of heating."
Lutz is quick to point out that these ice-cap layers are only records of climate on modern Mars. More modeling is needed to further illuminate the history and function of these unique spiral features, with the eventual goal of sending a physical rover to Mars to "get some more concrete information" about the troughs.
2 notes
·
View notes
Text
IBM Cloud HPC: Cadence-Enabled Next-Gen Electronic Design

Cadence makes use of IBM Cloud HPC
With more than 30 years of experience in computational software, Cadence is a leading global developer in electrical design automation (EDA). Chips and other electrical devices that power today’s growing technology are designed with its assistance by businesses all over the world. The company’s need for computational capacity is at an all-time high due to the increased need for more chips and the integration of AI and machine learning into its EDA processes. Solutions that allow workloads to move between on-premises and cloud environments seamlessly and allow for project-specific customization are essential for EDA companies such as Cadence.
Chip and system design software development requires creative solutions, strong computational resources, and cutting-edge security support. Cadence leverages IBM Cloud HPC with IBM Spectrum LSF as the task scheduler. Cadence claims faster time-to-solution, better performance, lower costs, and easier workload control using IBM Cloud HPC.
Cadence also knows personally that a cloud migration may call for new skills and expertise that not every business has. The goal of the entire Cadence Cloud portfolio is to assist clients worldwide in taking advantage of the cloud’s potential. Cadence Managed Cloud Service is a turnkey solution perfect for startups and small- to medium-sized businesses, while Cloud Passport, a customer-managed cloud option, enables Cadence tools for large enterprise clients.
Cadence’s mission is to make the cloud simple for its clients by putting them in touch with experienced service providers like IBM, whose platforms may be utilized to install Cadence solutions in cloud environments. The Cadence Cloud Passport approach can provide access to cloud-ready software solutions for usage on IBM Cloud, which is beneficial for organizations looking to accelerate innovation at scale.
Businesses have complicated, computational problems that need to be solved quickly in today’s cutthroat business climate. Such issues may be too complex for a single system to manage, or they may take a long time to fix. For businesses that require prompt responses, every minute matters. Problems cannot fester for weeks or months for companies that wish to stay competitive. Companies in semiconductors, life sciences, healthcare, financial services, and more have embraced HPC to solve these problems.
Businesses can benefit from the speed and performance that come with powerful computers cooperating by utilizing HPC. This can be especially useful in light of the ongoing desire to develop AI on an ever-larger scale. Although analyzing vast amounts of data may seem unfeasible, high-performance computing (HPC) makes it possible to employ powerful computer resources that can complete numerous calculations quickly and concurrently, giving organizations access to insights more quickly. HPC is also used to assist companies in launching innovative products. Businesses are using it more frequently because it helps manage risks more effectively and for other purposes.
HPC in the Cloud
Businesses that operate workloads during periods of high activity frequently discover that they are running above the available compute capacity on-premises. This exemplifies how cloud computing may enhance on-premises HPC to revolutionize the way a firm uses cloud resources for HPC. Cloud computing can help with demand peaks that occur throughout product development cycles, which can vary in length. It can also give businesses access to resources and capabilities that they may not require continuously. Increased flexibility, improved scalability, improved agility, increased cost efficiency, and more are available to businesses who use HPC from the cloud.
Using a hybrid cloud to handle HPC
In the past, HPC systems were developed on-site. But the huge models and heavy workloads of today are frequently incompatible with the hardware that most businesses have on-site. Numerous organizations’ have turned to cloud infrastructure providers who have already made significant investments in their hardware due to the large upfront costs associated with acquiring GPUs, CPUs, networking, and creating the data Centre infrastructures required to effectively operate computation at scale.
A lot of businesses are implementing hybrid cloud architectures that concentrate on the intricacies of converting a section of their on-premises data Centre into private cloud infrastructure in order to fully realize the benefits of both public cloud and on-premises infrastructures.
Employing a hybrid cloud strategy for HPC, which combines on-premises and cloud computing, enables enterprises to leverage the advantages of each and achieve the security, agility, and adaptability needed to fulfil their needs. IBM Cloud HPC, for instance, may assist businesses in managing compute-intensive workloads on-site flexibly. IBM Cloud HPC helps enterprises manage third- and fourth-party risks by enabling them to use HPC as a fully managed service, all while including security and controls within the platform.
Looking forward
Businesses can overcome many of their most challenging problems by utilizing hybrid cloud services via platforms such as IBM Cloud HPC. Organization’s adopting HPC should think about how a hybrid cloud strategy might support traditional on-premises HPC infrastructure deployments.
Read more on Govindhtech.com
#IBMCloud#ibm#machinelearning#hpc#cloudcomputing#HPCsystems#news#technews#technology#technologynews#technologytrends#govindhtech
0 notes
Text
NASA’s Compact Infrared Cameras Enable New Science - NASA
New Post has been published on https://sunalei.org/news/nasas-compact-infrared-cameras-enable-new-science-nasa/
NASA’s Compact Infrared Cameras Enable New Science - NASA
A new, higher-resolution infrared camera outfitted with a variety of lightweight filters could probe sunlight reflected off Earth’s upper atmosphere and surface, improve forest fire warnings, and reveal the molecular composition of other planets.
The cameras use sensitive, high-resolution strained-layer superlattice sensors, initially developed at NASA’s Goddard Space Flight Center in Greenbelt, Maryland, using IRAD, Internal Research and Development funding.
Their compact construction, low mass, and adaptability enable engineers like Tilak Hewagama to adapt them to the needs of a variety of sciences.
“Attaching filters directly to the detector eliminates the substantial mass of traditional lens and filter systems,” Hewagama said. “This allows a low-mass instrument with a compact focal plane which can now be chilled for infrared detection using smaller, more efficient coolers. Smaller satellites and missions can benefit from their resolution and accuracy.”
Engineer Murzy Jhabvala led the initial sensor development at NASA’s Goddard Space Flight Center in Greenbelt, Maryland, as well as leading today’s filter integration efforts.
Jhabvala also led the Compact Thermal Imager experiment on the International Space Station that demonstrated how the new sensor technology could survive in space while proving a major success for Earth science. More than 15 million images captured in two infrared bands earned inventors, Jhabvala, and NASA Goddard colleagues Don Jennings and Compton Tucker an agency Invention of the Year award for 2021.
Data from the test provided detailed information about wildfires, better understanding of the vertical structure of Earth’s clouds and atmosphere, and captured an updraft caused by wind lifting off Earth’s land features called a gravity wave.
The groundbreaking infrared sensors use layers of repeating molecular structures to interact with individual photons, or units of light. The sensors resolve more wavelengths of infrared at a higher resolution: 260 feet (80 meters) per pixel from orbit compared to 1,000 to 3,000 feet (375 to 1,000 meters) possible with current thermal cameras.
The success of these heat-measuring cameras has drawn investments from NASA’s Earth Science Technology Office (ESTO), Small Business Innovation and Research, and other programs to further customize their reach and applications.
Jhabvala and NASA’s Advanced Land Imaging Thermal IR Sensor (ALTIRS) team are developing a six-band version for this year’s LiDAR, Hyperspectral, & Thermal Imager (G-LiHT) airborne project. This first-of-its-kind camera will measure surface heat and enable pollution monitoring and fire observations at high frame rates, he said.
NASA Goddard Earth scientist Doug Morton leads an ESTO project developing a Compact Fire Imager for wildfire detection and prediction.
“We’re not going to see fewer fires, so we’re trying to understand how fires release energy over their life cycle,” Morton said. “This will help us better understand the new nature of fires in an increasingly flammable world.”
CFI will monitor both the hottest fires which release more greenhouse gases and cooler, smoldering coals and ashes which produce more carbon monoxide and airborne particles like smoke and ash.
“Those are key ingredients when it comes to safety and understanding the greenhouse gases released by burning,” Morton said.
After they test the fire imager on airborne campaigns, Morton’s team envisions outfitting a fleet of 10 small satellites to provide global information about fires with more images per day.
Combined with next generation computer models, he said, “this information can help the forest service and other firefighting agencies prevent fires, improve safety for firefighters on the front lines, and protect the life and property of those living in the path of fires.”
Probing Clouds on Earth and Beyond
Outfitted with polarization filters, the sensor could measure how ice particles in Earth’s upper atmosphere clouds scatter and polarize light, NASA Goddard Earth scientist Dong Wu said.
This applications would complement NASA’s PACE — Plankton, Aerosol, Cloud, ocean Ecosystem — mission, Wu said, which revealed its first light images earlier this month. Both measure the polarization of light wave’s orientation in relation to the direction of travel from different parts of the infrared spectrum.
“The PACE polarimeters monitor visible and shortwave-infrared light,” he explained. “The mission will focus on aerosol and ocean color sciences from daytime observations. At mid- and long-infrared wavelengths, the new Infrared polarimeter would capture cloud and surface properties from both day and night observations.”
In another effort, Hewagama is working Jhabvala and Jennings to incorporate linear variable filters which provide even greater detail within the infrared spectrum. The filters reveal atmospheric molecules’ rotation and vibration as well as Earth’s surface composition.
That technology could also benefit missions to rocky planets, comets, and asteroids, planetary scientist Carrie Anderson said. She said they could identify ice and volatile compounds emitted in enormous plumes from Saturn’s moon Enceladus.
“They are essentially geysers of ice,” she said, “which of course are cold, but emit light within the new infrared sensor’s detection limits. Looking at the plumes against the backdrop of the Sun would allow us to identify their composition and vertical distribution very clearly.”
By Karl B. Hille
NASA’s Goddard Space Flight Center, Greenbelt, Md.
0 notes
Text
Google Cloud enables digital transformations with cutting-edge solutions in industries like Retail, Finance, and Healthcare. Harness AI, multicloud capabilities, and global infrastructure to tackle your toughest challenges. Explore now.
RoamNook - Fueling Digital Growth body { font-family: Arial, sans-serif; margin: 40px; color: #333; } h1 { color: #666; text-align: center; } h2 { color: #666; margin-bottom: 10px; } p { margin-bottom: 20px; } a { color: #4285f4; text-decoration: none; } a:hover { text-decoration: underline; } .container { max-width: 800px; margin: 0 auto; } .logo { text-align: center; } .logo img { max-height: 100px; } .section { margin-bottom: 40px; } .section-title { font-size: 24px; font-weight: bold; margin-bottom: 10px; } .section-content { font-size: 16px; } .conclusion { text-align: center; margin-bottom: 40px; } .conclusion-title { font-size: 24px; font-weight: bold; color: #4285f4; margin-bottom: 10px; } .conclusion-content { font-size: 16px; }
Bringing New, Polarizing, and Informative Facts to the Table
Google Cloud
Google Cloud is a leading provider of cloud computing services that can help businesses solve their toughest challenges. With a focus on digital transformation, Google Cloud offers a wide range of solutions to accelerate business growth and drive innovation.
Key Benefits of Google Cloud:
Why Google Cloud - Top reasons businesses choose Google Cloud
AI and ML - Enterprise-ready AI capabilities
Multicloud - Run your applications wherever you need them
Global infrastructure - Build on the same infrastructure as Google
Data Cloud - Make smarter decisions with unified data
Open cloud - Scale with open, flexible technology
Security - Protect your users, data, and apps
Productivity and collaboration - Connect your teams with AI-powered apps
Reports and Insights:
Executive insights - Curated C-suite perspectives
Analyst reports - What industry analysts say about Google Cloud
Whitepapers - Browse and download popular whitepapers
Customer stories - Explore case studies and videos
Solutions
Google Cloud offers industry-specific solutions to reduce costs, increase operational agility, and capture new market opportunities. Whether you're in the retail, consumer packaged goods, financial services, healthcare and life sciences, media and entertainment, telecommunications, gaming, manufacturing, supply chain and logistics, government, or education industry, Google Cloud has tailored solutions for your digital transformation needs.
Not seeing what you're looking for?
See all industry solutions
Application Modernization:
CAMP Program - Improve your software delivery capabilities
Modernize Traditional Applications - Analyze and migrate traditional workloads to the cloud
Migrate from PaaS: Cloud Foundry, Openshift - Tools for moving existing containers to Google's managed container services
Migrate from Mainframe - Tools and guidance for migrating mainframe apps to the cloud
Modernize Software Delivery - Best practices for software supply chain and CI/CD
DevOps Best Practices - Processes and resources for implementing DevOps
SRE Principles - Tools and resources for adopting Site Reliability Engineering
Day 2 Operations for GKE - Tools and guidance for effective GKE management and monitoring
FinOps and Optimization of GKE - Best practices for running cost-effective applications on GKE
Run Applications at the Edge - Guidance for localized and low-latency apps on Google's edge solution
Architect for Multicloud - Manage workloads across multiple clouds with a consistent platform
Go Serverless - Fully managed environment for developing, deploying, and scaling apps
Artificial Intelligence:
Contact Center AI - AI model for speaking with customers and assisting human agents
Document AI - Automated document processing and data capture
Product Discovery - Google-quality search and product recommendations for retailers
APIs and Applications:
New Business Channels Using APIs - Attract and empower an ecosystem of developers and partners
Unlocking Legacy Applications Using APIs - Cloud services for extending and modernizing legacy apps
Open Banking APIx - Simplify and accelerate secure delivery of open banking compliant APIs
Databases:
Database Migration - Guides and tools to simplify your database migration life cycle
Database Modernization - Upgrades to modernize your operational database infrastructure
Databases for Games - Build global, live games with Google Cloud databases
Google Cloud Databases - Database services to migrate, manage, and modernize data
Migrate Oracle workloads to Google Cloud - Rehost, replatform, rewrite your Oracle workloads
Open Source Databases - Fully managed open source databases with enterprise-grade support
SQL Server on Google Cloud - Options for running SQL Server virtual machines on Google Cloud
Data Cloud:
Databases Solutions - Migrate and manage enterprise data with fully managed data services
Smart Analytics Solutions - Generate instant insights from data at any scale
AI Solutions - Add intelligence and efficiency to your business with AI and machine learning
Data Cloud for ISVs - Innovate, optimize, and amplify your SaaS applications using Google's data and machine learning solutions
Data Cloud Alliance - Ensure global businesses have seamless access and insights into the data required for digital transformation
Digital Transformation
Google Cloud helps businesses accelerate their recovery and ensure a better future through solutions that enable hybrid and multi-cloud environments, generate intelligent insights, and keep workers connected. Whether you want to reimagine your operations, optimize costs, or adapt to the challenges presented by COVID-19, Google Cloud has solutions for you.
Areas of Focus:
Digital Innovation - Reimagine your operations and unlock new opportunities
Operational Efficiency - Prioritize investments and optimize costs
COVID-19 Solutions - Get work done more safely and securely
COVID-19 Solutions for the Healthcare Industry - How Google is helping healthcare meet extraordinary challenges
Infrastructure Modernization - Migrate quickly with solutions for SAP, VMware, Windows, Oracle, and other workloads
Application Migration - Discovery and analysis tools for moving to the cloud
SAP on Google Cloud - Certifications for running SAP applications and SAP HANA
High Performance Computing - Compute, storage, and networking options to support any workload
Windows on Google Cloud - Tools and partners for running Windows workloads
Data Center Migration - Solutions for migrating VMs, apps, databases, and more
Active Assist - Automatic cloud resource optimization and increased security
Virtual Desktops - Remote work solutions for desktops and applications (VDI & DaaS)
Rapid Migration Program (RaMP) - End-to-end migration program to simplify your path to the cloud
Backup and Disaster Recovery - Ensure business continuity needs are met
Red Hat on Google Cloud - Enterprise-grade platform for traditional on-prem and custom applications
Productivity and Collaboration
Google Workspace offers a suite of collaboration and productivity tools designed for enterprises. Whether you need collaboration tools, secure video meetings, cloud identity management, browser and device management, or enterprise search solutions, Google Workspace has you covered.
Productivity and Collaboration Solutions:
Google Workspace - Collaboration and productivity tools for enterprises
Google Workspace Essentials - Secure video meetings and modern collaboration for teams
Cloud Identity - Unified platform for IT admins to manage user devices and apps
Chrome Enterprise - ChromeOS, Chrome Browser, and Chrome devices built for business
Cloud Search - Enterprise search for quickly finding company information
Security
Google Cloud provides advanced security solutions to detect, investigate, and respond to online threats. With security analytics and operations, web app and API protection, risk and compliance automation, software supply chain security, and more, Google Cloud helps protect your business from cyber threats.
Security Solutions:
Security Analytics and Operations - Solution for analyzing petabytes of security telemetry
Web App and API Protection - Threat and fraud protection for web applications and APIs
Security and Resilience Framework - Solutions for each phase of the security and resilience life cycle
Risk and compliance as code (RCaC) - Solution to modernize your governance, risk, and compliance function with automation
Software Supply Chain Security - Solution for improving end-to-end software supply chain security
Security Foundation - Recommended products to help achieve a strong security posture
Smart Analytics
Google Cloud's smart analytics solutions enable organizations to generate instant insights from data at any scale. With data warehousing, data lake modernization, Spark integration, stream analytics, business intelligence, data science, marketing analytics, geospatial analytics, and access to various datasets, Google Cloud provides the foundation for data-driven decision making.
Smart Analytics Solutions:
0 notes
Last Seen Blogs


damchutsu-blog
♢HONEYMOON♢

robertoflack-blog
Roberto Flack

yourwigee-blog
wigee

linkingnightvale
Linking Together Night Vale