#how to use large and small formula in ms excel
Explore tagged Tumblr posts
Visit Tumblr Blog
Explore Tumblr blogs with no restrictions, modern design and the best experience.
Last Seen Tumblr Blogs


Fun Fact
Tumblr was acquired by Yahoo for $1.1B in 2013.
Text
Understanding the Key Components of a Professional Salary Slip Format
A salary slip, also known as a payslip, is an essential document provided by an employer to employees as proof of salary payment. It includes detailed information about the earnings, deductions, taxes, and net pay for a specific period. Creating an accurate salary slip format is not only crucial for ensuring transparency between the employer and the employee, but also for compliance with statutory regulations and internal auditing processes.

Why Salary Slips Matter
Before diving into the format creation, it’s important to understand why salary slips are important:
Proof of Income: Employees use salary slips for visa applications, loan approvals, and rental agreements.
Legal Compliance: Organizations must comply with labor laws, tax regulations, and employee welfare provisions.
Transparency: Salary slips help maintain trust by clearly explaining how salaries are calculated.
Internal Record-Keeping: They help businesses track payroll expenses and manage HR records.
Components of an Accurate Salary Slip
To create a salary slip format that is both complete and accurate, you must include several standard components. These components are typically divided into two categories: Earnings and Deductions.
1. Basic Information
Every salary slip must begin with basic employee and employer information, including:
Company Name and Logo
Employee Name
Employee ID
Designation
Department
Pay Period (Month and Year)
Date of Issue
PAN/Aadhaar Number (in India) or other tax ID
2. Earnings Section
This section details all the components that contribute to the gross salary:
Basic Salary: The fixed component of the salary, usually 35-50% of the CTC (Cost to Company).
House Rent Allowance (HRA): Offered to employees to cover rental housing expenses.
Dearness Allowance (DA): Provided to offset inflation, common in government or PSU jobs.
Conveyance Allowance: For travel-related expenses.
Medical Allowance: Medical reimbursement if applicable.
Special Allowance or Performance Bonus: Variable pay based on performance.
Overtime or Incentives (if any): Additional payments for extra hours or achievements.
3. Deductions Section
Deductions are amounts subtracted from gross earnings to arrive at the net salary:
Provident Fund (PF): Statutory retirement benefit deduction, usually 12% of basic pay.
Professional Tax: Levied by state governments in some countries.
Employee State Insurance (ESI): Deduction for health insurance under the ESI Act.
Income Tax (TDS): Tax Deducted at Source based on income slab.
Loan Repayments or Advances: If the company has offered a loan.
Other Deductions: Late penalties, canteen charges, etc.
4. Net Pay
Net salary is calculated using:
Net Salary = Gross Salary – Total Deductions
This is the amount credited to the employee’s bank account.
5. Bank and Payment Details
Bank Account Number (partially masked)
Mode of Payment: Bank transfer, cheque, etc.
Date of Credit
6. Other Optional Details
Leave Balance Summary
Taxable and Non-Taxable Income Breakdown
Digital Signature of HR/Manager
Also Read- What is the Full Form of HR in the Company
Step-by-Step Guide to Creating a Salary Slip Format
Step 1: Choose the Tool
You can use any of the following tools to create a salary slip:
MS Excel or Google Sheets – Great for small businesses and startups.
Payroll Software (like Zoho Payroll, QuickBooks, etc.) – Ideal for larger organizations.
Custom ERP/HRMS systems – Tailored solutions for medium to large enterprises.
For beginners, Excel is highly recommended due to its flexibility and simplicity.
Step 2: Design the Layout
Create clear sections for:
Company Header
Employee Details
Earnings
Deductions
Net Pay
Notes or Approvals
Use borders, shading, and alignment to ensure the slip looks professional and easy to read.
Step 3: Add Formulas (in Excel)
Use basic Excel formulas to automate calculations:
=SUM() for total earnings and deductions
=Gross - Deductions for net salary
Conditional formatting to highlight errors or missing data
Step 4: Maintain Compliance
Ensure your salary slip adheres to the legal requirements of your jurisdiction. For example:
In India, include PAN/TAN details and statutory deduction breakdown.
In the U.S., display FICA, federal and state tax deductions.
Consult a legal or financial advisor if unsure.
Step 5: Test for Accuracy
Before generating salary slips in bulk:
Cross-verify sample data
Ensure formulas are working correctly
Validate statutory calculations (PF, ESI, TDS, etc.)
Step 6: Automate (Optional)
If your organization grows, consider automating slip generation via payroll software that integrates with attendance, leave, and tax modules.
Sample Salary Slip Format (Text Version)
Here’s a simple, textual format:
ABC Pvt. Ltd. 123 Business Park, New York, NY Salary Slip for the Month of March 2025
Net Pay: USD 4,120.00 Bank A/C: ****4567 | Payment Mode: Direct Deposit This is a computer-generated slip and does not require a signature.
Tips for Accuracy and Compliance
Regularly update tax rates and statutory deduction rules.
Keep employee information up to date.
Maintain confidentiality when sharing or storing slips.
Use password protection for digital slips.
Conclusion
Creating an accurate salary slip format is more than just entering numbers in a table—it reflects the financial and legal integrity of your organization. By including all necessary components, verifying calculations, and ensuring compliance, you not only build trust with employees but also streamline your payroll process. Whether you’re just starting or upgrading your HR practices, investing time in a precise salary slip format pays long-term dividends.
0 notes
Text
Register Model Generator | UVM Register Generator | Agnisys

The UVM register model is an essential component of the UVM-based verification for modern designs. In this article, we discuss the various paths to create a UVM register model. We at Agnisys help teams automatically generate the register model and over the years many teams have started using our tools. Often one of the first questions is for a team to decide what format to use. In this short article, we describe the points to consider when choosing the format for data entry for the register specification. The article is written in a way that will enable you to quickly understand your options.
Do you have legacy data?
Considering the merit of the existing format becomes crucial as the register specification incorporates more and more behavioral properties to the register fields, limiting your options when dealing with legacy data
Do you want to maintain the same format as the legacy data?
One of the reasons for keeping the legacy format and not attempting to move to a newer format could be the familiarity aspect. Perhaps you have scripts and other tools that consume that format. If you cannot make a change, then your options are limited.
If, however, you are free to change the format then, pick a format that is most suitable to you based on this article.
How important is the ease of use?
Often ease of use is very important for something as basic as register data. For ease of use, you may prefer Word or Spreadsheet data formats instead of requiring the team to learn a new language and its intricacies. Going to a GUI-based solution may work for a very small design size. However, most GUI solutions require users to click a lot to get anything entered. More importantly, the lack of cut-copy-paste-search, etc. makes it quite hard to use.
Do you already use MS Word for specifications?
Microsoft Word is widely used in the semiconductor industry. Small teams to large use Microsoft Word for creating functional specifications. It is very convenient to have the register specification inside the functional specification. IDSWord can be the preferable choice because it is an add-in to Microsoft Word.
Do you have a very large number of registers/fields?
IDSExcel is a good option to quickly enter a large number of registers and fields in a systematic tabular manner. Excel’s powerful formulas and several editing aids help in quickly creating a register spec. You can also use CSV (Comma Separated Values), however, the advantage of Excel is that it can have several sheets in one workbook, in CSV that’s not possible. All ASCII formats are useful for large numbers of data.
Do you need the team to enter data simultaneously?
This is a very important criterion to choose the format and the platform. There are three possible options:
Use ASCII text file. An ASCII text file can be edited simultaneously by multiple people if a version control system is used – like Git, CVS, SVN, etc. This is possible because the version control system can do diff and merge on the ASCII files. IDesignSpec supports several ASCII text file formats like SystemRDL, IP-XACT, RALF, CSV, XML, etc.
Use Google Sheets or Google Docs. Google Sheets and Google Docs natively support simultaneous edits. IDesignSpec supports both Google Sheets and Google Docs (currently in beta).
Word and Excel can also be used for simultaneous edits. One generic option is to use SharePoint for multiple and simultaneous edits for both IDSWord and IDSExcel files.
Another option is to break up the spec into top-level Word or Excel documents and low-level IPs in a separate Word or Excel file. This way multiple users can work simultaneously on the system specification. Excel 2013 files can be edited simultaneously by putting the files on a shared file system and selecting Review->Share Workbook.
Enabling simultaneous edits in various formats is one of the major features of IDS Enterprise Edition (IDS EE).
Do you mind learning a new language specifically for registers?
If you don’t mind learning a new language for registers then you can start with SystemRDL. SystemRDL is currently being revised by Accellera. However, IDesignSpec adds a lot of properties for describing the behavior of the registers/fields using the concept of User Defined Properties (UDP).
Are different IP specs coming from different sources?
It is possible that as an SoC developer, your team gets IP specs in different formats from different sources. In that case, it is important to understand what the format options are. For example, it's quite likely that you will get IP specs in IP-XACT format. It is also possible that some legacy IP is described in Excel or XML. In that case, you can either choose to convert all the formats to a single one of your choice or choose a top-level format to Reference the various formats without the conversion step. If you perform a format conversion, you will need to redo it each time the IP vendor or group makes a change. However, referencing the IP can help avoid the need for the conversion step. A top-level format that can reference other types of formats is Word and Excel which does not require any conversion step. If a conversion is carried out then any top-level format can be chosen.
What OS do you want to use?
Two aspects need to be considered here. The OS is for the creation of the spec and the OS is for the generation of the outputs. The following table describes the various outputs.CreationPossible optionsWindowsIDSWord, IDSExcel, IDSCal, IDSBatch, ASCIILinuxIDSCal, IDSBatch, ASCIIMacOSIDSMacWord, IDSCal, IDSBatch, ASCIIGeneration WindowsAllLinuxAll (including IDSWord, IDSExcel)MacOSAll
Bottom Line
As is evident in this article, the IDesignSpec suite of tools is very versatile and could easily fulfill a lot of your requirements.
Glossary
ASCII: Plain text file. For registers, this can be SystemRDL, IP-XACT, RALF, CSV, XML, or any other proprietary format. CSV: Comma Separated Values is an ASCII format that can be hand edited (with a lot of pain) or generated using Excel or some script. IDS: Refers to IDesignSpec – a tool created by Agnisys specifically for Addressable Registers and Memories.
IDS Batch: A tool which is the World’s most versatile register generation tool. IDSBatch is available as a command line tool on all OS platforms (Windows, Linux (Red Hat, Ubuntu etc. ), Mac OS.
IDS Word: This is an Add-in for Microsoft Word. It helps the user create register specifications in a hierarchical format inside Word and generate outputs from within Word. Word files created by IDSWord are 100% normal Word files. Outputs can be generated from these files using IDSBatch in a command line mode on any platform including Linux. IDS Excel: This is an Add-in for Microsoft Excel. It helps users to create register specifications in a hierarchical format inside Excel and generate outputs from within Excel. Excel files created by IDSExcel are 100% normal Excel files. Outputs can be generated from these files using IDSBatch can generate outputs from these files in command-line mode on any platform, including Linux. IDS Cal: This is an Add-in for OpenOffice Calc – the spreadsheet tool for Open Source OpenOffice and LibreOffice Projects. Files created by IDSCal are 100% normal OpenOffice files. Outputs can be generated from these files using IDSBatch in a command line mode on any platform including Linux. IDS EE: IDesignSpec Enterprise Edition IDS FM : IDS add-in for FrameMaker IDS gDocs: IDS for Google Docs. IDS sheets: IDS for Google Sheets.
IDS Mac/IDS WordMac : IDS for Word on Mac
IDS Mac/IDS ExcelMac : IDS for Excel on Mac IP-XACT: It's an industry standard created by Accellera for storing information about IP and SoC. Information can be about Registers, IO, interfaces, etc.
SharePoint: Microsoft’s platform for sharing files. SystemRDL: It's an industry standard created by Accellera for only registering information about IP and SoC. This standard is going through an upgrade. RALF: This is a register standard created by Synopsys. It has a Tcl – Tcl-based syntax.
XML: eXtensible Markup language. It’s an extensible format for storing arbitrary information in ASCII text format. It is typically used behind the scenes by the tools and not meant for direct editing by the user.
0 notes
Text
Large and Small Function in Excel in Hindi
Large and Small Function in Excel in Hindi
Large and Small Function in Excel in Hindi Large and Small Function – Ms-excel spreadsheet में Data के analysis को आसान बनाने के लिए कई built-in-functions प्रोवाइड किये गए है जिनमे लार्ज और स्माल फंक्शन एक बहुत ही Useful और महत्वपूर्ण Function है। इस Article में हम लार्ज फंक्शन और स्माल फंक्शन के बारे में डिटेल्स में जानेंगे। इस तरह के और एक्सेल फंक्शन्स के बारे में जानने के लिए नीचे दिए गए…

View On WordPress
#excel#excel array formula#excel formulas#excel formulas and functions#excel formulas in hindi#excel large#excel large and small function in excel#excel large and small functions#excel large formula#excel large function#excel small & large formula#excel small formula#excel small function#excel tips and tricks#formula#how to use large and small formula in ms excel#how to use large and small function in excel#how to use small and large formula in excel#how to use small function#how to use small function in excel#large#large & small in excel#large and small#large and small function#large and small function in excel#large and small function in ms excel#large and small in excel#large formula#large formula in excel#large function
0 notes
Text
Tools For Business Analytics Vs. MS Excel: A Comparison
Business analytics tools have revolutionized the way businesses make decisions. With the explosion of data in recent years, whether you're a small, medium, or large enterprise, you'll require sophisticated tools to analyze large datasets and gain insights into their operations. While Microsoft Excel has been a popular tool for business analytics for decades, it has limitations.
This blog will explore the limitations of using MS Excel for business analytics and compare popular tools for business analytics that can enhance data processing, visualization, and scalability.
MS Excel & Its Limitations for Business Analytics
You have probably used Microsoft Excel at some point, regardless of whether you are an expert in data analysis or dealing with data. Excel, launched in 1985 as part of Office 365, is a widely used spreadsheet program. The program takes the shape of a spreadsheet, with data organized into rows and columns and the capability to rapidly and easily apply computations and mathematical formulas. Additionally, it is utilized to transform data sets into visual information.
Excel is an excellent tool for basic data manipulation and visualization, but it falls short when it comes to handling large datasets. Excel can struggle to hold more than a few hundred thousand rows of data, and processing time can be prohibitively slow for complex calculations. Furthermore, manual data manipulation leaves Excel prone to human errors that can lead to inaccurate analysis.
Popular Tools For Data Analysis
Tableau
Tableau is a powerful data visualization tool that supports users with the ability to analyze and communicate their data meaningfully. With its intuitive drag-and-drop interface, Tableau allows users to quickly and easily create interactive dashboards, reports, and visualizations that enable them to identify insights and make informed decisions. Its USP lies in its ability to connect to multiple data sources, including spreadsheets, databases, and cloud services, allowing for seamless data integration from different sources. Tableau's robust data modeling capabilities, combined with its advanced analytics and data visualization features, make it a popular choice for businesses of all sizes.
Power BI
Power BI is a cloud-based business analytics service that provides users with a wide range of tools for data analysis and visualization. Its USP lies in its ability to connect to hundreds of data sources, including spreadsheets, databases, and cloud services, allowing businesses to integrate and analyze their data efficiently. With Power BI, users can create interactive dashboards, reports, and visualizations to identify insights and make informed decisions. Its advanced analytics and data modeling capabilities and its easy-to-use interface make it a popular choice for businesses looking for an all-in-one solution for their business analytics needs.
Google Analytics
Google Analytics is a web analytics service that gives businesses insights into website traffic and user behavior. Its USP lies in its ability to provide detailed information on how users interact with a website, including page views, bounce rates, and conversion rates. With Google Analytics, businesses can gain valuable insights into their online presence and make informed decisions about their digital marketing strategies. Its easy-to-use interface and powerful reporting capabilities make it a preferred choice for businesses of all sizes.
Grow’s BI Tool
Grow is a robust BI dashboard toolthat offers businesses a comprehensive real-time view of their data. Its USP lies in its ability to consolidate data from multiple sources, including spreadsheets, databases, and cloud services, into a single dashboard that can be accessed from anywhere. With Grow, users can create custom dashboards and reports to track KPIs, identify trends, and make data-driven decisions. Its intuitive interface and easy-to-use features make it a popular choice for businesses looking for a powerful BI dashboard tool that can be easily integrated into their existing workflows.
Why Does Grow Stand Out and Outperform Excel and Others?
While all of the above tools - Tableau, Power BI, Google Analytics, and Grow - offer unique and valuable features for business analytics, Grow stands out as the ultimate winner due to its comprehensive features, usability, and pricing.
Compared to MS Excel, Grow business intelligence tools provide firms with a scalable and efficient solution for handling large datasets and complex calculations. It offers an all-in-one platform for consolidating data from multiple sources and creating custom dashboards and reports that provide real-time insights into business performance.
Compared with other business analytics tools, Grow's BI dashboard tool outperforms its competitors with its intuitive interface, ease of use, and seamless integration with different data sources. It offers robust data modeling and analytics capabilities and powerful visualization features that enable businesses to identify insights and make informed decisions. Additionally, Grow offers a cost-effective solution, making it an attractive choice for businesses of all sizes.
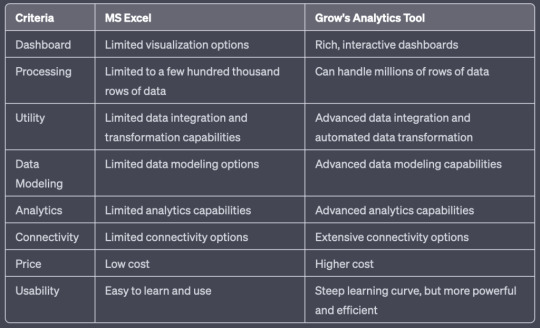
The Ultimate Comparison of Grow's BI and MS Excel
When it comes to handling large datasets, Grow's BI outperforms Excel. With the ability to handle millions of rows of data and an automated data transformation process, Grow's BI dashboard tool makes data analysis faster and more accurate. Its interactive data visualization capabilities also provide insights that are difficult to see with Excel's traditional charts and graphs.
Choosing the Right Tool for Your Business Needs
Selecting the right tool for business analytics depends on various factors, including business requirements, constraints, cost, and technical support. Evaluating each tool's features and advantages and comparing them to your business needs is essential before deciding. For example, while Power BI offers advanced data integration capabilities, there may be better tools for businesses with limited budgets. In this case, Grow comes out better than other tools in the market.
Conclusion
Do you need help with large datasets and complex calculations using MS Excel for your business analytics? Look no further than Grow Analytics and its powerful Business Intelligence tools.
With Grow Analytics, you can elevate your data analysis game to the next level using its powerful dashboard, comprehensive analytics suite, and user-friendly interface. Plus, their pricing is competitive and transparent, so you'll never have to worry about hidden costs or surprises.
But that's not all - with Epicor Grow, you can use a robust suite of integrated solutions designed to streamline your business operations and improve your bottom line. Grow BI offers many features, including advanced analytics, real-time data tracking, and customizable dashboards.
To truly understand what is Business Intelligence and why is it so important, head over to our informative blog and discover your reasons to use Grow Business intelligence.
Don't settle for subpar tools for business analytics using MS Excel - take your business to the next level with Epicor Grow. Join the ranks of satisfied Grow Analytics users after reading Grow Reviews 2023 and experience the power of business intelligence for yourself. Sign up today and see why businesses worldwide trust Grow to help them drive wins and expansion.
#Tools for business analytics#Business analytics tools#Bi dashboard tool#Business Intelligence tools
0 notes
Text
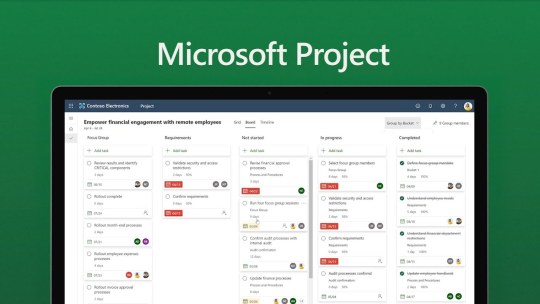
What Are The Benefits Of MS Project Training?
Introduction
In the present scenario, it has become important to have effective and excellent project management knowledge to become a professional project manager. With proper training and knowledge only, you can manage, long-duration, complex and complicated projects and execute the projects. However, to adapt to the latest changes and environments, enterprises make effective use of project management tools and software. This is where Microsoft Project comes in, allowing users to plan a project by creating a dynamic schedule model and also tracking and controlling the environment. In addition, it also adapts to all the changes you have made and highlights any conflict or error if detected. So, by joining the best MSP Microsoft Project Training Institute in Noida, you can save a lot of time and become a master of Microsoft Project.
Why Do You Need to Get Microsoft Project Training?
Recently, Microsoft Project has become the most popular industry-standard tool having a huge social presence. Hence, more than millions of large and small-scale enterprises make effective use of the Microsoft Project tool. As a result, many organizations mandate their project managers to become an expert and be proficient in the Microsoft Project tool. Moving forward, let us look closer at the benefits of taking Microsoft Project training provides to project managers:
By getting MSP training, you can create tasks and assign resources by making custom tasks, resources, and project calendars. In addition, with the help of MSP, you can set 11 baselines and 10 interim plans to build snapshots of project schedules.
You can create different resources and assign costs to them managing the allocation of tasks. Moreover, it will help you build a different resource calendar for various resources.
You can create a resource pool that helps identify shared resource conflicts with other projects. With this, you can manage resource data centrally and deliver better results.
It will help you monitor and control all the integrated performance of any project. Moreover, you can manage the work, schedule, and cost of the project.
MSP training will teach you about many unique features such as burndown, task overview, resource overview, and more. In addition, you can create custom reports and save custom report templates. Moreover, it will give you the ability to create dashboards for various projects using a master project plan.
With the help of Microsoft Project training, you can manage and track more than one project at a time using a master project plan.
You will get the ability to create different types of views like Gantt, Resource Usage, Task Sheets, and Calendars. Thus, this helps in analyzing the project data from different angles and focuses on required areas.
MSP training will help you learn how to create a customized view of any project that can be used in stakeholder presentations.
MSP training will give you the ability to add various custom fields like text, numbers, and flags using the required formulas to scale them. This will enhance the communication between team members and departments.
It will help you get familiar with features like Filters, Highlights, and Groups. In addition, you can use the features to filter and reflect tasks and resources. Moreover, you can use Group features to collect resources and create custom highlights.
With proper training, you will learn how to use the MSP with other popular tools like MS-Excel, Jira. Furthermore, you can use Microsoft Project with Enterprise based solutions like SharePoint and Project Server.
Conclusion
To sum up, Microsoft Project has become the most user-friendly and easy-to-learn platform. Thus, you need to have a little experience in project management. Hence, you can join the most popular MSP Microsoft Project Training Institute in Gurgaon to advance your skills and knowledge. Hence, you need to gain proficiency in Microsoft Project if you want to join this career path as a Project Manager or Portfolio Manager.
#MSP Microsoft Project Training Institute in Noida#MSP Microsoft Project Training Institute in Gurgaon
0 notes
Text
Jurassic: The New World, Chapter Four
InGen’s California headquarters were less… extravagant than the group expected.
“Are you sure this is the place?” Claire asked when they pulled up in front of the large, unmarked warehouse.
Owen nodded. “This is it. I guess they’re not too keen on people knowing who they are.”
“Can you blame them?” Zack said. “There would be a lot of trouble out here if they did more advertising.”
Zack was right. It took one of Alan Grant’s contacts for them to access InGen’s location The company managed to keep their headquarters a well-protected secret. That made Owen wonder what they were hiding inside.
“Everyone remembers the plan?” Owen whispered. “We get in, introduce ourselves, and request an audience. Look around for other options in case it doesn’t work.”
Everyone acknowledged the plan. It wasn’t ideal, but it was what they had to work with on short notice. Maisie had been missing for less than twenty-four hours, but with no ransom call and no trace of the young girl, Owen and Claire knew they had to do something to speed up the process. They couldn’t just wait around for someone else to get Maisie back. Neither of them were good at sitting on the sidelines, especially now.
Owen started to take the lead but Claire brushed ahead of him. He smirked at her back and followed close behind.
The warehouse had two glass doors on the farthest side of the building, but that appeared to be the only way to get in. All of the other doors were metal and likely only opened from the inside. Of course, the entry doors were surrounded by thick woods. They wouldn’t have noticed them if it weren’t for Gray pointing them out. His keen observation skills would help a lot on the mission.
Claire pulled one of the doors, expecting it to be locked, but found it opened easily for her. She walked inside nervously until she reached a reception desk. The older woman popped her gum and looked over her glasses at the group.
“You must be Claire and Owen Grady, and Karen, Zack, and Gray Mitchell,” she said. “We’ve been expecting you.”
Claire didn’t bother pointing out that she had her own last name. If she ever did get married, she planned to hyphenate, but that wasn’t the point.
“Where’s Maisie?” Owen growled.
The woman continued to look bored. “Dr. Wu will see you.”
A pair of security guards appeared around the corner to lead them into the proper building. Claire hesitated. “Where are you taking us?” she asked.
“Follow us, ma’am.”
The older guard attempted to take Claire’s arm, but she pulled away before he had the chance. Owen would have knocked the guy out if he grabbed Claire, so he was glad she was faster than the aged man.
“You can take us there without touching,” Claire admonished. He had the good sense to look scolded. “But first, tell us where we’re going. Do you have Maisie?”
“Dr. Wu’s office is just down this hallway. He will explain everything to you.”
Was everyone around here a robot? They wouldn’t put it past InGen to staff only artificial intelligence. Nothing about this company was real anymore.
Claire met Owen’s eyes. “What do you think?” she asked.
He shrugged. “We have no choice.”
Karen and the boys agreed without reluctance. “Let’s go,” Karen said. She followed behind her sister with her head held high. She hoped the guard would try to touch her, because she started practicing self-defense after her husband left and she had yet to use it on a real opponent.
The squat guard didn’t try to touch Karen, much to her dismay. He brought the group down a sterile hallway towards a single, frosted glass door. After two taps with the man’s chubby knuckles, the door creaked open like it was a thousand years old.
Owen and Claire shared a look. The squeaky door was eerily similar to the ones at Lockwood’s estate. The doors they had to hide behind as they were hunted by a dinosaur this company manufactured.
Claire walked first into the strange office, followed closely behind by Owen, Karen, Zack, and Gray.
Dr. Wu stood from behind his desk, causing everyone to wonder who opened the door for them. Everything about this seemingly abandoned warehouse was creepy.
“Welcome!” Dr. Wu greeted them. “I’ve been expecting you.”
Owen charged the doctor, grabbing the collar of his lab coat. “Where’s our daughter?”
Dr. Wu remained calm. “I don’t have your daughter, Owen,” he told them.
Owen didn’t back down. “Forgive me for not believing you after all the shit you put us through.”
Claire put a gentle hand on Owen’s arm. He lessened his grip, but didn’t let go.
“If we took your daughter, we would be breaking a court order. You could sue us, and we both know you’ve proven you can win. InGen is on thin ice as it is after Eli Mills’ mess.”
Claire cringed at the name of the man who swore he wanted to help the dinosaurs. If she hadn’t been so quick to listen to him, they might have avoided this situation.
“Yes, we wanted Maisie, but we don’t have her. But we know who does.”
Owen’s grip tightened once again. “Who took her?”
“Mr. Grady, I’m going to have to ask you to back off.”
Reluctantly, Owen released Dr. Wu and took a step back. His hands were clenched by his side, ready to take Wu again if he needed to.
“Excellent. How about we have a seat, shall we?”
There were five heavy, wooden chairs lined up in front of Wu’s desk. Two in the front, three in the back. Dr. Wu hadn’t just been expecting Owen and Claire, he knew they would bring reinforcements. Owen took note of this. How could Wu have known exactly how many people would show up?
Claire took a seat in the front row with Owen beside her. The boys flanked their mother in the back.
“Tell us who has Maisie,” Claire said calmly.
“We will reveal her location to you, Ms. Dearing, but we want something in return.”
“Are you blackmailing us?” she asked. At least Dr. Wu used her last name. “After all you did?”
Dr. Wu scoffed. “All I did? I only ever did what I was told. In fact, if I remember correctly, it was you who gave the green light on the indominus…”
Claire tensed. Wu was right, and she would carry that guilt for the rest of her life. At that moment, though, there was something much more important to worry about. This man knew where Maisie was. “Please, just tell us what you know about Maisie.”
“As I said, we want you to give us something in exchange for help in getting your daughter back. We will offer you our resources, our horde of security guards, and an exact location for Maisie’s whereabouts. All we want is one tiny thing in return.”
“Name it,” Owen said desperately. He hated being played with, but he could tell by the sparkle in Wu’s eye that the doctor wasn’t backing down. Dr. Wu had inherited all of InGen after the Lockwood scandal and he was keen to hold onto it. What he wanted to do with it, Owen wasn’t sure. He planned to find out after Maisie was safe at home.
“Ms. Dearing?” Dr. Wu asked.
Claire silently asked Owen what to do. When he gave a slight nod, she told Wu she was in. She said she’d do anything to get Maisie back, and apparently selling her soul to the devil was part of anything.
“Excellent,” Dr. Wu said. “After the incident with Lockwood’s estate, InGen has been working on a few new things. We’ve put the military on hold for now, but we have other ideas for the raptors.”
Wu watched Owen for his reaction, but Owen remained passive. What Dr. Wu couldn’t see was how tightly Owen and Claire held each other, blocked from his sight by the massive mahogany desk.
“If you capture Blue and bring her to us, we will provide all the necessary information and resources you need to get your daughter back.”
“Why don’t you capture Blue yourselves?” Owen spit.
Dr. Wu’s nostrils flared. “You think we haven’t tried? The creature evades us at every turn. She refuses to be caught.”
“What makes you think we’ll have different luck?”
“Blue trusts you. You caught her on the island. We know she helped you kill the indoraptor. You have a bond with that animal, and InGen plans to use that bond to lure her in.”
Owen took deep breaths to stop himself from crying. Blue had been through enough. He couldn’t be the one to put her back in captivity. The other escaped dinosaurs caused trouble all over North America, but not Blue. She only hunted wild animals, and never more than she needed to survive.
Owen knew because he kept track of her, and she kept track of him. They had no contact after that night she ran free, but he knew she was behaving.
But if Owen and Claire were going to get Maisie back, they needed Dr. Wu’s help. Neither of them wanted to admit it, but their research hadn’t brought them any closer to finding Maisie and the police had no leads. Dr. Wu was their only hope.
“We’ll do it,” Owen said finally.
“Owen, no,” Claire cried.
Owen shook his head. “But we do this on our own. If Blue even suspects you’re with us, she’ll run.”
Wu nodded. “Understood. You have one week to capture Blue and bring her to us.”
Dr. Wu opened a small box on his desk and pulled out two darts. Claire looked at them, confused, but Owen knew exactly what they were.
“I’m not using those darts on Blue.” They were the same darts that some idiot brought to Sorna. The darts used venom from the south sea cone shell and it would be deadly on Blue.
“They’re a new formula,” Wu promised. “This will put her to sleep in one shot, but it won’t hurt her. She’ll stay asleep for six hours after just one dose. That should give you enough time to get her to us. We have reason to believe Blue is here in California still.”
Owen didn’t have to ask how they knew. He was beginning to unravel how InGen’s new operation was working, and he didn’t like it.
Claire took the dart box from Dr. Wu. She wanted nothing more than to get out of his stark white office. The only color was the shiny, wooden desk. It was completely out of place in the otherwise hospital-like office. Claire had to talk some sense into Owen, and that wasn’t going to happen with Wu watching their every move.
“We except updates as you go,” Wu told them. “We’ll give you a call in, say, two days?”
Owen nodded. “We’ll have a plan by then.”
No one thanked Wu before walking out. He may have offered them the opportunity to find Maisie, but his cost was high.
Once outside the building, Claire opened her mouth to begin her spiel, but Owen stopped her.
“Not a word until I say so. Follow my lead.”
The serious look on Owen’s face kept their mouths shut. Owen powered up the van and drove. They talked candidly about the meeting and how they had to find Blue. Everyone allowed Owen to lead the conversation, though they were thoroughly confused.
Owen parked the van outside the trailer and motioned for the group to stay quiet. He led them through the woods for a mile before finally stopping.
“InGen knew we were coming,” he said finally. “I couldn’t figure out how. It didn’t make sense that they had those five chairs set up for us already, and they knew Karen and the boys’ names. Then it hit me: they knew we were coming because they heard us talking. The trailer is bugged.”
“What?” Claire whispered. “How can you be sure?”
“I can’t be until I sweep the trailer, but I’m pretty sure. It would explain a lot. How he knew we were coming, how he knew Maisie was missing…”
Claire hadn’t thought of that. The Amber Alert had only gone out that morning. InGen didn’t exactly scream ‘connected to the outside world.’
“That thing he said about the indominus being my fault… I had been talking to Karen about that earlier. About how I feel like I screwed Jurassic World up.”
“He played to both of our weaknesses in there. And he’s going to keep doing it until he gets what he wants.”
Claire teared up. “We can’t give him Blue. They’ll do horrible things to her…”
Owen looked around. InGen hadn’t come stampeding through the woods, so he figured they were probably safe.
Before Owen had a chance to speak, Claire started up again. “You raised her, Owen. And you’ve risked her life for her over and over again. You went to an exploding island to save her!”
Owen blinked. “You think I went back to Isla Nublar for Blue?”
“Of course. I told you she was still alive…”
He pulled Claire into his arms. “I didn’t go back to the island for Blue. I care about her, I do. I raised her. She is an incredible animal. But the only reason I went on that ridiculous trip, was you. As soon as you said you were going, I knew I had to go, too.”
“Seriously?” she asked, blinking back tears.
“Seriously,” Owen promised. He kissed her lightly then pulled away. Romance could wait. They had a daughter to save.
“What are we gonna do, Owen?” Zack asked. “That Dr. guy seemed pretty serious.”
Owen nodded. “He wasn’t messing around, but we can’t give them Blue. I don’t know how yet, but we’re gonna double cross them. We’ll keep Blue safe and get Maisie back. It’ll be risky…”
“But worth it,” Claire finished. “Blue deserves to be free. We’ll find her, and we’ll make sure she stays that way.”
Karen, Gray, and Zack all agreed.
Claire looked around. “Now what?”
“First, we strip the trailer for bugs. We’ll move them to the cabin so InGen doesn’t get too suspicious. They’ll still catch some of our conversations, just not the important ones. After that… we’ll make a plan.”
It sounded daunting to Claire, but she trusted Owen and she knew her sister and nephews were there to help. The sun started to set behind the trees, reminding Claire it had been almost a full day since Maisie went missing. And almost a full day since they’d eaten anything.
“Why don’t we order a pizza first, and de-bug the trailer later?”
Owen smiled, but his eyes were sad. Maisie loved pizza. They had it at least once a week for the month they were together. There was only one place that would deliver to their secluded home, and they always gave a generous tip to the poor kid who had to bring them their food. “That sounds like an excellent plan.”
They walked back to the trailer, Owen and Claire arm in arm, and tried not to worry about the pile of tasks they faced.
Saving Blue would be hard. Betraying InGen would be harder. Finding Maisie might be impossible without InGen’s help.
Even so, they would do everything to succeed in all three. They had been through so much already, including Karen who survived a nasty divorce and a newly dinosaur-filled lifestyle, and the boys who had years to recover from Jurassic World. Together, they would find Blue and Maisie.
No matter the cost.
#jurassic world#jurassic park#jurassic#dinosuars#claire dearing#owen grady#clowen#owen and cllaire#maisie lockwood#dr. alan grant#dr. grant#alan grant#fallen kingdom#jurassic world fallen kingdom#fanfiction#fanfic#story#fanstory#jurassic the new world#scifi#sci fi & fantasy#thriller#mystery
7 notes
·
View notes
Text
Manual Pivot Table On Mac Excel 20008

Pivot Table In Mac Excel
Pivot Table On Mac Excel 2016
Manual Pivot Table On Mac Excel 2008 Tutorials
What is a running total?
Excel 2008 for mac pivot tables excel 2008 for mac pivot tables excel for mac introducing pivottable ms excel 2017 for mac how to create a. By Geetesh Bajaj, James Gordon. In Excel 2011 for mac, a PivotTable is a special kind of table that summarizes data from a table, data range, or database external to the workbook.If you’re PivotTable aficionado, you will be in seventh heaven with the new PivotTable capabilities in Office 2011 for Mac. Manual Pivot Table On Mac Excel 2008 Shortcut Keys If you select a row or column label in the pivot table, then click the Sort button on the ribbon, you’ll see that sort options are set to Manual. To return a pivot table to it’s original sort order at any time, just sort the field alphabetically again. Pivot Charts Are Here!
A running total in Excel (also known as cumulative sum) refers to the partial sum of a data set. It is a summation of a sequence of numbers that is refreshed every time a new number is added to the sequence.
Running totals are very commonly used in Excel, especially when daily data is involved such as daily sales, daily bank balance, daily calorie intake or the scores of a sports game. It reveals the total number for each day or month, depending on the measurements.
How to create a running total
There are many ways to create a running total, including using simple addition, the SUM function, and Pivot Tables.
The combination of Photos (for iOS) and Photos (for the Mac) also work together in some spectacular ways—like iCloud Photo Library. This feature, should you choose to accept it, stores all of your photos and videos online—and lets you view them on any Apple product (Mac, iPhone, iPad, etc.) identically. Apple’s new Photos app lets you do a whole lot more than simply store and edit pictures and videos on a Mac or iOS device. With this comprehensive guide, you’ll learn how to import, organize, and share your digital memories, as well as how to improve, print, and use your photos in creative projects. https://photoload409.tumblr.com/post/652943496337129472/photos-for-mac-and-ios-the-missing-manual.
Let’s look at how to create a basic running total by using addition to familiarize you with the logic behind it.
Download your free running total practice file
Cheap mac cosmetics mac makeup wholesale cheap mac makeup remover. Use this free Excel file to practice along with the tutorial.
Below is a credit card statement with various expenses and credits in the list. A running total helps keep track of the credit limit available and personal expenditures.To create a running total, click D2 and enter =C2, the beginning credit limit to start with.
Given that running totals reveal the summation of the data as new items are added to the total mix, to keep the changes:
Click Cell D3, enter =D2+C3.
This is to add the beginning credit limit and the new item — an expense from Whole Foods.
Now Cell D3 indicates the credit limits after deducting the expense from Whole Foods — $4916.
Pivot Table In Mac Excel
To find out the remaining credit limits available, drag down the formula in D3 and apply it to the rest of the cells under column D.
From the formulas, you can tell that each value of the running total takes reference from the previous value of running total and adds on the value of the new item.
Below is the full picture, with running total detailing the movement of the credit limit with each item added on.
How to calculate a running total in Excel
As mentioned previously, there are multiple ways to calculate running totals in Excel, depending on the complexity of the situation on hand and the usage.
1. Create running total by using the SUM function
Creating a running total by using the SUM function is pretty similar to using simple addition.
In Cell D2, enter:
This is to add up the value of the beginning credit limit and the header — Running Total. The header contains no value itself, and will be considered as 0 in the calculation.
This, unlike addition, saves you from the extra work of creating the beginning balance first, then adding the new item in the second cell.
Copy the formula in the rest of the cell. It should look like the image below, with each running total taking reference from the previous values.
Though, when a row is added, there will be a gap in the running total, and users will need to copy the formula and drag it down to refresh the rest.
Likewise, when a row is deleted, error #REF! shows as the cell reference is removed. To calculate the running total, copy the formula from the last correct cell (D5) and apply to the rest.
The SUM function makes it quick and easy to calculate the running total. However, when adjustments to the data are required (e.g. adding or deleting a row) users will need to manually adjust and re-apply the correct formulas to the cells.
If the data set is small with a few calculations or sheets involved, manual adjustments are straightforward. However, if the data set is large with multiple sheets and cell referencings involved, manual adjustments will be more difficult and might lead to errors.
2. Create running total by using the SUM function and mixed reference
Users can include mixed reference — both absolute and relative reference — in the SUM formula to calculate the running total.
In Cell D2, enter:
This is to lock the reference to cell C2, so the summation will always begin from cell C2.
Copy the formula and drag it down to apply it to the rest of the cells.
As you can see below, the running total in cell D5 calculates the summation of the values from C2 to C5.
The summation will always begin from cell C2 as it has been locked with the $ sign (absolute reference), and includes any other values between C2 and C5 (a relative reference).
Same as the SUM Function, inserting and removing a row will create errors in the formulas and will require manual adjustments.
3. Create running total by using Pivot Tables
Pivot Tables are a powerful feature in Excel that allow you to organize, summarize, and analyze tables. It’s commonly used to sort, group, calculate the sum, average or count the values. Damage psychology. A Pivot Table can calculate running totals as well.
In a new spreadsheet, create the Pivot Table by using the same set of data.
Under Rows, add Date and Description
Under Values, include movement twice. This is so that column C will be showing the daily subtotal and total of the movement. And column D — Sum of Movement 2 will be modified to show running total later.
For easy viewing, the Pivot Table is shown using the outline form below.
In the Pivot Table Fields, right click Sum of Movement 2 to access the menu selection. Click Value Field Settings.
The Value Field Settings dialogue box will appear. Plenty of things can be done here.
First, change the name to “Running Total” to differentiate it.
Select Tab — Show Values As, and in the dropdown list, find Running Total In, so the values will be shown as Running Total. In the Base Field, select — Date, as the running total will be performed based on the dates. Click OK.
Now, the Pivot Table displays the running total of the credit movement by dates. The label of the field is updated as well to Running Total.
In this example, the subtotals are shown at the top of each group. You are free to change it to the bottom of each group if that suits your habits better.
Under the Design Tab, find Subtotals, then click — Show all Subtotals at Bottom of Group.
Now the Pivot Table displays all the information in an organized manner, detailing the activities by date and the totals of the credit movements and the running total by dates.
If there are any changes to the source data, whether to add or delete a row, simply click refresh, and the table will reflect the changes automatically.
There is no perfect way to create running totals in Excel. All three methods reveal the same results, and each has their own pros and cons. It depends on the complexity of the data set and the calculations on hand.
Differences on Windows and Mac
The steps required to perform running total on Windows and Mac are the same.
Summary
Running totals in Excel (also known as cumulative sum) are useful to keep track of progression and changes over time, especially when there is new data coming in or old data being removed from the data set. It’s usually used to monitor sales patterns, bank balance, calorie intake, utility charges and scores of sport games.
There are multiple ways to create running totals in Excel, each with their own pros and cons. It’s important to consider one’s needs and review the data set before choosing the most efficient method to calculate the running total in Excel.
Try the GoSkills Microsoft Excel - Basic and Advanced course today to improve your skills in Excel.
Level up your Excel skills
Pivot Table On Mac Excel 2016
Become a certified Excel ninja with GoSkills bite-sized courses
Manual Pivot Table On Mac Excel 2008 Tutorials
Start free trial
0 notes
Text
how do you calculate percentile in excel
how do you calculate percentile in excel
Hello dear friends, thank you for choosing us. In this post on the solsarin site, we will talk about “ how do you calculate percentile in excel“.Stay with us.Thank you for your choice.
Excel PERCENTILE Function
how do you calculate percentile in excel
Summary
The Excel PERCENTILE function calculates the “kth percentile” for a set of data. A percentile is a value below which a given percentage of values in a data set fall. You can use PERCENTILE to determine the 90th percentile, the 80th percentile, etc.
Purpose
Get kth percentile
Return value
Calculated percentile for k
Syntax
=PERCENTILE (array, k)
Arguments
array – Data values.
k – Number representing kth percentile.
Version
Excel 2003
Usage notes
The Excel PERCENTILE function
The Excel PERCENTILE function calculates the “kth percentile” for a set of data. A percentile is a value below which a given percentage of values in a data set fall. A percentile calculated with .4 as k means 40% percent of values are less than or equal to the calculated result, a percentile calculated with k = .9 means 90% percent of values are less than or equal to the calculated result.
To use PERCENTILE, provide a range of values and a number between 0 and 1 for the “k” argument, which represents percent. For example:
=PERCENTILE(range,.4) // 40th percentile =PERCENTILE(range,.9) // 90th percentile
You can also specify k as a percent using the % character:
=PERCENTILE(range,80%) // 80th percentile
PERCENTILE returns a value greater than or equal to the specified percentile.
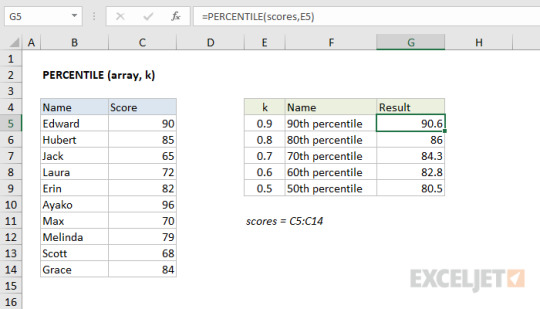
In the example shown, the formula in G5 is:
=PERCENTILE(scores,E5)
where “scores” is the named range C5:C14.
Note: Microsoft classifies PERCENTILE as a “compatibility function”, now replaced by the PERCENTILE.INC function.
how do you calculate percentile in excel
Percentile IF in table
This formula sits inside a small summary table with percentile values in column F and gender values in G4 and H4. Working from the inside out, the IF function is set up like this: IF(Table[Gender]=G$4,Table[Score…
Excel SMALL Function
The Excel SMALL function returns numeric values based on their position in a list ranked by value. In other words, it can retrive “nth smallest” values – 1st smallest value, 2nd smallest value, 3rd smallest value, etc.
Excel LARGE Function
The Excel LARGE function returns numeric values based on their position in a list when sorted by value. In other words, it can retrieve “nth largest” values – 1st largest value, 2nd largest value, 3rd largest value, etc.
Excel RANK Function
The Excel RANK function returns the rank of a numeric value when compared to a list of other numeric values. RANK can rank values from largest to smallest (i.e. top sales) as well as smallest to largest (i.e. fastest time).
PERCENTILE function
Excel for Microsoft 365 Excel for Microsoft 365 for Mac Excel for the web Excel 2019 More…
Returns the k-th percentile of values in a range. You can use this function to establish a threshold of acceptance. For example, you can decide to examine candidates who score above the 90th percentile.
Important:
This function has been replaced with one or more new functions that may provide improved accuracy and whose names better reflect their usage. Although this function is still available for backward compatibility, you should consider using the new functions from now on, because this function may not be available in future versions of Excel.
For more information about the new functions, see PERCENTILE.EXC function and PERCENTILE.INC function.
how do you calculate percentile in excel
Syntax
PERCENTILE(array,k)
The PERCENTILE function syntax has the following arguments:
array Required. The array or range of data that defines relative standing.
k Required. The percentile value in the range 0..1, inclusive.
Remarks
If k is non-numeric, PERCENTILE returns the #VALUE! error value.
If k is < 0 or if k > 1, PERCENTILE returns the #NUM! error value.
If k is not a multiple of 1/(n – 1), PERCENTILE interpolates to determine the value at the k-th percentile.
What is the PERCENTILE Function?
The PERCENTILE function is categorized under Excel Statistical functions. PERCENTILE will return the k-th percentile of the values in a particular range.
In corporate finance, we can use the function to analyze, for example, the number of employees who scored above a certain percentile on a test.
In MS Excel 2010, the PERCENTILE function was replaced by the PERCENTILE.INC function. However, PERCENTILE is still available in current versions of Excel (stored in the list of compatibility functions).
Formula
=PERCENTILE(array,k)
The PERCENTILE function uses the following arguments:
Array (required argument) – This is the array or range of data that defines the relative standing.
k (required argument) – The percentile value in the range 0…1, inclusive.
How to use the PERCENTILE Function in Excel?
As a worksheet function, PERCENTILE can be entered as part of a formula in a cell of a worksheet.
Percentage
In mathematics, a percentage (from Latin per centum “by a hundred”) is a number or ratio expressed as a fraction of 100. It is often denoted using the percent sign, “%”,[1][2] although the abbreviations “pct.”, “pct” and sometimes “pc” are also used.[3] A percentage is a dimensionless number (pure number); it has no unit of measurement.
Examples
For example, 45% (read as “forty-five percent”) is equal to the fraction 45/100, the ratio 45:55 (or 45:100 when comparing to the total rather than the other portion), or 0.45. Percentages are often used to express a proportionate part of a total.
(Similarly, one can also express a number as a fraction of 1000, using the term “per mille” or the symbol “‰”.)
Example 1
If 50% of the total number of students in the class are male, that means that 50 out of every 100 students are male. If there are 500 students, then 250 of them are male.
Example 2
An increase of $0.15 on a price of $2.50 is an increase by a fraction of 0.15/2.50 = 0.06. Expressed as a percentage, this is a 6% increase.
While many percentage values are between 0 and 100, there is no mathematical restriction and percentages may take on other values.[4] For example, it is common to refer to 111% or −35%, especially for percent changes and comparisons.
resource: wikipedia
A few notes about the PERCENTILE function:
#NUM! error – Occurs if either:
The supplied value of k is less than 0 or greater than 1.
The supplied array is empty.
#VALUE! error – Occurs if the supplied value of k is non-numeric.
If k is not a multiple of 1/(n – 1), PERCENTILE interpolates to determine the value at the k-th percentile.
Random Posts
what percent of alcohol is in corona beer
what percentage of the earth’s freshwater is available for drinking
how much alcohol percentage is in white claw
how do you work out percentages on iphone calculator
smirnoff bottle alcohol content
PERCENTILE in Excel
For Percentile calculation, we have a function in excel with the same name. Percentile function is used for calculating the nth percentile of any set of values below, which given the percentage of observations of the selected set of values, falls. Suppose we have 10 numbers, for which we calculate percentile at 5th value, then we will get the percentile below selected Kth value.
Difference between Percentile & percentage function
Percentage function
The exam reflects how well you have done in the exam as an individual; the percentage score is calculated on the basis of the below-mentioned formula.
Percentage = Marks scored/Total score x 100 e.g. If marks are 80, 80/100 x 100 = 80%
Excel Percentile Function
Percentile is a measure of your performance relative to others; it depends on the other students’ scores also.
Percentile = Number of students scored less than you/Total number of students x 100
Suppose, if your score or marks is 60th, out of 100 students, that means your score is better than 60 people, and hence your percentile is 60%ile. Here it indicates what percent of students you are ahead of, including yourself.
how do you calculate percentile in excelHello dear friends, thank you for choosing us. In this post on the solsarin site, we will talk about “ how do you calculate percentile in excel“. Stay with us. Thank you for your choice.
Excel PERCENTILE Function
Summary
The Excel PERCENTILE function calculates the “kth percentile” for a set of data. A percentile is a value below which a given percentage of values in a data set fall. You can use PERCENTILE to determine the 90th percentile, the 80th percentile, etc.
PurposeGet kth percentileReturn valueCalculated percentile for kSyntax=PERCENTILE (array, k)Arguments
array – Data values.
k – Number representing kth percentile.
VersionExcel 2003Usage notesThe Excel PERCENTILE function
The Excel PERCENTILE function calculates the “kth percentile” for a set of data. A percentile is a value below which a given percentage of values in a data set fall. A percentile calculated with .4 as k means 40% percent of values are less than or equal to the calculated result, a percentile calculated with k = .9 means 90% percent of values are less than or equal to the calculated result.
To use PERCENTILE, provide a range of values and a number between 0 and 1 for the “k” argument, which represents percent. For example:
=PERCENTILE(range,.4) // 40th percentile =PERCENTILE(range,.9) // 90th percentile
You can also specify k as a percent using the % character:
=PERCENTILE(range,80%) // 80th percentile
PERCENTILE returns a value greater than or equal to the specified percentile.
In the example shown, the formula in G5 is:
=PERCENTILE(scores,E5)
where “scores” is the named range C5:C14.
Note: Microsoft classifies PERCENTILE as a “compatibility function”, now replaced by the PERCENTILE.INC function.
Percentile IF in tableThis formula sits inside a small summary table with percentile values in column F and gender values in G4 and H4. Working from the inside out, the IF function is set up like this: IF(Table[Gender]=G$4,Table[Score…Excel SMALL Function
The Excel SMALL function returns numeric values based on their position in a list ranked by value. In other words, it can retrive “nth smallest” values – 1st smallest value, 2nd smallest value, 3rd smallest value, etc.
Excel LARGE Function
The Excel LARGE function returns numeric values based on their position in a list when sorted by value. In other words, it can retrieve “nth largest” values – 1st largest value, 2nd largest value, 3rd largest value, etc.
Excel RANK Function
The Excel RANK function returns the rank of a numeric value when compared to a list of other numeric values. RANK can rank values from largest to smallest (i.e. top sales) as well as smallest to largest (i.e. fastest time).
PERCENTILE function
Excel for Microsoft 365 Excel for Microsoft 365 for Mac Excel for the web Excel 2019
More…
Returns the k-th percentile of values in a range. You can use this function to establish a threshold of acceptance. For example, you can decide to examine candidates who score above the 90th percentile.
Important:
This function has been replaced with one or more new functions that may provide improved accuracy and whose names better reflect their usage. Although this function is still available for backward compatibility, you should consider using the new functions from now on, because this function may not be available in future versions of Excel.
For more information about the new functions, see PERCENTILE.EXC function and PERCENTILE.INC function.
Syntax
PERCENTILE(array,k)
The PERCENTILE function syntax has the following arguments:
array Required. The array or range of data that defines relative standing.
k Required. The percentile value in the range 0..1, inclusive.
Remarks
If k is non-numeric, PERCENTILE returns the #VALUE! error value.
If k is < 0 or if k > 1, PERCENTILE returns the #NUM! error value.
If k is not a multiple of 1/(n – 1), PERCENTILE interpolates to determine the value at the k-th percentile.
What is the PERCENTILE Function?
The PERCENTILE function is categorized under Excel Statistical functions. PERCENTILE will return the k-th percentile of the values in a particular range.
In corporate finance, we can use the function to analyze, for example, the number of employees who scored above a certain percentile on a test.
In MS Excel 2010, the PERCENTILE function was replaced by the PERCENTILE.INC function. However, PERCENTILE is still available in current versions of Excel (stored in the list of compatibility functions).
Formula
=PERCENTILE(array,k)
The PERCENTILE function uses the following arguments:
Array (required argument) – This is the array or range of data that defines the relative standing.
k (required argument) – The percentile value in the range 0…1, inclusive.
How to use the PERCENTILE Function in Excel?
As a worksheet function, PERCENTILE can be entered as part of a formula in a cell of a worksheet.
Percentage
In mathematics, a percentage (from Latin per centum “by a hundred”) is a number or ratio expressed as a fraction of 100. It is often denoted using the percent sign, “%”,[1][2] although the abbreviations “pct.”, “pct” and sometimes “pc” are also used.[3] A percentage is a dimensionless number (pure number); it has no unit of measurement.
Examples
For example, 45% (read as “forty-five percent”) is equal to the fraction 45/100, the ratio 45:55 (or 45:100 when comparing to the total rather than the other portion), or 0.45. Percentages are often used to express a proportionate part of a total.
(Similarly, one can also express a number as a fraction of 1000, using the term “per mille” or the symbol “‰”.)
Example 1
If 50% of the total number of students in the class are male, that means that 50 out of every 100 students are male. If there are 500 students, then 250 of them are male.
Example 2
An increase of $0.15 on a price of $2.50 is an increase by a fraction of 0.15/2.50 = 0.06. Expressed as a percentage, this is a 6% increase.
While many percentage values are between 0 and 100, there is no mathematical restriction and percentages may take on other values.[4] For example, it is common to refer to 111% or −35%, especially for percent changes and comparisons.
resource: wikipedia
A few notes about the PERCENTILE function:
#NUM! error – Occurs if either:
#VALUE! error – Occurs if the supplied value of k is non-numeric.
If k is not a multiple of 1/(n – 1), PERCENTILE interpolates to determine the value at the k-th percentile.
The supplied value of k is less than 0 or greater than 1.
The supplied array is empty.
Random Posts
what percent of alcohol is in corona beer
what percentage of the earth’s freshwater is available for drinking
how much alcohol percentage is in white claw
how do you work out percentages on iphone calculator
smirnoff bottle alcohol content
PERCENTILE in Excel
For Percentile calculation, we have a function in excel with the same name. Percentile function is used for calculating the nth percentile of any set of values below, which given the percentage of observations of the selected set of values, falls. Suppose we have 10 numbers, for which we calculate percentile at 5th value, then we will get the percentile below selected Kth value.
Difference between Percentile & percentage function
Percentage function
The exam reflects how well you have done in the exam as an individual; the percentage score is calculated on the basis of the below-mentioned formula.
Percentage = Marks scored/Total score x 100 e.g. If marks are 80, 80/100 x 100 = 80%
Excel Percentile Function
Percentile is a measure of your performance relative to others; it depends on the other students’ scores also.
Percentile = Number of students scored less than you/Total number of students x 100
Suppose, if your score or marks is 60th, out of 100 students, that means your score is better than 60 people, and hence your percentile is 60%ile. Here it indicates what percent of students you are ahead of, including yourself.
0 notes
Text
Download Crack App For Mac

MacOS Mojave 10.14 (14018) App Store File Download MacBooster 6.0.1 – Maintains and optimizes your system RightFont 5.2.3 – Manage and find fonts quickly. Wondershare Filmora9 (Filmora Version 9 for Windows, Mac) is an easy and powerful video editing software to edit & personalize videos with rich music, text, filter, element. Download Filmora9 and try.
Microsoft Office 2020 Crack For Windows 10, Mac & Android
Microsoft Office Crack is a set of many software. It has a lot of software of many kinds. And the MS Office has all the software that you will need to manage your office work. The first version of MS Office had three software. There were MS Word, MS Excel, and MS PowerPoint. And with time more software came in it. And it got better with each new software. So, it has all the software that you need. And you can use it to manage all your work. So, if you are an office worker or a student. Microsoft Office Free will help you to manage your work.
When you install Microsoft Office 360 you get a lot of software. And all these software have a lot of features. It gives support for all platforms. So, this makes it a cross-platform software. In the desktop version, you can run it on Windows and Mac OS. And it also has a version for mobile devices. As well as you can use it in the online version. Hence, it is a full set of Apps. Which you can use on all devices and platform. So, start using Microsoft Office Download. And start to manage all your work like a Pro.
The Microsoft Office Suite has a lot of software and Apps. The details of some of them are as follows:

Microsoft Word (aka MS Word)
MS Word is the most popular software of all office suite. It lets you type office pages in a better way. You can use this software of Microsoft Office For Windows 10 to format your text. Change the font of the text. As well as add styles to the text. So, it is a very robust software. Thus, you can make a table of contents with it. Insert images and clipart with it. It gives a lot of free templates. And you can use them to quickly start your work. Hence, it has a lot of features in it. So, you can change the font of the text. Make tables with it. Give headings in the text, as well as insert shapes. Change the layout of the text. And print all of it or some part of it. Hence, Microsoft Office Free Download today and improve your work.
Microsoft Excel (aka MS Excel)
MS Excel is a spreadsheet program. You can use it to manage the accounts. As well as doing math tasks. This software of Microsoft Office For Mac as a lot of features. So, if it is a simple math problem or a complex one. It is able to help you solve it. It consists of rows and columns of cells. You can add data to these cells. And perform math functions on them. There are a lot of math formulas added in the software. And you can use any of them just by clicking on any it. Thus, you can add filters to your data. So, this will help you to find the info you want. Add data to the cells and do the math on that data. Such as adding the numbers and many more. Hence, Microsoft Office Torrent helps you to manage your data in an easy way.
Microsoft PowerPoint:
It is also a robust software of Microsoft Office Full Version Free Download. So, you can use it to make slides with it. It has a lot of per set templates in it. And you can use them to quickly start your work. It the software of Microsoft Office Key. And you can use it to make Pro-level slides. And after you make these slides you can show them to the world. It makes you able to zoom-in to the slides. As well as many other things. Thus, Microsoft Office APK is the best suite of software because of its features.

The above review of Microsoft Office Keygen gives details of its apps. Hence, it has a lot other app and tools. So, these tools and apps make it a feature-rich software. Thus, it supports all the platforms. So, this makes it a cross-platform software. Hence, you can use it on mobile devices as well. Thus, you can use Microsoft Office Online on all devices. You can download CleanMyPC Crack here.
Microsoft Office Crack Features:
Format Font:
In all the apps of Microsoft Office Live. You can change the format of the font. So, you can add colors to the font. Change the size of it as well. So, giving style is very easy. Thus, align the text on the page. Add line space on the text. So, you can make a lot of change to the text.
Copy Formats:
There is a feature in Microsoft Office Crack called Format Painter. So, this allows you to copy the all the formats of the text and apply it to the other text. Just select the text with a format that you want to copy. And click on format painter on the top left corner of the interface. And then select the text with the cursor. It will apply the formats to that text.
Print:
You can print all your work with Microsoft Office Crack. Go to the print menu and select the options. And print your work. You can make a lot of changes while printing. As well as preview it before you print.
Secure Files:
When you save your work with Microsoft Office Live. You can secure it with a password. This way other people will not be able to edit your work. You can secure your work at many levels.
File Types:
There are a lot of file types that Microsoft Office Crack supports. So, you can save all your work in many file formats.
AutoSave:
There is a very robust feature in Microsoft Office APK. The name of the feature is AutoSave. It saves your work on its own. So, if the software is closed for some reason you will be able to bring back all your work. This is a very handy feature.
What’s new in Microsoft Office 2020 16.19.0 Crack?
Easy to save all your work on local storage as well as on cloud storage.
Correct your typing errors in an easy way.
You can install an add-on to a lot of app for better features.
A lot of programs in the suite make it a must-have the software.
Uses very small system resources.
The interface is very easy to use.
Design your work with a lot of pre-added tools.
Make good looking slide in a few clicks.
Manage lots of data with a spreadsheet
System Requirements:
AMD or Intel GHz CPU.
2 GB RAM.
3 GB of free disk space.
How to install Microsoft Office Crack?
Use the link given below to download Microsoft Office Setup.
Now run the setup to start Microsoft Office Install process.
Close the program to start the crack
Copy the files from the crack
Now paste these files in the install folder.
All Done. Microsoft Office Crack is ready to use.
Enjoy!
This is the first Microsoft Office system that will be able to play on all operating systems supported by the same. It does load up with several incredible features to make it more co-operative-ready and consumer-friendly. Is not the first version, it has a tool for sharing and collaboration. Users can work with others in presentations, documents and spreadsheets. Microsoft has made some changes to our premium version, the Microsoft Office Product Key. Some features are just a small step from office2016, but there are still a lot of developments and improvements aimed at attracting users ‘ attention.
Related
October 1, 2020
SPSS Crack Latest Version Setup with License Key Download
Are you in search of SPSS Crack for version 26.0? Want to use all the interesting features of SPSS for free? You can use SPSS for free just for 14 days. But to use it for the lifetime, you can use SPSS crack from our website. On this page, there is a download link to the setup file of SPSS, its crack and detailed description on how to install the crack version of SPSS. You will find SPSS crack download file, that works as SPSS mac crack and Windows.
What Does SPSS Do?
Statistical Package for the Social Sciences (SPSS) is basically used by the professionals and researchers who deal with statistics. In the past, researchers had to deal with the large statistics by hand. But now the developers have made it easy for the researchers to tackle with a large number of statistics. Moreover, this software makes it easier for researchers to study statistics. Many organizations are using this software as it helps them in improving their performance.
IBM SPSS Statistics 26 Crack is a complete software package for statistical analysis. It covers the complete review process from planning to data collection, from data collection to analysis, reporting and results. It has various modules fully integrated. With the help of these modules, users can find solutions to increase revenue, stay ahead of competitors and conduct better and more detailed research, which ultimately helps to make better informed decisions.
IBM SPSS Statistics Crack is full of many powerful analysis techniques that enable users to gain incredible insights into their data. This method is also very time-saving, so using this software can make the whole analysis process better and faster. It enables users to gain valuable and deeper insights by analyzing large and complex data sets. Users can also view the relationship between different data sets by observing and analyzing trends.
IBM SPSS Full Crack 26 Mac Incl License Keys Code For [32+64]bit
Investigating someone’s fraud is an important part of the business, and it allows you to avoid paying attention to the investments that may be paid and which investments will be in trouble and become stupid. You can also discover various groups and learn how to interact with certain groups. You can also use the software to predict future trends and put your business in front of a customer base that can easily make money.
IBM SPSS 26 Crack Statistics is a comprehensive, easy-to-use business user, analyst and statistical programmer. For more than 50 years, organizations of all types have relied on IBM SPSS Statistics to increase revenue, conduct research and surpass competitors to make better decisions.
New Features in SPSS Version 26.0:
The latest version of SPSS helps the user in the following ways in addition to prior features. We have also got AutoCAD 2019 Cracked Setup for Windows & Macclick to get it free.
Youtube App For Mac Download
You can create attractive and modern charts and can edit them in MS office.
Easily extend your analysis of statistics with the amazing new updates in this version 25.0.
You can write, edit, and format syntax faster with Syntax Editor shortcuts.
Why Use SPSS Crack?
Price of this software in the market is very high. This software is out of reach for a common man. You can save $79 US Dollars per month and almost $948 US Dollars per year by using our tested SPSS Crack. You can avail our SPSS License Code free of cost.
Free App Download For Mac
How To Install SPSS Crack Version 26.0?
In the start, you can use a trial version which lasts for 14 days. After that, the user cannot use it without buying the software. However, you can use the SPSS Crack download version 25.0 which is available on this page. Our crack is a small patch file which you have to download from our site which will unlock the full premium version for you. Follow below-mentioned instructions to install it.
Download the patch file from our website.
After downloading, Run the downloaded patch.
After completing the installation process of the patch file, open your SPSS file and go to the registration tab.
It will ask for a License code to register.
Finally, we are providing you the license code FREE. Enter the following IBM SPSS License code to activate for free.
IBM SPSS Statistics 26 License Code
ZQ2A3-WSXE4-DC5R-FV6TB-GY8H
NUBGY-7TFVD-CE4SX-Z3AW-Z4SEX
D5CRT-FV7B8-HYNU9-8BGT-FV6E4
XSAZ3-W4ESX-DCRTV-7B8H-YUN9I
J8HUB-Y7C5R-E4XZS-X5DC-RTV7B
Y8NH-U98BY-7TV6C-5RXE4-S5DR
C6TFV-B8YHU-9IJMK-OWE-SRDCT
Download Crack App For Mac Windows 10
System Compatibility for SPSS Version 26.0:
Your system should be 64bit for better performance, however, it can also run on a 32bit system.
This software can be installed on Windows, Mac OS as well as on Linux.
There should be at least 800MB free space in your drive.
Your system should have at least 1GB of RAM.
Your VGA should be minimum 800×600 or of higher resolution.
Web Browser internet 7 or 8, Chrome, Firefox etc. must be installed.
Free Apps For Mac
Download and Share:
0 notes
Text
Download Microsoft Office Portable For Mac

Microsoft Office 2019 for Mac Key Features. The innovative Design tab gives prompt access. Tip: The 64-bit version is installed by default unless Office detects you already have a 32-bit version of Office (or a stand-alone Office app such as Project or Visio) installed.In this case, the 32-bit version of Office will be installed instead. To change from a 32-bit version to a 64-bit version or vice versa, you need to uninstall Office first (including any stand-alone Office apps you. Cross-platform Office Suite. WPS Office for Mac. Dark mode, split screen and Handoff. Download and get free templates. Make your report cooler. Make students love your class. Reduce the workload. An easier way to start work. High Compatibility High compatibility with Microsoft Office, Google Docs, Adobe PDF. Start quickly with the most recent versions of Word, Excel, PowerPoint, Outlook, OneNote and OneDrive —combining the familiarity of Office and the unique Mac features you love. Work online or offline, on your own or with others in real time—whatever works for what you’re doing. Amazon.com: download office for mac. Skip to main content. Try Prime All Go Search EN Hello, Sign in Account & Lists Sign in Account & Lists Orders Try Prime Cart. Today's Deals Your Amazon.com.
Jean updated on May 24, 2019 to PC Transfer|How-to Articles
Q: 'Can I save the Microsoft Office installation to an external hard drive and run the application from it? I have a laptop with a solid state drive of 30GB memory. Microsoft Office has installed on the system, taking considerable disk space. I am wondering if it could be uninstalled from the laptop and installed on an external hard drive.'
Assuming that there are two situations in which users would request an Office copy, move or transfer to a portable drive, one is when to choose an external drive for download and install, and the other one is to change the location of an existing installation from a PC to an external drive.
Are both scenarios working in the same way? Not necessarily.
A: 'When you install software it will create registry items within the Windows folders, which are on the main drive, usually the C drive. So, if you want to be able to run Office on different computers via the external hard drive, it may fail due to the lack of essential registry contents, unless using a professional PC transfer software for help.'
'What's more, Microsoft would have to provide a portable version, which we don't think they have.'
Download Microsoft Office Portable For Mac Download
How to Transfer Microsoft Office to an External Hard Drive or a USB Drive
So, if you wish to save disk space by installing the large-size Microsoft Office 2003, 2007, 2010, 2013, 2016 and Office 365, to somewhere else other than the local drive, and be able to run an application from an external drive, make it happen in the other way.
Use the normal way to completely download and install the desired Office version on your computer.
Transfer the whole installation from the PC storage to the wanted place via EaseUS Todo PCTrans.
Uninstall the Office from your computer in the control panel > programs > uninstall a program.
In the end, open and run the Office application whenever you need by connecting the external drive to your computer.
Here is how to start the Office transfer from a PC to an external hard drive/USB drive:
First, download and install EaseUS Todo PCTrans. (Click the download button on your PC, where the Microsoft Office is installed. EaseUS transfer software is very light and small. You can quickly install it in a few seconds.)
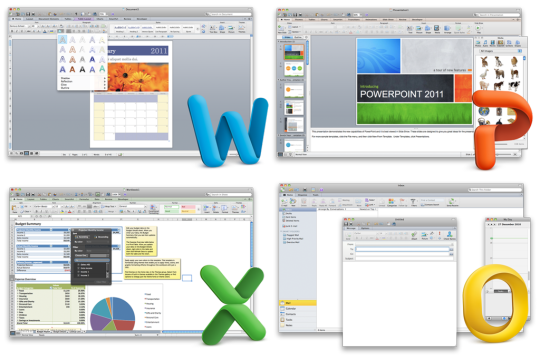
Then, move your MS Office to the external storage device:
Step 1. Connect the external device and select the transfer mode.
Connect your external storage device (external hard drive, USB, SD card, and more) to your PC.
Launch EaseUS Todo PCTrans and go to 'App Migration' > 'Start'.
Step 2. Select Microsoft Office and set the storage path.
Select the drive where you have installed Microsoft Office on and select Microsoft Office.
Click 'Browse' and choose to transfer the application to your external storage device.
Click 'Transfer' to start transferring Microsoft Office to an external storage medium.
Step 3. Wait for the transfer process to finish.
Wait patiently for the process to complete.
Click 'OK' when it has done.
Additional help for you to manage the Microsoft installation location:
Anyway, don't take the Office transfer too easy to copy the download files to a portable drive. It doesn't work because you cannot move the registry components.
Download Microsoft Office Portable For Mac Os
EaseUS Todo PCTrans can do more in transferring applications, files and folders, and even user accounts between multiple computers using the network connection and an image file. Click for more tutorials if you're interested in other possible ways to place the Office to anywhere you want.
Microsoft Office for Mac 16.29 v2019 Serial Key
Office 2019 for Mac Serial key is developed from the elegant ground up to take benefit of the latest features of Mac. all the documentation and projects including Excel, Powerpoint, Outlook, Onenote, and Word are impossible without the Microsoft office. If you love your work and want to be a professional user then you must have the office 2019 Suite.
Microsoft Office 2019 for Mac 16.29 License key avails you to take the advantages of the latest features Which are Retina display, full-screen view support, and even scroll bounce? It’s the perfect combination of the Office.
Versatile User Oriented Interface
The application has the awesome user interface which is very helpful in the use of the latest features of the office suite 2019. It gives you the smart work facility within less time.
Microsoft Office 2019 for Mac Key Features
Word
The innovative Design tab gives prompt access to features, and Smart Lookup shows relevant contextual information from the web directly inside Word. Create and share professional-looking documents with state-of-the-art editing, reviewing, and sharing tools.
Excel
Leverage features like Analysis Toolpak, Slicers, and Formula Builder to save time, so you can focus on insights. Analyze and visualize your data in new and intuitive ways with a fresh user interface plus your favorite keyboard shortcuts.
PowerPoint
Build, collaborate, and effectively present your designs with new slide transitions and an upgraded Animations task pane. Threaded comments alongside your slides help you incorporate feedback into your presentations, And Presenter View displays the current slide, next slide, speaker notes, and a timer on your Mac while projecting only the presentation to your audience on the big screen.
OneNote
Whether you’re at home, in the office, or on the move, you can take it all with you wherever you go while sharing and collaborating with others. It’s great for school assignments, work projects, travel plans, party planning, and more. It’s your very own digital notebook, so you can keep notes, ideas, web pages, photos, even audio and video all in one place.
Outlook
Easily manage your email, calendar, contacts, and tasks. Push email support keeps your inbox up to date, conversation view groups related messages, and calendars can be viewed side-by-side for planning.
Microsoft Office Mac Download
System Requirements For Registration Number
Microsoft Office Free Download Mac
Mac computer with an Intel processor
Mac OS X version 10.10
Hard disk formatting such as HFS + (also known as Mac OS Extended or HFS Plus)
A monitor with 1280×800 resolution or higher
Recommended Safari 7
Recommended 1 GB of RAM
5,62 GB of free hard disk space
Microsoft Office Suite For Mac Download
How To install and register Microsoft Office 2019 Mac?
Download the setup file for installation.
Install the application.
Download the crack file.
Go to the program files in the operating system usually in C Drive and copy the crack file into the downloaded program.
Open the application.
Click on registration.
All Done, ENJOY!
Can You Download Microsoft Office For Mac
0 notes
Link
MS Excel Basics For Beginners | MS Excel From Beginner To Advance Levels

MS Excel is the most powerful tool to manage and analyze various types of Data. Gurukul of Civil Engineers covers different courses for the students such as MS Excel basics for beginners, MS Excel from Beginner to advance Levels, MS Excel Online Course, MS Excel Basic Course, etc. Here we explain how to use various Excel formulas, Tables, and Charts for managing small to large scale business process.
#MS Excel from Beginner to advance Levels#MS Excel Basic Course#ms excel online course#MS Excel basics tutorials#MS Excel Basics For Beginners
0 notes
Text
Manufacturing Cleaning And Chemical Products
New Post has been published on https://autotraffixpro.app/allenmendezsr/manufacturing-cleaning-and-chemical-products/
Manufacturing Cleaning And Chemical Products

Buy Now


Imagine yourself becoming filthy rich with a dirt cheap investment, selling cleaning products.
There are so many “how to’s”, formulas and recipes for manufacturing cleaning and chemical products, green cleaning goodies, bath soap and carpet shampoo, it seems an overwhelming and daunting task to find the best solution.
NOT ANY MORE!
Learn the secrets no cleaning and chemical manufacturing company wants you to know … How to manufacture detergents, cleaners and chemical products at low, low prices and sell with mark-ups of up to 500%!
The large international producers of cleaners, detergents and chemical products are amongst the richest industries in the world – and they just keep getting richer. Between a handful of them they maintain a monopoly on a massive multi-billion dollar industry. Just think of BASF, Unilever, Dow Chemicals and Shell Chemicals.
A study conducted by the Boston Consulting Group in Germany in 2009, found that the global consumption of chemical products in 2008 exceeded 1.9 trillion Euros.
This is an amazing 3.5% of the whole world’s economic activity.
Why?
Manufacturing detergents and chemical cleaning products is one of the most profitable industries in the world.
You are about to discover some of the most tightly kept secrets of this industry – how you can easily manufacture a huge range of popular high quality household, commercial and industrial detergents and chemical cleaning products.
In fact, with our formulas you can manufacture all of the the most profitable cleaning and detergent products – from dishwashing liquids, laundry detergents, window cleaners, heavy duty degreasers, floor cleaners, carpet cleaners and many more – all from your own home, garage, or any location you choose, safely and easily, without any special equipment, and no knowledge of chemical science.
With 12 years of experience in the chemical manufacturing industry, we have accumulated 126 of the world’s best formulas for manufacturing chemical and cleaning products for:
Car wash / auto care and cleaning.
Fabric and clothing care and cleaning.
Household and kitchen cleaning and maintenance.
Industrial cleaning and maintenance.
These are excellent, one of a kind books in a low risk, high profit industry, easy to get started with… AND you won’t find this information anywhere else. Not on the internet, in a library, or in a bookstore!
These books are written in layman’s language and you can benefit immediately from them.
Start up costs are low. You can jump start your business with a very small investment.
Products are easy to manufacture, but extremely powerful.
Raw materials are readily available anywhere from international chemical suppliers.
Your products cannot be copied. The secret is in your book of formulas.
It is a sound business, with unlimited growth potential.
The market will never be saturated.
After your initial start-up, you only replace what you use.
You sell your products at your own convenience.
This industry is one of the most profitable on the planet.
Our books on the Manufacturing of Cleaning and Chemical Products is the result of experience gained over a period of twelve years in the chemical industry, accumulating, manufacturing and testing different formulas to produce only the highest quality products which can compete with any other manufactured product.
These are the same products as those used every day, world wide, in all industries, households, factories, offices, public buildings, hospitals, schools and, in fact, anywhere you can think of.
Just imagine what you are capable of, having 126 formulas accumulated over many years of research and practice, with which you can immediately start producing and selling your own cleaning products to friends, family and businesses like:
Detergent and Cleaning Product Resellers.
The Automobile / Car Wash Industry.
Mining and Engineering.
Hotels and Hospitality Industry.
Food and Beverage Suppliers.
Hospitals and Veterinary Clinics.
Schools and Kindergartens.
Contract Cleaning Businesses.
Industrial Laundries and Launderettes.
Office and Workshop Cleaning.
Household and Kitchen Cleaning.
Floor, Tile and Window Care.
Coach and Truck Wash Bays.
This unprecedented collection contains extensive product formulas, plus invaluable resources, information and advice on branding, packaging, marketing and more!
Soap and carpet cleaning product recipes are easy to find for free on the internet, but you’ll NEVER find anything like this collection of cleaning and chemical formulas that has taken years of practice and experience and countless hours to compile, edit and produce.
So what would you pay for a sure fire way to make yourself rich? $1000.00? Even more? We’re now selling the whole book for the bargain price of only $199.00 $140.00.
However, we’ve made it as easy as we possibly can for you to start making money immediately.
How about less than $50.00 $40.00
We’re selling the four books separately so that you can start with a specific product range and purchase the rest of the formulas later when you are ready to grow your manufacturing business:

Auto Wash and Care Product Manufacturing.
Household and Kitchen Product Manufacturing.
Fabric and Clothing Care Product Manufacturing.
Industrial Cleaning and Chemical Product Manufacturing.
at the very affordable discount price of $48.00 less then $40.00 and as low as $29.95 for each section.
Buy one book and get the other at half price!
New combined versions for as little as $60.00 $45.00
We have combined Auto Wash and Care Products ($29.95) with Fabrice Care Products ($29.95) and Industrial Cleaning Products ($39.95) with Household and Kitchen Products ($39.95).
Buy the combined version of Auto and Fabric Care Products for only $44.95 instead of the normal price of almost $60.00.
Buy the combined version of Household, Kitchen and Industrial Cleaning Products for only $59.95 instead of the normal price of almost $80.00.

More information on the combined product formulas is available on each product page.
Price reduced from $29.00 to $19.95!

Examples of Detergent and Cleaning Product Formulas
Here are some examples of the products you can manufacture and sell for enormous profits, but still at a lower price than the products available on your supermarket or wholesaler shelves.
Auto Wash & Care Product Now selling for only $29.95
Car shampoo.
Car wash & wax.
Dashboard gloss.
Anti fogging glass cleaner.
Insect remover.
Pre-wash traffic film remover.
Jet wash spray wax.
Tire and bumper shine.
Our Auto Care products have been formulated to replace all other products used in the Auto, Coach and Truck cleaning industry, at a fraction of the cost of the presently used ones.
Kitchen Products.
Fat removers.
Oven cleaners.
Floor Cleaners.
Liquid dishwashing detergents.
Anti bacterial dishwashing paste.
Scouring cleaner.
Floor tile mop and shine.
Floor polish.
Other Household Products. Now reduced from $48.00 to only $39.95
Liquid hand soap.
Beauty soap.
Hair shampoo.
Window cleaner.
Household bleach.
Universal cleaner.
Air freshener.
Toilet bowl detergents and cleaners.
Pure pine disinfectant.
Liquid furniture polish.
Tile and household cleaners.
Most of the above products can also be manufactured with anti-bacterial ingredients, or germicides, sanitizers / disinfectants, as well as stronger and more multi purpose ingredients. All the formulas are in the book.
Fabric and Clothing Care. Now selling for only $29.95
Liquid laundry detergent.
Pre-soakers.
Pre-wash lotion.
Normal fabric softener.
Fast dry fabric softener.
Easy iron fabric softener.
Fibre care fabric softener.
Spot remover.
Wool washing liquid.
These products have also been formulated to be manufactured with anti bacterial ingredients, for the safety of children and people with certain skin allergies.
Industrial Chemical Products. Now reduced from $48.00 to only $39.95
Universal cleaner.
Acidic public bathroom and toilet disinfectant and cleaner.
D-limonene based graffiti cleaner, fat remover, grease trap cleaner, etc .
Soap scum remover.
Machine floor scrubber.
Wall cleaner.
Drain cleaner.
Cement concrete and brick cleaner.
Light, heavy and extra heavy duty degreaser.
All of the above mentioned products are still only about one third of the formulas contained in the book, so, as you can see, if you or anyone else you know, needs a product, you’ll find in in the book.
All the raw materials you need to start your own production are readily available from chemical suppliers world wide.
But it doesn’t stop here…
If you buy this book we want you to succeed in your new business venture. We have therefore bundled the book with these FREE BONUS GIFTS to help you get started fast and make money immediately.
Bonus gift # 1:
A business plan and profile template in MS Word where you just fill in the blanks, to help you get a head start by having a proper business plan.
Bonus gift # 2:
A start-up expense report template in Excel to help you work out start-up costs.
Bonus gift # 3:
An expense report template in Excel, where all your business expenses can be recorded and updated easily.
Bonus gift # 4:
A customer management list template in Excel, where you keep complete records of all your clients.
Bonus gift # 5:
A fixed asset register template in Excel with three types of depreciation formulas.
Bonus gift # 6:
A checkbook register template in Excel where you can record all the checks, cash or electronic payments you make.
Bonus gift # 7:
A mortgage amortization schedule template in Excel, if you need to make a loan, you can work out the terms and repayments you have to make.
Bonus gift # 8:
A vehicle service record template in Excel, where you have a record of all your vehicle expenses.
Bonus gift # 9:
A costing and cash flow template in Excel to do your costing, work out your gross and net profit and project it in a monthly cash flow scenario.
Bonus gift # 10:
A 12 month profit and loss projection template in Excel to work out your net profit, or loss, and project it on a monthly basis.
Bonus gift # 11:
A 1 Year sales forecast template in Excel to project your existing sales forward for 12 months.

Your satisfaction is 100% guaranteed. If, within 60 days, you have not made any money from any of our formulas you may request a 100% refund – no questions asked. We’re not worried because we know these books can make you rich if you seriously make use of it.
So, the risk is all on us. Order your copy of a section of Cleaning and Chemical Product Manufacturing today from Clickbank here and you can immediately download it and start your new business
from the ClickBank® Secure Server

and paying by any of the following means

Two things to remember:
We have tried to put all the information on these products on our website, but in all the books we have a lot more explanations of raw materials and products. If there is still something you need more information on, please email me, tommeintjes at mweb.co.za, with your questions.
tommeintjes at mweb.co.za is my personal and only email address and I don’t like receiving spam, as I think you do too, therefore your email to me is treated as privileged information.
CLICKBANK® is a registered trademark of Click Sales, Inc. and used by permission. TM Marketing is not an authorized agent or representative of Click Sales, Inc. Click Sales, Inc. has not reviewed, approved or endorsed our products, or any claim, statement or opinion made by ourselves or our products.
0 notes
Text
Professor Jonathan Crane has a very interesting encounter with one of his students, a Miss Harleen Quinzel, who is much more than she appears (AO3 link at bottom)
Keeping his voice as even as possible, Jonathan swept his eyes slowly across the lecture hall as he posed his question.
“Can anyone see the flaw in Mr. Lloyds' hypothesis?” Total silence met him as each student valiantly fought to avoid his eye lest they be chosen to answer him. “No one at all? I am disap-”
“He had failed to account for the inclusion of environmental factors which may add bias to the results. His decision to host the questionnaire within a cramped, dark office space may create anxiety within the participant and skew the results.”
As the female voice rang out confidently across the room, Jonathan raised an eyebrow. Impressive. She had picked up the obvious issue and had been able to explain it perfectly. Seeking out the source of the voice, his eyes met a young blonde woman who sat a few rows from the front.
“Correct, Ms?”
“Quinzel.” The woman smiled pleasantly as he focused on her.
Wanting to further test her, he pushed his glasses back up his nose and continued.
“And how could this bias be eliminated?”
“The questionnaire could be presented to the participant within a more open space which may eliminate some anxiety but it is impossible to completely eliminate the bias as we have no knowledge of what fears the participants may already possess.”
“Excellent!” Giving a rare smile, Jonthan nodded at her. “Now, you are all required to take note of Ms. Quinzels' observation and I would like each student here to discover at least two other issues which could arise from Mr. Lloyds' method. We will discuss your findings on Wednesday.”
Walking back behind his small podium, Jonathan clicked the small laptop to bring up the next screen of the powerpoint.
“Now, as you can see -”
x-x-x-x-x
The remainder of the lesson continued on in regular fashion, with the majority of students putting in the minimal effort while their desperate eyes darted to and from the large clock which would signal their freedom.
Before long, the shrill cry of the bell announced that the lesson was over and the quiet auditorium erupted with noise as bags were ripped open and chairs were vacated. Sighing, Jonathan walked to the other side of his small table and took his seat again, ignoring the class as they left. He had no more lectures until the late afternoon which gave him some time to finish marking the rest of the lab reports which he had collected earlier in the week.
Leaning over the desk, his pen was poised over the paper when a soft cough grabbed his attention.
Glancing up, he realised that he was not alone.
“Miss Quinzel!?” He exclaimed as the blonde stood confidently before him, “Would you like to speak with me?” He gestured to the empty chair which sat on the opposite side of the desk.
Smiling at him, she slid into the seat.
“Sure, Doc.”
Returning her smile, with a small one of his own, Jonathan corrected her.
“I prefer Professor.”
“Sure, Professor.”
“So what can I do for you, Miss Quinzel?”
“Call me Harley, everyone does.”
“What can I help you with, Harley?”
“Can I just say, Professor, that you are one of my favourite lecturers here,” Harley began, her voice full of praise, “and it was your lecture last year on the development of phobias in the modern world that inspired me to take this class.”
“I am pleased to hear that.”
“You were also the lecturer who stuck up for me that one time I almost got suspended and I always wanted to say thank you for it.”
Hmm. He had never seen this women before today and any memory of having assisted her was not coming to him.
“I did? I must apologise because I cannot reca-”
“It was early last year,” Harley elaborated, “and I almost got suspended cause some creep tried to put his hands on me in my social class and I knocked him out with a very hard punch. Your signature was on the bottom of the sheet which said I was allowed to stay at the university.”
A memory hit him and he nodded in recognition, giving her a simple explanation.
“I do not like bullies.”
Recalling the incident, he also remembered a little bit more about the woman before him. She had been one of the few to receive a full athletic scholarship into the university. For gymnastics, he was sure. At the time of the incident she had been in the top third of her class and if her work today was any indication she was still excelling.
His thoughts were interrupted as Harley spoke again.
“I actually have a favour to ask of you, Professor Crane.” Her voice was still friendly but the lightness of it caused his interest to perk.
“Yes?”
Placing his hands on the desk, he cursed silently as he accidentally knocked his pen off the edge. As he bent down to retrieve it he amused himself with considering what kind of favour she could need. Most likely an extension on a deadline. Students these days had no respect for deadlines.
Pulling himself upright and placing his hands on the desk again, he was surprised to notice that Harley had not appeared to have moved a single inch.
And yet the top button of her blouse had come undone.
Refraining from rolling his eyes and a little disappointed with her actions, he sat silently as he waited for her to continue.
“I was planning on interning at Arkham over the coming summer and I would love it if you gave me a recommendation, Doctor Crane.” Still as happy as ever, she even went so far as to bat her eyelashes at him.
Setting his mouth in a straight line, Jonathan shook his head as he glanced back at his papers.
“I do not have that kind of power, Miss Quinzel.”
Her body leaned forward enough to force Jonathan to look at her and when his gaze locked with hers he found himself momentarily caught off-guard at her expression.
Gone was the bubbly attitude and friendly exterior, now replaced by staunch determination which was only overshadowed by a look of pure hunger which he recognised.
Ambition.
With absolutely no trace of an accent, she argued his rejection.
“Yes, you do. When new criminal patients are admitted into the asylum you assist on the majority of their evaluations and I am aware that you host both private and group sessions with patients who have conditions which range from depression to sadistic psychopathy.”
Clearing her throat, she continued.
“Your word would mean a lot to the staff and I know you could get me in the door. My grades are good enough to make me a serious candidate but I want to be certain of a place.”
All thoughts of the lab reports gone from his mind, Jonathan focused fully on her for the first time since she had taken the seat.
“Why?”
“You are notorious for being the final word professionally on phobias and human fear. That is your niche.” She gestured to him with a hand. “I have a very large interest in extreme personalities and Arkham is perfect for me to explore that niche interest.”
She had done her research. The majority of his published works were centered on human phobias and their varying origins. An idea had even come to him recently and he had started a private project which was designed to explore whether or not a chemical compound could be created to stimulate the brain into experiencing fear and anxiety.
Fear was his niche.
“And to what end would you like to explore these personalities?”
Her serious expression disappeared and was quickly replaced with another one of her bright smiles, a smile which did not quite cover the ambition in her eyes.
“I want to help people get better. I want to help these people overcome their illnesses.”
She was lying.
But he did not particularly care.
Arkham was truly full of the worst of humanity and if his private project came to fruition he was hoping to get permission to use some of its criminal inhabitants to volunteer to test the formula.
Considering the woman before him for a minute silently, his instincts were telling him that she bore no genuine ill will towards the patients. She was ambitious, but not dangerous, and if she wanted to experience the fresh hell that was Arkham Asylum then he would not stop her.
She had caught his interest and that was a rare occasion in itself.
So he would do it.
Pushing his glasses back up the bridge of his nose, he gave her a sharp nod.
“I will see what I can do for you, Miss Quinzel. On the condition that you continue to excel in your chosen subjects.”
“Aww thanks Doctah Crane! You're the absolute best!” She exclaimed, clapping her hands together excitedly. “Also, I really hope your meeting with the faculty goes well!”
Again off-footed by the blonde, Jonathan covered his shock and asked.
“How do you know about that?”
“People talk.” She shrugged.
“I am not concerned by my meeting.” He confessed. “I will most likely receive a small disciplinary for my actions, perhaps a week off with no pay, and then I will return to my work immediately.”
“If it makes ya feel any better,” Harley soothed him, “I would have loved to have seen a gun fired in class. It would be really scary but exciting, yeah?” “Not everyone shares your opinion, child.”
“Everyone else is boring.”
Checking her watch, Harley jumped from the seat like it had burned her.
“Sorry Professor, but I need to get to my next class or i'm gonna be late! Thank you again for helping me out.”
“Think nothing of it.” He offered evenly, watching her passively as she practically ran from the auditorium, her shoes clacking against the flooring in her hurry.
As soon as she had disappeared from sight, Jonathan pulled the glasses from his face and sat them down gently top the stack of paper before him.
Miss Quinzel was not prepared for Arkham.
Twisting his mouth, Jonathan estimated that she would last a month at the most before the stress caused her to request a reassignment and he had no doubt that a tell-all, exploitative novel penned by one Dr H. Quinzel exploring the sensationalist world of super criminals would soon find itself on the best sellers list.
But he would fulfil her request and make a recommendation for her internship. He could type up the letter in the early hours of the following morning, just before he started to prepare for his meeting with the faculty board and faced whatever asinine punishment they had in store for him.
With her grades and his influence within the asylum, he had no doubt that she would be accepted. It was a dangerous job but the incarceration of super-criminals such as Victor Fries and the Joker had resulted in the security of the asylum being drastically improved and it was almost impossible for the inmates to physically harm the doctors.
She would be safe from any potential attack and, after all, it was only an internship.
What was the worst that could happen?
AO3 link - http://archiveofourown.org/works/11248272
#jonathan crane#scarecrow#harleen quinzel#harley quinn#gotham rogues#fic#hope ya enjoy guys#if not then i am sorry lmao
38 notes
·
View notes
Text
Load any HTML with Self-Closing Tags & Convert It to Excel File inside Android Apps
What’s new in this release?
Aspose development team is pleased to announce the new release of Aspose.Cells for Android via Java 18.12. Depiction of data through HTML page is very common, however this page can be opened in variety of devices including mobiles, tabs and other hand held devices which contain small screens. The size of the columns is defined in “pt” which works in many cases. However there can be case where this fixed size may not be required. For example if container panel width is 600px where this HTML page is being displayed. In this case users may get horizontal scrollbar if the generated table width is bigger. This requirement is addressed by providing scalable units like em or percent for a better presentation. Empty tags are very common while working with HTML like we can face <td></td> or simply <td/>. Earlier self-closing tags were not supported however now this support is provided. Now users can load any HTML with self-closing tags and convert it to Excel file. Named regions can have English formulae and this file can be used in environments where systems are configured to German Locale. There is need to translate these English formulae completely to German language for correct usage in Excel configured for German language. This feature is fully functional and can be used without any extra coding. Excel provides custom filters like filter rows which begins with and ends with some specific string. Aspose.Cells provides rich features to manage shapes in the spreadsheet. Sometimes there is needed to get the connection points of a shape for aligning or placing the shapes at appropriate place. For this purpose all the connection points are required. Pivot tables are very common reports which are present in the workbooks. These reports are updated time by time and it is important to know the last time when report was updated for better decision making. Aspose.Cells has provided this feature by introducing property RefreshDate. Similarly name of the person who updated the pivot table is also provided as property RefreshedByWho. Smart art is used for better representation of information however earlier the text in the smart art shapes was fixed. This limitation is gone now as now smart art text can be updated. For this purpose shape.setText() function is introduced which sets new text in the smart art shape. Data validation is done in variety of ways to control the input in the Excel file. Like limit can be defined for a cell within which some number can be entered, otherwise error message is raised. Issues were faced for validation of large numbers like 12345678901 etc. in the past but now this much large numbers are supported by Aspose.Cells. Aspose.Cells has introduced rendering active worksheet in a workbook to SVG. For this purpose load an Excel file into workbook object and set the active sheet index like for Sheet2, set index to 1. Then save the Workbook as SVG which will render active worksheet to SVG. Workbook can have multiple sheets which are rendered as multiple tab pages when converted to HTML using Excel. Similarly if a workbook contains single sheet, it shows one tab page when converted to HTML using Excel. This conversion was working fine for multiple sheets while using Aspose.Cells. However for single sheet workbook, there was no tab page and only HTML file was created without creating the separate folder containing CSS. Now Aspose.Cells has enhanced its library to create similar output for single sheet workbooks as compared to output created by Excel. In complex Excel files (XLSM/XSLB) there can be large amount of macros which can be very very long. Many times there is a need to load the workbooks without loading these VBA projects like just extracting the sheet names from loaded workbook. In this case we need a filter which can load VBA projects in when they are actually required. This time Aspose.Cells has introduced a filter option LoadDataFilterOptions.VBA which can be used for this purpose. Textbox is very common control which can be used in a worksheet. This is not necessary that text in the textbox is fixed. It may have tags which can be replaced with some text at runtime. It helps users to configure the controls as per the data on the sheet or from some other source. Worksheet.replace can be used for this purpose and textbox can be set with the desired text. It can convert worksheet to HTML but rendering entire sheet at once may not be required always. Users may require just a selected area of the sheet to be rendered to HTML. Worksheets contain page setup where print area can be set. A worksheet can have different types of validations including dropdown. There can be a need where user may want to detect the type of validation and take some decision based on this information. This release includes plenty of improved features and bug fixes as listed below
Change returned value for getting Connection points
Provide ability to export range as HTML
Data bars are missing when XLSX is converted to HTML
Value still exists when XLSX is converted to HTML
Convert left right ribbon shape to image
Aspose.Cells for Java JavaDocs - missing package-list file
Font is not a valid HTML5 and self-closing tag and web browsers misrepresent its contents
Wrong count of validation values is read from XLSX
Issue while treating consecutive delimiters as distinct
Date format is incorrect for Japanese locale
LightCells API fails to load huge file
An exception(StackOverFlow) raises when saving to PDF output
Wrong value calculated by ROUNDUP()
Copy a range with PasteType.ALL (Paste options) not copying row heights properly
Hyperlink text formatting lost when new text is set
Invalid Russian date format output
Issue with SheetRender fonts
Exception "java.lang.OutOfMemoryError: Java heap space" when rendering MS Excel file to PDF
Quotes appear in formula when retrieving the cell formula via Aspose.Cells
Performance degradation when using conditional formatting
Chart line is missing in XLSX->PNG conversion
Problem with getActualChartSize method
SmartArt doesn't copy when workbook is copied
Text formatting is missing in HTML output of excel range
Icon Sets become misaligned when XLSX is converted to HTML
Exporting named range data is not correctly rendered to HTML (Java)
Named Range Issue
Validation always returns true for 'getInCellDropDown()' method
Wrong culture custom format gets returned for different locales (Germany, French, Italy and Spain)
Excel To PDF conversion - Gauge chart rendering issue
PDF rendition throws OutOfMemoryError exception
Other most recent bug fixes are also included in this release.
Newly added documentation pages and articles
Some new tips and articles have now been added into Aspose.Cells for Android documentation that may guide users briefly how to use Aspose.Cells for performing different tasks like the followings.
Recognise self-closing tags
Get Connection points from shape
Overview: Aspose.Cells for Android
Aspose.Cells for Android is a MS Excel spreadsheet component that allows programmer to develop android applications for reading, writing & manipulate Excel spreadsheets (XLS, XLSX, XLSM, SpreadsheetML, CSV, tab delimited) and HTML file formats without needing to rely on Microsoft Excel. It supports robust formula calculation engine, pivot tables, VBA, workbook encryption, named ranges, custom charts, spreadsheet formatting, drawing objects like images, OLE objects & importing or creating charts.
More about Aspose.Cells for .NET
Homepage of Aspose.Cells for Android
Download Aspose.Cells for Android
Online documentation of Aspose.Cells for Android
#self-closing tags in HTML#update smart art text#Export print area range to HTML#Scalable column width#Custom filter with BeginsWith#Java Android Excel API#Data validation for huge numbers
0 notes
Text
Why Should You Join Advanced Excel Training Course?
This progressed Excel preparing is composed by Drona Training Academy to enable you to end up a fruitful Data Analyst and is very suggested for applicants who are simply beginning their profession in Analytics. This power pressed development Excel course will instruct you how to make canny dashboards, VBA macros, MS-Access and SQL through a solid spotlight on contextual investigations to guarantee hands-on learning. Once furnished with the truly necessary abilities with this progressed Advanced Excel course in Delhi you will likewise take in the ground-breaking Data representation apparatus Tableau to introduce your investigation.
Who should do this course?
Candidates from various quantitative backgrounds like for School/College Going Students, Housewives/Stay-At-Home Mums, Senior Citizen etc. who are not just looking for advance Excel training but also want to learn job oriented Analytics & Reporting skills using MS-Excel, VBA, MS-Access, SQL and Tableau.
Our Advanced Excel Training Course is right now accessible at Delhi, Munirka Center in weekdays or ends of the week. According to monstrous request of learner's. We Guarantee 100% Interview after fruitful culmination of the 70% of Advanced Excel course.
Our Advanced Excel Training Course Programme Modules is following types:-
Introduction to Excel, Basic Understanding Menu and Toolbar, Introduction to different category of functions like Basics, Mathematical and Statistical, Date and Time, Logical, Lookup and References, Text and Information.
Mathematical Functions in Advanced Excel:- Sum, Sumif, Sumifs, Count, Counta, Countblank, Countif, Countifs, Average, Averagea, Averageif, Averageifs, Subtotal, Aggregate, Rand, Randbetween, Roundup, Rounddown, Round, Sumproduct
Date & Time Function in Advanced Excel:- Date, Day, Month, Year, Edate, Eomonth, Networkdays, Workday, Weeknum, Weekday, Hour, Minute, Second, Now, Today, Time
Text Functions & Data Validation in Advanced Excel:- Char, Clean, Code, Concatenate, Find, Search, Substitute, Replace, Len, Right, Left, Mid, Lower, Upper, Proper, Text, Trim, Value, Large, Small Filters (Basic, Advanced, Conditional), Sort (Ascending, Descending, Cell/ Font Color), Conditional Formatting, Data Validation, Group & Ungroup, Data split.
Statistical Function & Other Functions in Advanced Excel:- Isna, Isblank, Iserr, Iseven, Isodd, Islogical, Isytext, Max, Min, Len, Right, Left, Mid, ,Maxa, Maxifs, Median, Minifs, Mina, Vara, Correl, Geomen
Logical Functions in Advanced Excel:- And, Or, If, Iferror, Not, Nested If
Lookup & Reference Functions in Advanced Excel:- VLookup, HLookup, Index, Match, Offset, Indirect, Address, Column, Columns, Row, Rows, Choose, Arrays Concept In Lookup Formula’s, Past Special, Past link
Pivot Table and Charts in Advanced Excel, Import and Export data, Protect/Unprotect sheets/workbooks. Worksheet formatting and Print Display
Data Collection Method in Advanced Excel With Data Quality, Collaboration & Security Like Share Your Workbook On Share Drive With Quality
Analysis Single/Multidimensional Analysis in Advanced Excel, Like Three Dimensional (3D) Tables, Sensitive Analysis Like Data Table, Manual What-If Analysis, Threshold Values, Goal Seek, One-Variable Data Table, Two-Variable Data Table
Enquiry for Corporate Training: 011-41043344 or for more information mail us on- [email protected]
0 notes
Photo

Program Modules
BASIC EXCEL FUNCTIONS
What is Excel?
Microsoft Excel is a general purpose electronic spreadsheet to use to organize, calculate, and analyze data. The task you can complete with Excel ranges from preparing a simple family budget, preparing a purchase order, create an elaborate graph/chart, or managing a complex accounting ledger for a medium size business.READ MORE
Provide Basic/Advanced Understanding of Excel, make user familiar to create formula and give platform to make good analysis and introduce Powerful tools of advance excel so that user can make advance analysis with the help of those tools.
Introduction to Excel, Basic Understanding Menu and Toolbar, Introduction to different category of functions like Basics, Mathematical and Statistical, Date and Time, Logical, Lookup and References, Text and Information.
Mathematical Functions:-
Sum, Sumif, Sumifs, Count, Counta, Countblank, Countif, Countifs, Average, Averagea, Averageif, Averageifs, Subtotal, Aggregate, Rand, Randbetween, Roundup, Rounddown, Round, Sumproduct
Date & Time Function:-
Date, Day, Month, Year, Edate, Eomonth, Networkdays, Workday, Weeknum, Weekday, Hour, Minute, Second, Now, Today, Time
Text Functions & Data Validation :-
Char, Clean, Code, Concatenate, Find, Search, Substitute, Replace, Len, Right, Left, Mid, Lower, Upper, Proper, Text, Trim, Value, Large, Small
Filters (Basic, Advanced, Conditional), Sort (Ascending, Descending, Cell/ Font Color), Conditional Formatting, Data Validation, Group & Ungroup, Data split.
===============
ADVANCED EXCEL FUNCTIONS
Statistical Function & Other Functions :-
Isna, Isblank, Iserr, Iseven, Isodd, Islogical, Isytext, Max, Min, Len, Right, Left, Mid, ,Maxa, Maxifs, Median, Minifs, Mina, Vara, Correl, Geomen
Logical Functions:-
And, Or, If, Iferror, Not, Nested If
Lookup & Reference Functions:-
VLookup, HLookup, Index, Match, Offset, Indirect, Address, Column, Columns, Row, Rows, Choose, Arrays Concept In Lookup Formula’s, Past Special, Past link
Pivot Table and Charts, Import and Export data, Protect/Unprotect sheets/workbooks. Worksheet formatting and Print Display
Data Collection Method With Data Quality, Collaboration & Security Like Share Your Workbook On Share Drive With Quality
Analysis - Single/Multidimensional Analysis, Like Three Dimensional (3D) Tables, Sensitive Analysis Like Data Table, Manual What-If Analysis, Threshold Values, Goal Seek, One-Variable Data Table, Two-Variable Data Table
Advanced Chart Technique, How to Make Dynamic Charts, Bar Charts, Pie Charts, Scatter Chart, Line Chart, Column Chart, Speedometer Chart, Gantt chart.
Advanced Dashboard.
Report Development - (Real World Data)
=====================
DASHBOARD
VBA | MACROS PROGRAMMING
Excel VBA Power Programming For VBA Macros
Working with Dynamic Ranges. Protecting Worksheets, Cells and Ranges. Working with Multiple Files. Opening & Saving Files
How to Analyze Data On Multi Worksheets And Build Summary Sheets
How to Access The Windows File And Folder System To Open And Close Workbooks
How to Protect Your Code Against Errors
How to Use Excel And VBA To Create Basic Dash Boards
How to Create Your Own Custom Business Worksheet Functions In VBA
How to Create Basic Report Generation Tools Using Excel VBA, Microsoft Word And PowerPoint
How to Use The Excel Visual Basic Macro Recorder To Record Excel Tasks In VBA And Then Interpret The Code
Overview of Using User forms To Create Business Wizards
Working with User Forms & User Forms Events like List box, Combo box, Option Buttons, Checkbox, Textbox, Labels, Command button, Toggle button.
How to create dynamic dashboard on user form with different controls
How to link various user form with each other to create a complete interface between user and system
Connection between Excel VBA & other platforms
How to Establish Connection Between VBA and Internet Explorer to Open any Internet Website through VBA
How to Establish Connection Between Excel VBA and power presentation to create power point through VBA
How to Establish Connection Between Excel VBA and Access database to update the data in access through VBA
How to Establish Connection Between Excel VBA and outlooks through VBA
How to Establish Connection Between Excel VBA and MS Word through VBA
Testing and Debugging Your Code
Effective Error Handling
Automation Development Reports & Live Projects
====================
MS ACCESS & SQL
Access is a relational database management system (RDBMS) from Microsoft that combines the relational Microsoft Jet Database Engine with a graphical user interface and software-development tools. ... It can also import or link directly to data stored in other applications and databases.
Topics Covered as follows:
Access environment and tools
Database terminology and concept
Designing database in Access
Understanding RDBMS
Working with the Design side of Tables
Create Query
Join Tables That Have No Common Fields
Work with Subdatasheets
Create Sub queries
Working with the runtime of Tables
Data migration and importing
Working with the Design side of Queries
Working with the runtime of Queries
Working with the Design side of Forms
Adding Controls to Forms
Creating Sub forms
Organizing Information with Tab Pages
Displaying a Summary of Data in a Form
Applying Conditional Formatting
Working with the runtime of Forms, Managing Switchboard
Working with the Design side of Reports
Organize Report Information
Format Reports Include Charts in a Report
Add a Calculated Field to a Report
Add a Sub report to an Existing Report
Working with the runtime of Reports
Working with the Design side of Macros
Creating a Macro Restricting Records Using a Condition
Automating Data Entry Using a Macro
Working with the runtime of Macros
How to create a functional specification
Build a real-world business application
Putting altogether and deployment
============
PRACTICAL IMPLEMENTATION
0 notes