#reversal candlestick pattern
Explore tagged Tumblr posts
Visit Tumblr Blog
Explore Tumblr blogs with no restrictions, modern design and the best experience.
Last Seen Tumblr Blogs


Fun Fact
Post activity is at the highest at 4:00 pm EDT; notes peak at 10:00 pm EDT.
Text
There are three major trends which a stock price follows, either it is an upturned, downtrend or sideways. Reversal candlestick patterns spot the change in direction of a stock trend. Therefore it becomes easier to know when the stock price can reverse and accordingly you can take an entry or exit in a stock.
0 notes
Text
10 Candlestick Patterns for Effective Trading
Candlestick patterns are a powerful tool for traders to analyze price movements and predict future market behavior. Developed in Japan over 300 years ago, these patterns are widely used in modern technical analysis. This article will explore ten essential candlestick patterns that can help traders make informed decisions and enhance their trading strategies. What are Candlestick…
#Bearish Patterns#Bullish Patterns#Candlestick Patterns#Downtrend#Entry and Exit Points#Forex#Forex Traders#Forex Trading#Market Reversal#Price Movements#Risk Management#Stop-Loss#Take-Profit#Technical Analysis#Trading Psychology#Trading Strategies#Trading Strategy#Trend Direction#Trend Identification#Uptrend
1 note
·
View note
Text
#risk management#market capitalization#india#bullish reversal#market trends#chart pattern#candlestick pattern
0 notes
Video
youtube
Mastering the DOUBLE BOTTOM FOREX TRADING for Maximum Gain 2023
#youtube#youtube trending#Double Bottom Pattern Explained#Trading Strategies with Double Bottom#Identifying Double Bottom Reversals#Double Bottom Chart Pattern Tutorial#How to Spot Double Bottoms in Forex#Double Bottom Candlestick Patterns#Double Bottom Trading Signals#Double Bottom vs. Double Top Differences#Double Bottom Formation Analysis#Successful Double Bottom Trading Tips#Double Bottom Pattern for Beginners#Real Examples of Double Bottom in Stock Market#Double Bottom Breakout Strategies#Double Bottom Technical Analysis Guide#Common Mistakes in Double Bottom Trading
0 notes
Text
Unlock the Secrets of Trading with Top Chart Patterns! Explore the world of chart patterns with Funded Traders Global. From understanding the basics of technical analysis to recognizing common chart patterns like head and shoulders, double tops, and flags, our blog equips you with the knowledge to enhance your trading skills. Discover advanced patterns like pennants, wedges, and harmonic patterns, and gain practical tips for effective trading. Improve your risk management, pinpoint entry and exit points, and combine chart patterns with technical indicators. Start your journey towards trading success today with Funded Traders Global!
#Advanced Chart Pattern#and Descending Triangles#and mini trading#Ascending#Basics of Technical Analysis#Benefits of Recognizing in Chart Pattern#Bullish and Bearish Flags Pattern#candlestick#candlestick Pattern#career in forex trading#chart patterns#classic reversal pattern#common chart patterns#cup and handle pattern#Double top and double bottom patterns#drawdown#financial markets#Forex trading financial freedom#FTG#ftg prop firm#ftg trading#Funded Traders Global#Gaps#Harmonic Patterns#Head and Shoulders Pattern#how to scale into a forex trade#Macro#Master the Market with These Top Chart Patterns for Trading#mastering Forex trading#micro
0 notes
Text
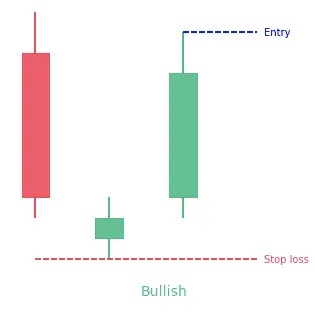
Learn with us the structure of these patterns, where they are found, how to confirm them, and most importantly how to trade with them.
Which involves:
Where you can take an entry position in the market,
Where you can put the stop loss,
And at what point an exit can be beneficial.
Three outside up, three outside down, three inside up, and three inside down patterns are the most commonly used candlestick patterns in technical analysis. As the name suggests they are three candlestick patterns and often signal trend reversal. Either a bullish reversal or a bearish reversal. The appearance of these patterns indicates that the market's trend either upward or downwards is going to change....
#Chart patterns#Price action trading#Trading basics#Technical analysis#Candlestick patterns#Support and resistance#Reversal patterns#three outside up#three outside down#three insdie up#trend reversal
0 notes
Text
10 Advanced Candlestick Patterns PDF Download
If you’re an avid trader or investor looking to sharpen your skills and gain a competitive edge, understanding and utilizing advanced candlestick patterns can be incredibly beneficial. In this article, we will explore some of the most powerful candlestick patterns that can help predict future price movements more accurately.But why should you care about candlestick patterns? Well, these…
View On WordPress
#Advanced Candlestick Patterns#Candlestick pattern#Chart pattern#FYI#IOS#Island reversal#Market sentiment#PDF#Support and resistance#Technical analysis#Three black crows#Three white soldiers#Your Arsenal
0 notes
Text
Candlestick Chart Patterns - An Essential to Earn Money Through Trading in Stock Market
Traders have been using Candlestick chart patterns for centuries to analyse price trends and predict market reversals. Developed in Japan during the 18th century, this technique gained popularity among rice traders before finding its way into modern financial markets. You might also like : Nifty 50 Prediction for Tomorrow What is a Candlestick Chart Pattern? A candlestick is a candle-like…

View On WordPress
#Bearish Candlestick Patterns#Bullish Candlestick Patterns#Candlestick Chart Patterns#Reversal Candlestick Patterns#Trading Candlestick Patterns#Types of Candlestick Patterns
0 notes
Text
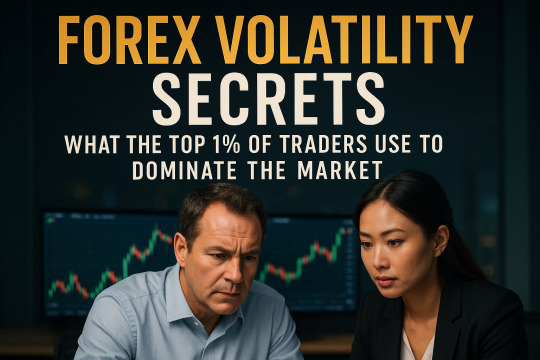
Forex Volatility Secrets: What the Top 1% of Traders Use to Dominate the Market
Forex volatility is often viewed as both a challenge and an opportunity in the fast-paced world of trading. For the majority of traders, volatility represents a threat—an unpredictable force that can quickly wipe out profits. However, for the top 1% of traders, volatility is an ally, an essential element they’ve learned to harness to their advantage. In this article, we’ll delve into the secrets behind how these elite traders master Forex volatility, with expert insights from Sangram Mohanta, a Forex trader with 15 years of experience. We’ll also share a real-life success story and discuss the importance of website security in Forex trading.
Understanding Forex Volatility
Forex volatility refers to the rapid price fluctuations that occur within the foreign exchange market. Volatile markets experience sharp, often unpredictable price movements, making them exciting for traders who know how to profit from these swings. However, volatility can also lead to substantial losses for those who aren’t prepared.
For top traders, volatility is not something to fear. Instead, it’s an opportunity to make substantial profits. By understanding the causes of volatility—such as economic data releases, political events, and central bank decisions—they can predict market movements and make informed trading decisions. Mastering this volatility is key to dominating the market.
Expert Insights: How Sangram Mohanta Dominates Forex Volatility
Sangram Mohanta, a Forex trading expert with over 15 years of experience, has been trading through various market conditions, including high-volatility periods. According to Mohanta, “The key to success in volatile markets isn’t to avoid the fluctuations but to embrace them and learn to read the signals the market is sending.”
He believes that the top 1% of traders use a combination of technical analysis, a deep understanding of economic fundamentals, and precise risk management strategies to profit from Forex volatility. Mohanta recommends staying informed about global economic events that can trigger volatility, such as GDP reports, central bank decisions, and geopolitical developments.
“Volatility is predictable if you understand the forces driving it, says Mohanta. By closely monitoring the economic calendar and using the right tools, traders can prepare for and capitalize on these movements rather than being caught off guard.
Insider Secrets to Mastering Forex Volatility
So, what are the specific secrets that top traders use to dominate the Forex market during volatile conditions? Here are a few key strategies that the elite traders rely on:
Leverage Advanced Technical Analysis: The top 1% of traders are masters of technical analysis. They use sophisticated chart patterns, candlestick formations, and indicators like the Average True Range (ATR) and Bollinger Bands to assess market volatility. By identifying patterns such as breakout or reversal signals, traders can time their entries and exits with high precision, capitalizing on price swings.
Use Fundamental Analysis to Anticipate Volatility: While technical analysis is vital, top traders also use fundamental analysis to anticipate volatility. For example, when a central bank is about to announce interest rate decisions, there is often heightened volatility. Traders who track economic data and geopolitical events can predict potential market reactions and position themselves accordingly.
Implement Smart Risk Management: The difference between a successful trader and an unsuccessful one is often the ability to manage risk. Top traders know that Forex volatility amplifies the potential for loss, so they never risk more than they can afford to lose. This is why they use techniques like setting tight stop-loss orders, scaling into positions, and employing position sizing strategies to protect their capital.
Trade with Smaller Time Frames: In volatile markets, large price movements can happen within short time frames. Many successful traders take advantage of this by trading on smaller time frames (such as 5-minute or 15-minute charts) to catch intraday price swings. This allows them to stay nimble and capitalize on short-term volatility.
Stay Disciplined and Patient: While volatility creates opportunities, it also leads to impulsive trading decisions for many. Top traders remain disciplined and patient, sticking to their strategies even when the market is chaotic. They understand that not every price movement needs to be acted upon, and waiting for high-probability setups is often more profitable than chasing every fluctuation.
Real-Life Trading Success Story: How John Turned Volatility into Profit
John, a novice trader, once struggled with the volatility of the Forex market. In the beginning, he was overwhelmed by rapid price changes and found himself losing money more often than winning. However, after following the strategies taught by Sangram Mohanta, John’s approach to trading transformed.
John began to pay close attention to economic calendars and the events that created market volatility, such as U.S. Federal Reserve announcements and European Central Bank policy meetings. Using technical tools like Bollinger Bands, John started to identify price breaks and volatility expansion, allowing him to catch high-reward trades during these periods of market movement.
One of John’s most successful trades came during a highly volatile week when the U.S. Dollar experienced significant fluctuations due to a surprise rate cut by the Federal Reserve. John positioned himself ahead of the news, using his technical analysis to predict the likely direction of the market after the announcement. As a result, he was able to capitalize on the initial price surge, closing out with a substantial profit. John’s success story exemplifies how understanding Forex volatility and applying strategic methods can lead to substantial gains.

Website Security Features: Trading Safely in a Volatile Market
In addition to mastering volatility, it’s crucial to prioritize the security of your funds and personal information when trading Forex. As volatility can attract cybercriminals, ensuring your trading platform is secure is paramount.
Top Forex brokers, recommended by Top Forex Brokers Review, implement advanced security measures to protect traders. Here are some key security features to look for:
SSL Encryption: A secure trading environment starts with SSL encryption, which ensures that any data exchanged between you and your broker is encrypted and cannot be intercepted by third parties. This protects your personal information and funds.
Two-Factor Authentication (2FA): Many trusted Forex brokers offer 2FA as an added layer of protection. This requires you to enter a unique code sent to your phone or email in addition to your password, making it harder for unauthorized users to access your account.
Regulation and Licensing: Reputable brokers are regulated by top-tier financial authorities such as the Financial Conduct Authority (FCA) or the Australian Securities and Investments Commission (ASIC). These regulatory bodies ensure brokers meet strict security standards and safeguard client funds.
Secure Trading Platforms: The best Forex brokers provide trading platforms with built-in security features, such as real-time monitoring of transactions, secure login systems, and encryption to prevent unauthorized access.
By choosing a broker with a strong security infrastructure, you can focus on your trading strategies without worrying about cyber threats or financial risks.
Why Choosing the Right Broker Matters
When navigating the volatile Forex market, your broker plays a pivotal role in your success. A trusted broker ensures that you have access to the right tools, market analysis, and a secure trading platform. Top Forex Brokers Review evaluates brokers based on key factors such as regulatory compliance, customer service, and platform reliability. Choosing the right broker is essential for capitalizing on market volatility and achieving long-term trading success.
Conclusion
Forex volatility doesn’t have to be a source of stress. By adopting the strategies used by the top 1% of traders, such as leveraging technical and fundamental analysis, implementing smart risk management, and staying disciplined, you can turn volatility into an opportunity for profit. Expert traders like Sangram Mohanta have built successful careers by mastering the art of trading during volatile periods—and you can too.
Additionally, don’t overlook the importance of website security. By choosing a trusted and regulated broker with robust security features, you can trade with peace of mind.
With the right knowledge, tools, and security measures, you can dominate the Forex market and join the ranks of successful traders in 2025. For expert broker recommendations and more insights into trading strategies, visit Top Forex Brokers Review—your go-to resource for Forex trading success.
3 notes
·
View notes
Text
Reversal Trading: Forex Trading Strategy Explained
In the dynamic world of forex trading, strategies are essential for navigating the volatile market. One such effective strategy is reversal trading. This technique involves identifying points at which a trend is likely to reverse direction. Understanding and mastering this strategy can provide traders with significant advantages, enabling them to capitalize on market shifts. This article delves…
#Candlestick Patterns#Divergence#Downtrend#Entry and Exit Points#Fibonacci Retracement#Forex#Forex Strategy#Forex Trading#Geopolitical Events#Market Conditions#Market Indicators#Market Sentiment#Moving Average#Overtrading#Price Movements#Profitability#Relative Strength#Reversal Signals#Reversal Trading#Risk Management#RSI#Stop-Loss#Support And Resistance#Trading Strategy#Trading Techniques#Trading Volume#Trend Following#Uptrend#Volume Analysis
1 note
·
View note
Link
#CandlestickAnalysis#candlestickpatterns#chartpatterns#ForexTrading#markettrends#MomentumTrading#priceaction#ReversalPatterns#riskmanagement#StockMarket#supportandresistance#technicalanalysis#TradingSignals#TradingStrategy#TrendContinuation
2 notes
·
View notes
Text
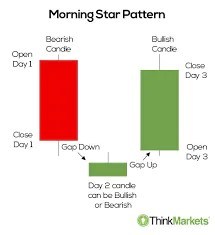
Mastering the Morning Star Pattern: A Step-by-Step Guide
Title: Mastering the Morning Star Pattern: A Step-by-Step Guide Introduction:The world of technical analysis offers traders a plethora of tools to identify potential trend reversals and market opportunities. One such powerful pattern is the Morning Star pattern, a three-candlestick formation that signals a potential bullish reversal after a downtrend. In this step-by-step guide, we will explore…
View On WordPress
#bullish reversal#candlestick patterns#comprehensive trading approach.#confirmation factors#doji candle#downtrend#false signals#market sentiment#momentum shift#Morning Star pattern#position sizing#price action#resistance levels#Risk Management#spinning top#stop-loss#support levels#technical analysis#trading strategy#trading volume#Trend Reversal#volume analysis
0 notes
Text
Hammer Candlestick: Make Reversal Opportunities
In the world of technical analysis, identifying potential market reversals is important for traders seeking to maximize their profits and minimize their losses. One of the most reliable patterns for spotting these reversals is candlestick patterns, especially hammer candlestick
What Is a Hammer Candlestick?
A hammer candlestick pattern is a specific type of candlestick pattern used in technical analysis to indicate a potential reversal in a downtrend. It appears at the bottom of a downward trend and is characterized by a small body at the upper end of the trading range with a long lower shadow. The length of the lower shadow is at least twice the length of the body. This pattern suggests that despite the sellers pushing prices down significantly during the trading period, strong buying pressure drove the prices back up near the opening price by the end of the period, indicating a possible reversal to the upside.
Types of Hammer Candlestick
Hammer Candlestick The hammer candlestick pattern appears at the bottom of a downtrend and is characterized by a small body with a long lower shadow and little to no upper shadow. The lower shadow should be at least twice the length of the body.
Inverted Hammer Candlestick The inverted hammer candlestick pattern also appears at the bottom of a downtrend but is characterized by a small body with a long upper shadow and little to no lower shadow. The upper shadow should be at least twice the length of the body.
Limitations of Hammer Candlestick
Confirmation Required: A hammer candlestick alone does not guarantee a trend reversal. Subsequent bullish price action is needed to validate it.
No Price Target: The pattern does not provide a specific price target for the potential reversal, requiring other tools for determining exit points.
Context-Dependent: The hammer pattern is most reliable at the bottom of a downtrend and may not be valid in other market conditions.
False Signals: In highly volatile markets, hammer patterns can occur frequently without indicating a true reversal.
Additional Indicators Needs: It will be more effective with other technical analysis tools, rather than relying solely on the hammer candlestick.
Learn more: https://finxpdx.com/hammer-candlestick-how-to-spot-reversal-opportunities/

5 notes
·
View notes
Text
Chart Chaser: A Trader’s Obsession with Technical Analysis on MintCFD

In the realm of online trading, a “Chart Chaser” is a trader who relies heavily on technical analysis. These traders obsessively study charts, patterns, and indicators to identify the optimal entry and exit points for their trades. While some traders focus on market news or economic fundamentals, Chart Chasers believe that the key insights lie within the patterns and trends shown in the data itself. For users on MintCFD, adopting the Chart Chaser approach can be rewarding, especially given the wide range of tools and various trading chart patterns available on the platform.
The Allure of Following Trends in Charts
Chart Chasers are drawn to technical analysis because it offers a visual and data-driven way to understand market behavior. By studying price movements, volume, and indicators, they look for recurring patterns, such as Double Bottoms, Head and Shoulders, and Moving Averages, which they believe can predict future price action. With the MintCFD trading app, traders have access to advanced charting tools that make it easy to become a Chart Chaser, allowing for in-depth analysis and strategy development.
Key Tools on the MintCFD Platform for Chart Chasers
MintCFD’s platform is rich with tools tailored for those who take a technical approach. Here are some essentials for the dedicated Chart Chaser:
Real-Time Charting Tools: MintCFD offers detailed, real-time charts that provide instant insights into price movements. For a Chart Chaser, these charts are invaluable as they capture every shift and trend in the market, allowing them to act quickly based on the latest data.
Diverse Chart Patterns: From Candlestick charts to Line charts, MintCFD provides several options, enabling traders to switch between patterns based on their trading style. For instance, Candlestick patterns are often favored by Chart Chasers because they reveal price action in detail, helping traders identify trends and reversals.
Technical Indicators: Popular indicators, such as the RSI (Relative Strength Index), MACD (Moving Average Convergence Divergence), and Bollinger Bands, are available on MintCFD to help Chart Chasers confirm their hypotheses. These indicators can signal overbought or oversold conditions, momentum changes, and potential trend reversals.
Custom Alerts: MintCFD’s alert system lets Chart Chasers set notifications based on specific price movements, helping them act on technical signals even if they’re not actively monitoring their screens. This way, they never miss a crucial trade opportunity based on their analysis.
Benefits and Pitfalls of Being a Chart Chaser
For those who love data, becoming a Chart Chaser offers unique advantages, but it also comes with some potential pitfalls. Here’s how to manage both on the MintCFD Platform:
Benefits: Technical analysis is highly data-driven, meaning decisions are based on objective data rather than emotional responses. By relying on chart patterns and indicators, Chart Chasers can create highly structured strategies with specific entry and exit points. With MintCFD’s intuitive tools, they can continuously refine their methods and explore different indicators.
Pitfalls: Focusing solely on technical analysis can lead to “analysis paralysis,” where a trader over-analyzes and hesitates to act. Additionally, ignoring market news and economic factors may leave a Chart Chaser blind to important influences. MintCFD offers market news and insights alongside technical tools, helping Chart Chasers balance their analysis with a broader context.
Master the Market on MintCFD Trading App: Stop Over-Analyzing and Start Thriving as a Chart Chaser
To succeed as a Chart Chaser without getting caught in a loop of over-analysis, it’s essential to have a plan and set clear criteria for entering and exiting trades. MintCFD’s watchlists and alert systems can help keep track of multiple assets without overwhelming yourself with constant analysis. Having a set of “go-to” indicators and patterns also helps prevent information overload.
Final Thoughts
For traders who thrive on technical data, becoming a Chart Chaser can be an exciting and rewarding journey. MintCFD is an ideal platform for these traders, with its robust charting tools, real-time indicators, and customizable alerts. While it’s easy to get caught up in the details, the best Chart Chasers know when to step back and trust their analysis. By balancing data with a disciplined approach, MintCFD users can make the most of their technical strategies and succeed in the dynamic world of trading.
Take control of your trading journey with the MintCFD Trading App
#mintcfd#cfdtrading#cryptotrading#onlinetrading#tradingstrategy#tradingsignals#forextrading#forexstrategies#cryptoinvesting#stockmarket
2 notes
·
View notes
Text
Trend reversal patterns | tradesense institute
The trend reversal candlestick patterns are commonly used in technical analysis to indicate indecision in the market. They indicate that the market's trend, which may have been going either up or down, is probably going to change.
Traders can use these patterns to help them decide whether to purchase or sell a specific security when making investing decisions.
There are various types of trend reversal patterns five of which are listed below:
Morning star
Evening star
Bullish engulfing
Bearish engulfing
Tweezer bottom
View on wordpress
#Chart patterns#Price action trading#Trading basics#Technical analysis#Candlestick patterns#Reversal patterns#trendreversal#morningstar candlestick#eveningstar candlestick
1 note
·
View note
Text
Bitcoin, the leading cryptocurrency, has recently faced a significant downturn, trading around $56,697.32. Despite this bearish phase, there are signs of a potential rebound. The Relative Strength Index (RSI) stands at 28.41, indicating oversold conditions typically seen as buying opportunities. Candlestick patterns with long lower shadows suggest buying pressure at lower levels, hinting at a price reversal.
Influential analyst CryptoJack is optimistic, predicting Bitcoin will surpass $100,000 despite the current downturn. He believes Bitcoin is near its bottom, aligning with technical indicators suggesting an oversold market.
Market data from CoinMarketCap shows Bitcoin’s market cap at $1.12 trillion, a 2.63% increase in one day, while the 24-hour trading volume has decreased by 38.03% to $31.91 billion, indicating consolidation. Traders are cautious, but the oversold RSI and bullish patterns support the possibility of a rebound. Watching for signs of reversal could signal the start of a recovery phase.
4 notes
·
View notes