#spark-sql
Explore tagged Tumblr posts
Visit Tumblr Blog
Explore Tumblr blogs with no restrictions, modern design and the best experience.
Last Seen Tumblr Blogs


Fun Fact
Tumblr has a 66 index score for customer satisfaction in the US.
Text
Gluten And Intel CPUs Boost Apache Spark SQL Performance

The performance of Spark may be improved by using Intel CPUs and Gluten.
The tools and platforms that businesses use to evaluate the ever-increasing amounts of data that are coming in from devices, consumers, websites, and more are more crucial than ever. Efficiency and performance are crucial as big data analytics provides insights that are both business- and time-critical.
Workloads involving large data analytics on Apache Spark SQL often run constantly, necessitating excellent performance to accelerate time to insight. This implies that businesses may defend paying a bit more overall in order to get greater results for every dollar invested. It looked at Spark SQL performance on Google Cloud instances in the last blog.
Spark Enables Scalable Data Science
Apache Spark is widely used by businesses for large-scale SQL, machine learning and other AI applications, and batch and stream processing. To enable data science at scale, Spark employs a distributed paradigm; data is spread across many computers in clusters. Finding the data for every given query requires some overhead due to this dispersion. A key component of every Spark workload is query speed, which leads to quicker business decisions. This is particularly true for workloads including machine learning training.
Utilizing Gluten to Quicken the Spark
Although Spark is a useful tool for expediting and streamlining massive data processing, businesses have been creating solutions to improve it. Intel’s Optimized Analytics Package (OAP) Spark-SQL execution engine, Gluten, is one such endeavor that reduces computation-intensive vital data processing and transfers it to native accelerator libraries.
Gluten uses a vectorized SQL processing engine called Velox (Meta’s open-source) C++ generic database acceleration toolkit to improve data processing systems and query engines. A Spark plugin called Gluten serves as “a middle layer responsible for offloading the execution of JVM-based SQL engines to native engines.” The Apache Gluten plugin with Intel processor accelerators allow users to significantly increase the performance of their Spark applications.
It functions by converting the execution plans of Spark queries into Substrait, a cross-language data processing standard, and then sending the now-readable plans to native libraries via a JNI call. The execution plan is constructed, loaded, and handled effectively by the native engine (which also manages native memory allocation) before being sent back to Gluten as a Columnar Batch. The data is then sent back to Spark JVM as ArrowColumnarBatch by Gluten.
Gluten employs a shim layer to support different Spark versions and a fallback technique to execute vanilla Spark to handle unsupported operators. It captures native engine metrics and shows them in the Spark user interface.
While outsourcing as many compute-intensive data processing components to native code as feasible, the Gluten plugin makes use of Spark’s own architecture, control flow, and JVM code. Existing data frame APIs and applications will function as previously, although more quickly, since it doesn’t need any modifications on the query end.
Enhancements in Performance Was Observed
This section examines test findings that show how performance may be enhanced by using Gluten in your Spark applications. One uses 99 distinct database queries to construct a general-purpose decision support system based on TPC-DS. The other, which is based on TPC-H, uses ten distinct database queries to simulate a general-purpose decision support system. Everyone compared the time it took for a single user to finish each query once within the Spark SQL cluster for both.
Fourth Generation Intel Xeon Scalable Processors
Help start by examining how adding Gluten to Spark SQL on servers with 4th Generation Intel Xeon Scalable Processors affects performance. The performance increased by 3.12 times when it was added, as the chart below illustrates. The accelerator enabled the system to execute the 10 database queries over three times faster on the TPC-H-like workload. Gluten more than quadrupled the pace at which all 99 database queries were completed on the workload that resembled TCP-DS. Because of these enhancements, decision-makers would get answers more quickly, proving the benefit of incorporating Gluten into your Spark SQL operations.
Fifth Generation Intel Xeon Scalable Processors
Let’s now investigate how Gluten speeds up Spark SQL applications on servers equipped with Intel Xeon Scalable Processors of the Fifth Generation. With speed up to 3.34 times as high while utilizing Gluten, you saw even bigger increases than they experienced on the servers with older CPUs, as the accompanying chart illustrates. Incorporating Gluten into your environment will help you get more out of your technology and reduce time to insight if your data center has servers of this generation.
Cloud Implications
Even though they ran these tests in a data center using bare metal hardware, they amply illustrate how Gluten may boost performance even in the cloud. Using Spark in the cloud may allow you to take advantage of further performance enhancements by using Gluten.
In conclusion
Rapid analysis completion is essential to the success of your business, regardless of whether your Spark SQL workloads are running on servers with 5th version Intel Xeon Scalable Processors or the older version. By shifting JVM data processing to native libraries, Gluten may benefit from the speed improvement that Intel processors can provide with native libraries that are optimized to instruction sets.
According to these tests, you may easily double or even treble the speed at which your servers execute database queries by integrating the Gluten plugin into Spark SQL workloads. Using Gluten may help your company optimize data analytics workloads by offering up to 3.34x the performance.
Read more on Govindhtech.com
#Gluten#IntelCPUs#SparkSQL#SQL#ApacheSpark#Spark#IntelXeonScalableProcessors#Glutenplugin#machinelearning#News#Technews#Technology#Technologynews#Technologytrends#govindhtech
0 notes
Text
What is Data Science? A Comprehensive Guide for Beginners

In today’s data-driven world, the term “Data Science” has become a buzzword across industries. Whether it’s in technology, healthcare, finance, or retail, data science is transforming how businesses operate, make decisions, and understand their customers. But what exactly is data science? And why is it so crucial in the modern world? This comprehensive guide is designed to help beginners understand the fundamentals of data science, its processes, tools, and its significance in various fields.
#Data Science#Data Collection#Data Cleaning#Data Exploration#Data Visualization#Data Modeling#Model Evaluation#Deployment#Monitoring#Data Science Tools#Data Science Technologies#Python#R#SQL#PyTorch#TensorFlow#Tableau#Power BI#Hadoop#Spark#Business#Healthcare#Finance#Marketing
0 notes
Text
Data Engineering User Guide
Data Engineering User Guide #sql #database #language #query #schema #ddl #dml#analytics #engineering #distributedcomputing #dataengineering #science #news #technology #data #trends #tech #hadoop #spark #hdfs #bigdata
Even though learning about Data engineering is a daunting task, one can have a clear understanding of this filed by following a step-by-step approach. In this blog post, we will go over each of the steps and relevant steps you can follow through as a tutorial to understand Data Engineering and related topics. Concepts on Data In this section, we will learn about data and its quality before…
0 notes
Text
[Fabric] Leer PowerBi data con Notebooks - Semantic Link
El nombre del artículo puede sonar extraño puesto que va en contra del flujo de datos que muchos arquitectos pueden pensar para el desarrollo de soluciones. Sin embargo, las puertas a nuevos modos de conectividad entre herramientas y conjuntos de datos pueden ayudarnos a encontrar nuevos modos que fortalezcan los análisis de datos.
En este post vamos a mostrar dos sencillos modos que tenemos para leer datos de un Power Bi Semantic Model desde un Fabric Notebook con Python y SQL.
¿Qué son los Semantic Links? (vínculo semántico)
Como nos gusta hacer aquí en LaDataWeb, comencemos con un poco de teoría de la fuente directa.
Definición Microsoft: Vínculo semántico es una característica que permite establecer una conexión entre modelos semánticos y Ciencia de datos de Synapse en Microsoft Fabric. El uso del vínculo semántico solo se admite en Microsoft Fabric.
Dicho en criollo, nos facilita la conectividad de datos para simplificar el acceso a información. Si bién Microsoft lo enfoca como una herramienta para Científicos de datos, no veo porque no puede ser usada por cualquier perfil que tenga en mente la resolución de un problema leyendo datos limpios de un modelo semántico.
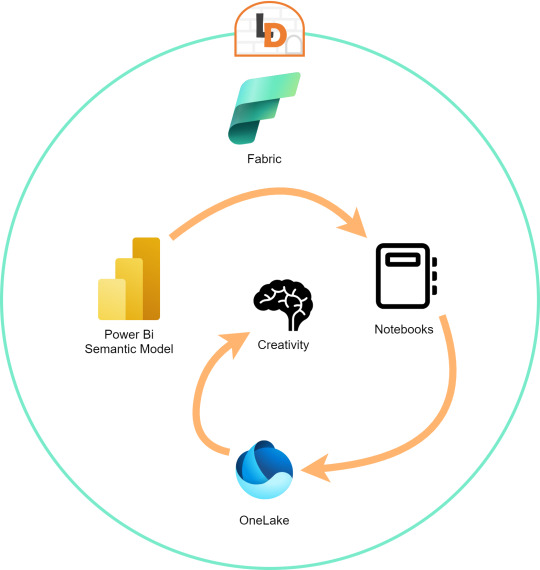
El límite será nuestra creatividad para resolver problemas que se nos presenten para responder o construir entorno a la lectura de estos modelos con notebooks que podrían luego volver a almacenarse en Onelake con un nuevo procesamiento enfocado en la solución.
Semantic Links ofrecen conectividad de datos con el ecosistema de Pandas de Python a través de la biblioteca de Python SemPy. SemPy proporciona funcionalidades que incluyen la recuperación de datos de tablas , cálculo de medidas y ejecución de consultas DAX y metadatos.
Para usar la librería primero necesitamos instalarla:
%pip install semantic-link
Lo primero que podríamos hacer es ver los modelos disponibles:
import sempy.fabric as fabric df_datasets = fabric.list_datasets()
Entrando en más detalle, también podemos listar las tablas de un modelo:
df_tables = fabric.list_tables("Nombre Modelo Semantico", include_columns=True)
Cuando ya estemos seguros de lo que necesitamos, podemos leer una tabla puntual:
df_table = fabric.read_table("Nombre Modelo Semantico", "Nombre Tabla")
Esto genera un FabricDataFrame con el cual podemos trabajar libremente.
Nota: FabricDataFrame es la estructura de datos principal de vínculo semántico. Realiza subclases de DataFrame de Pandas y agrega metadatos, como información semántica y linaje
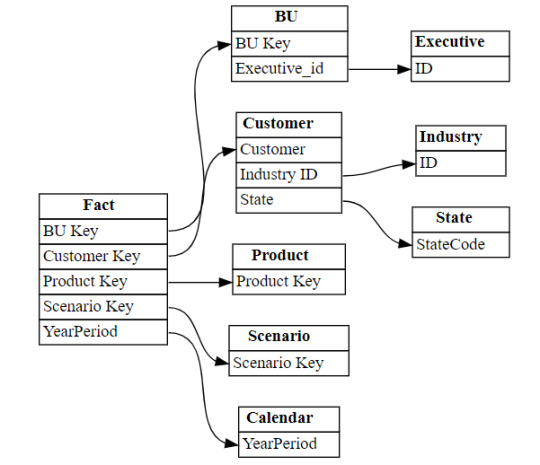
Existen varias funciones que podemos investigar usando la librería. Una de las favoritas es la que nos permite entender las relaciones entre tablas. Podemos obtenerlas y luego usar otro apartado de la librería para plotearlo:
from sempy.relationships import plot_relationship_metadata relationships = fabric.list_relationships("Nombre Modelo Semantico") plot_relationship_metadata(relationships)
Un ejemplo de la respuesta:
Conector Nativo Semantic Link Spark
Adicional a la librería de Python para trabajar con Pandas, la característica nos trae un conector nativo para usar con Spark. El mismo permite a los usuarios de Spark acceder a las tablas y medidas de Power BI. El conector es independiente del lenguaje y admite PySpark, Spark SQL, R y Scala. Veamos lo simple que es usarlo:
spark.conf.set("spark.sql.catalog.pbi", "com.microsoft.azure.synapse.ml.powerbi.PowerBICatalog")
Basta con especificar esa línea para pronto nutrirnos de clásico SQL. Listamos tablas de un modelo:
%%sql SHOW TABLES FROM pbi.`Nombre Modelo Semantico`
Consulta a una tabla puntual:
%%sql SELECT * FROM pbi.`Nombre Modelo Semantico`.NombreTabla
Así de simple podemos ejecutar SparkSQL para consultar el modelo. En este caso es importante la participación del caracter " ` " comilla invertida que nos ayuda a leer espacios y otros caracteres.
Exploración con DAX
Como un tercer modo de lectura de datos incorporaron la lectura basada en DAX. Esta puede ayudarnos de distintas maneras, por ejemplo guardando en nuestro FabricDataFrame el resultado de una consulta:
df_dax = fabric.evaluate_dax( "Nombre Modelo Semantico", """ EVALUATE SUMMARIZECOLUMNS( 'State'[Region], 'Calendar'[Year], 'Calendar'[Month], "Total Revenue" , CALCULATE([Total Revenue] ) ) """ )
Otra manera es utilizando DAX puramente para consultar al igual que lo haríamos con SQL. Para ello, Fabric incorporó una nueva y poderosa etiqueta que lo facilita. Delimitación de celdas tipo "%%dax":
%%dax "Nombre Modelo Semantico" -w "Area de Trabajo" EVALUATE SUMMARIZECOLUMNS( 'State'[Region], 'Calendar'[Year], 'Calendar'[Month], "Total Revenue" , CALCULATE([Total Revenue] ) )
Hasta aquí llegamos con esos tres modos de leer datos de un Power Bi Semantic Model utilizando Fabric Notebooks. Espero que esto les revuelva la cabeza para redescubrir soluciones a problemas con un nuevo enfoque.
#fabric#fabric tips#fabric tutorial#fabric training#fabric notebooks#python#pandas#spark#power bi#powerbi#fabric argentina#fabric cordoba#fabric jujuy#ladataweb#microsoft fabric#SQL#dax
0 notes
Link
#BigData#DataLake#DeltaLake#DWH#ETL#PySpark#Python#Security#Spark#SQL#архитектура#безопасность#Большиеданные#обработкаданных
0 notes
Text
Data Analysis Online: Crafting a Learning Path for Success

In today's data-driven world, mastering data analysis is essential for professionals across various industries. As the demand for data analysis skills continues to grow, individuals are turning to online learning platforms to acquire the knowledge and expertise needed to succeed in this field. Crafting a structured learning path is key to achieving success in data analysis online. Let's explore how to design a learning path tailored to mastering data analysis and advancing your career aspirations.
1. Assess Your Current Skill Level:
Before diving into data analysis online, it's essential to assess your current skill level and identify areas for improvement. Evaluate your proficiency in essential tools and concepts such as Python programming, SQL querying, and basic statistical analysis. Understanding your strengths and weaknesses will help you tailor your learning path to address specific skill gaps and build a solid foundation for success.
2. Identify Learning Objectives:
Define clear learning objectives to guide your data analysis journey. Whether you're aiming to become proficient in Python programming for data analysis, master SQL for database querying, or explore advanced topics like machine learning and big data analytics, setting specific goals will help you stay focused and motivated throughout your learning experience.
3. Choose High-Quality Courses:
Selecting the right courses is crucial for mastering data analysis online. Look for reputable online platforms that offer a wide range of courses covering various aspects of data analysis, including Python programming, SQL querying, and specialized topics like Apache Spark for big data analytics. Consider factors such as course content, instructor expertise, hands-on learning opportunities, and student reviews when choosing the best data analysis courses online.
4. Build a Solid Foundation:
Begin your learning journey by focusing on building a solid foundation in essential data analysis skills. Start with introductory courses that cover fundamental concepts and techniques, such as Python programming basics, SQL querying fundamentals, and data manipulation and visualization. These foundational skills will serve as the building blocks for more advanced topics and specialized areas of data analysis.
5. Dive Deeper into Specialized Topics:
Once you've established a strong foundation, explore specialized topics and advanced techniques to expand your data analysis skill set. Delve into courses that cover advanced Python programming for data analysis, advanced SQL querying and database management, and specialized tools and libraries for tasks like data visualization, machine learning, and big data processing with Apache Spark. By exploring specialized topics, you can deepen your expertise and unlock new opportunities in data analysis.
6. Practice, Practice, Practice:
Practice is essential for mastering data analysis skills. Apply what you've learned in your courses to real-world projects, datasets, and problem-solving scenarios. Engage in hands-on exercises, projects, and challenges to reinforce your learning, develop practical skills, and build a portfolio of work that showcases your expertise in data analysis.
In conclusion, crafting a learning path for success in data analysis online requires careful planning, dedication, and a commitment to continuous learning. By assessing your current skill level, setting clear learning objectives, choosing high-quality courses, building a solid foundation, exploring specialized topics, practicing regularly, and staying updated with industry trends, you can embark on a rewarding journey to master data analysis and achieve your career goals.
#apache spark course#data analysis#data analysis skill#python course#best python course#data analysis course#data analysis course online#master data analysis#python course online#sql course#sql course online#best sql course#data analysis online#python course training#sql course training#apache spark course online#best apache spark course#scholarnest#scholarnest technologies
1 note
·
View note
Video
youtube
5:Spark- Community and Ecosystem #spark #python #programming #datascienc...
0 notes
Text
Greetings from Ashra Technologies
we are hiring.....
#ashra#ashratechnologies#ashrajobs#jobsearch#jobs#hiring#recruiting#recruitingpost#Flex#dataengineer#gcp#spark#python#java#datalake#aws#cloudplatform#sql#azure#chennai#pune#apply#applynow#linkedin
0 notes
Text
Unlocking the Full Power of Apache Spark 3.4 for Databricks Runtime!
You've dabbled in the magic of Apache Spark 3.4 with my previous blog "Exploring Apache Spark 3.4 Features for Databricks Runtime", where we journeyed through 8 game-changing features
You’ve dabbled in the magic of Apache Spark 3.4 with my previous blog “Exploring Apache Spark 3.4 Features for Databricks Runtime“, where we journeyed through 8 game-changing features—from the revolutionary Spark Connect to the nifty tricks of constructing parameterized SQL queries. But guess what? We’ve only scratched the surface! In this sequel, we’re diving deeper into the treasure trove of…

View On WordPress
#Apache Spark#Azure Databricks#Azure Databricks Cluster#Data Frame#Databricks#databricks apache spark#Databricks SQL#Memory Profiler#NumPy#performance#Pivot#pyspark#PySpark UDFs#SQL#SQL queries#SQL SELECT#SQL Server
0 notes
Text
Short-Term vs. Long-Term Data Analytics Course in Delhi: Which One to Choose?

In today’s digital world, data is everywhere. From small businesses to large organizations, everyone uses data to make better decisions. Data analytics helps in understanding and using this data effectively. If you are interested in learning data analytics, you might wonder whether to choose a short-term or a long-term course. Both options have their benefits, and your choice depends on your goals, time, and career plans.
At Uncodemy, we offer both short-term and long-term data analytics courses in Delhi. This article will help you understand the key differences between these courses and guide you to make the right choice.
What is Data Analytics?
Data analytics is the process of examining large sets of data to find patterns, insights, and trends. It involves collecting, cleaning, analyzing, and interpreting data. Companies use data analytics to improve their services, understand customer behavior, and increase efficiency.
There are four main types of data analytics:
Descriptive Analytics: Understanding what has happened in the past.
Diagnostic Analytics: Identifying why something happened.
Predictive Analytics: Forecasting future outcomes.
Prescriptive Analytics: Suggesting actions to achieve desired outcomes.
Short-Term Data Analytics Course
A short-term data analytics course is a fast-paced program designed to teach you essential skills quickly. These courses usually last from a few weeks to a few months.
Benefits of a Short-Term Data Analytics Course
Quick Learning: You can learn the basics of data analytics in a short time.
Cost-Effective: Short-term courses are usually more affordable.
Skill Upgrade: Ideal for professionals looking to add new skills without a long commitment.
Job-Ready: Get practical knowledge and start working in less time.
Who Should Choose a Short-Term Course?
Working Professionals: If you want to upskill without leaving your job.
Students: If you want to add data analytics to your resume quickly.
Career Switchers: If you want to explore data analytics before committing to a long-term course.
What You Will Learn in a Short-Term Course
Introduction to Data Analytics
Basic Tools (Excel, SQL, Python)
Data Visualization (Tableau, Power BI)
Basic Statistics and Data Interpretation
Hands-on Projects
Long-Term Data Analytics Course
A long-term data analytics course is a comprehensive program that provides in-depth knowledge. These courses usually last from six months to two years.
Benefits of a Long-Term Data Analytics Course
Deep Knowledge: Covers advanced topics and techniques in detail.
Better Job Opportunities: Preferred by employers for specialized roles.
Practical Experience: Includes internships and real-world projects.
Certifications: You may earn industry-recognized certifications.
Who Should Choose a Long-Term Course?
Beginners: If you want to start a career in data analytics from scratch.
Career Changers: If you want to switch to a data analytics career.
Serious Learners: If you want advanced knowledge and long-term career growth.
What You Will Learn in a Long-Term Course
Advanced Data Analytics Techniques
Machine Learning and AI
Big Data Tools (Hadoop, Spark)
Data Ethics and Governance
Capstone Projects and Internships
Key Differences Between Short-Term and Long-Term Courses
FeatureShort-Term CourseLong-Term CourseDurationWeeks to a few monthsSix months to two yearsDepth of KnowledgeBasic and Intermediate ConceptsAdvanced and Specialized ConceptsCostMore AffordableHigher InvestmentLearning StyleFast-PacedDetailed and ComprehensiveCareer ImpactQuick Entry-Level JobsBetter Career Growth and High-Level JobsCertificationBasic CertificateIndustry-Recognized CertificationsPractical ProjectsLimitedExtensive and Real-World Projects
How to Choose the Right Course for You
When deciding between a short-term and long-term data analytics course at Uncodemy, consider these factors:
Your Career Goals
If you want a quick job or basic knowledge, choose a short-term course.
If you want a long-term career in data analytics, choose a long-term course.
Time Commitment
Choose a short-term course if you have limited time.
Choose a long-term course if you can dedicate several months to learning.
Budget
Short-term courses are usually more affordable.
Long-term courses require a bigger investment but offer better returns.
Current Knowledge
If you already know some basics, a short-term course will enhance your skills.
If you are a beginner, a long-term course will provide a solid foundation.
Job Market
Short-term courses can help you get entry-level jobs quickly.
Long-term courses open doors to advanced and specialized roles.
Why Choose Uncodemy for Data Analytics Courses in Delhi?
At Uncodemy, we provide top-quality training in data analytics. Our courses are designed by industry experts to meet the latest market demands. Here’s why you should choose us:
Experienced Trainers: Learn from professionals with real-world experience.
Practical Learning: Hands-on projects and case studies.
Flexible Schedule: Choose classes that fit your timing.
Placement Assistance: We help you find the right job after course completion.
Certification: Receive a recognized certificate to boost your career.
Final Thoughts
Choosing between a short-term and long-term data analytics course depends on your goals, time, and budget. If you want quick skills and job readiness, a short-term course is ideal. If you seek in-depth knowledge and long-term career growth, a long-term course is the better choice.
At Uncodemy, we offer both options to meet your needs. Start your journey in data analytics today and open the door to exciting career opportunities. Visit our website or contact us to learn more about our Data Analytics course in delhi.
Your future in data analytics starts here with Uncodemy!
2 notes
·
View notes
Text
Master Big Data with a Comprehensive Databricks Course
A Databricks Course is the perfect way to master big data analytics and Apache Spark. Whether you are a beginner or an experienced professional, this course helps you build expertise in data engineering, AI-driven analytics, and cloud-based collaboration. You will learn how to work with Spark SQL, Delta Lake, and MLflow to process large datasets and create smart data solutions.
This Databricks Course provides hands-on training with real-world projects, allowing you to apply your knowledge effectively. Learn from industry experts who will guide you through data transformation, real-time streaming, and optimizing data workflows. The course also covers managing both structured and unstructured data, helping you make better data-driven decisions.
By enrolling in this Databricks Course, you will gain valuable skills that are highly sought after in the tech industry. Engage with specialists and improve your ability to handle big data analytics at scale. Whether you want to advance your career or stay ahead in the fast-growing data industry, this course equips you with the right tools.
🚀 Enroll now and start your journey toward mastering big data analytics with Databricks!
2 notes
·
View notes
Text

Wielding Big Data Using PySpark
Introduction to PySpark
PySpark is the Python API for Apache Spark, a distributed computing framework designed to process large-scale data efficiently. It enables parallel data processing across multiple nodes, making it a powerful tool for handling massive datasets.
Why Use PySpark for Big Data?
Scalability: Works across clusters to process petabytes of data.
Speed: Uses in-memory computation to enhance performance.
Flexibility: Supports various data formats and integrates with other big data tools.
Ease of Use: Provides SQL-like querying and DataFrame operations for intuitive data handling.
Setting Up PySpark
To use PySpark, you need to install it and set up a Spark session. Once initialized, Spark allows users to read, process, and analyze large datasets.
Processing Data with PySpark
PySpark can handle different types of data sources such as CSV, JSON, Parquet, and databases. Once data is loaded, users can explore it by checking the schema, summary statistics, and unique values.
Common Data Processing Tasks
Viewing and summarizing datasets.
Handling missing values by dropping or replacing them.
Removing duplicate records.
Filtering, grouping, and sorting data for meaningful insights.
Transforming Data with PySpark
Data can be transformed using SQL-like queries or DataFrame operations. Users can:
Select specific columns for analysis.
Apply conditions to filter out unwanted records.
Group data to find patterns and trends.
Add new calculated columns based on existing data.
Optimizing Performance in PySpark
When working with big data, optimizing performance is crucial. Some strategies include:
Partitioning: Distributing data across multiple partitions for parallel processing.
Caching: Storing intermediate results in memory to speed up repeated computations.
Broadcast Joins: Optimizing joins by broadcasting smaller datasets to all nodes.
Machine Learning with PySpark
PySpark includes MLlib, a machine learning library for big data. It allows users to prepare data, apply machine learning models, and generate predictions. This is useful for tasks such as regression, classification, clustering, and recommendation systems.
Running PySpark on a Cluster
PySpark can run on a single machine or be deployed on a cluster using a distributed computing system like Hadoop YARN. This enables large-scale data processing with improved efficiency.
Conclusion
PySpark provides a powerful platform for handling big data efficiently. With its distributed computing capabilities, it allows users to clean, transform, and analyze large datasets while optimizing performance for scalability.
For Free Tutorials for Programming Languages Visit-https://www.tpointtech.com/
2 notes
·
View notes
Text
How-To IT
Topic: Core areas of IT
1. Hardware
• Computers (Desktops, Laptops, Workstations)
• Servers and Data Centers
• Networking Devices (Routers, Switches, Modems)
• Storage Devices (HDDs, SSDs, NAS)
• Peripheral Devices (Printers, Scanners, Monitors)
2. Software
• Operating Systems (Windows, Linux, macOS)
• Application Software (Office Suites, ERP, CRM)
• Development Software (IDEs, Code Libraries, APIs)
• Middleware (Integration Tools)
• Security Software (Antivirus, Firewalls, SIEM)
3. Networking and Telecommunications
• LAN/WAN Infrastructure
• Wireless Networking (Wi-Fi, 5G)
• VPNs (Virtual Private Networks)
• Communication Systems (VoIP, Email Servers)
• Internet Services
4. Data Management
• Databases (SQL, NoSQL)
• Data Warehousing
• Big Data Technologies (Hadoop, Spark)
• Backup and Recovery Systems
• Data Integration Tools
5. Cybersecurity
• Network Security
• Endpoint Protection
• Identity and Access Management (IAM)
• Threat Detection and Incident Response
• Encryption and Data Privacy
6. Software Development
• Front-End Development (UI/UX Design)
• Back-End Development
• DevOps and CI/CD Pipelines
• Mobile App Development
• Cloud-Native Development
7. Cloud Computing
• Infrastructure as a Service (IaaS)
• Platform as a Service (PaaS)
• Software as a Service (SaaS)
• Serverless Computing
• Cloud Storage and Management
8. IT Support and Services
• Help Desk Support
• IT Service Management (ITSM)
• System Administration
• Hardware and Software Troubleshooting
• End-User Training
9. Artificial Intelligence and Machine Learning
• AI Algorithms and Frameworks
• Natural Language Processing (NLP)
• Computer Vision
• Robotics
• Predictive Analytics
10. Business Intelligence and Analytics
• Reporting Tools (Tableau, Power BI)
• Data Visualization
• Business Analytics Platforms
• Predictive Modeling
11. Internet of Things (IoT)
• IoT Devices and Sensors
• IoT Platforms
• Edge Computing
• Smart Systems (Homes, Cities, Vehicles)
12. Enterprise Systems
• Enterprise Resource Planning (ERP)
• Customer Relationship Management (CRM)
• Human Resource Management Systems (HRMS)
• Supply Chain Management Systems
13. IT Governance and Compliance
• ITIL (Information Technology Infrastructure Library)
• COBIT (Control Objectives for Information Technologies)
• ISO/IEC Standards
• Regulatory Compliance (GDPR, HIPAA, SOX)
14. Emerging Technologies
• Blockchain
• Quantum Computing
• Augmented Reality (AR) and Virtual Reality (VR)
• 3D Printing
• Digital Twins
15. IT Project Management
• Agile, Scrum, and Kanban
• Waterfall Methodology
• Resource Allocation
• Risk Management
16. IT Infrastructure
• Data Centers
• Virtualization (VMware, Hyper-V)
• Disaster Recovery Planning
• Load Balancing
17. IT Education and Certifications
• Vendor Certifications (Microsoft, Cisco, AWS)
• Training and Development Programs
• Online Learning Platforms
18. IT Operations and Monitoring
• Performance Monitoring (APM, Network Monitoring)
• IT Asset Management
• Event and Incident Management
19. Software Testing
• Manual Testing: Human testers evaluate software by executing test cases without using automation tools.
• Automated Testing: Use of testing tools (e.g., Selenium, JUnit) to run automated scripts and check software behavior.
• Functional Testing: Validating that the software performs its intended functions.
• Non-Functional Testing: Assessing non-functional aspects such as performance, usability, and security.
• Unit Testing: Testing individual components or units of code for correctness.
• Integration Testing: Ensuring that different modules or systems work together as expected.
• System Testing: Verifying the complete software system’s behavior against requirements.
• Acceptance Testing: Conducting tests to confirm that the software meets business requirements (including UAT - User Acceptance Testing).
• Regression Testing: Ensuring that new changes or features do not negatively affect existing functionalities.
• Performance Testing: Testing software performance under various conditions (load, stress, scalability).
• Security Testing: Identifying vulnerabilities and assessing the software’s ability to protect data.
• Compatibility Testing: Ensuring the software works on different operating systems, browsers, or devices.
• Continuous Testing: Integrating testing into the development lifecycle to provide quick feedback and minimize bugs.
• Test Automation Frameworks: Tools and structures used to automate testing processes (e.g., TestNG, Appium).
19. VoIP (Voice over IP)
VoIP Protocols & Standards
• SIP (Session Initiation Protocol)
• H.323
• RTP (Real-Time Transport Protocol)
• MGCP (Media Gateway Control Protocol)
VoIP Hardware
• IP Phones (Desk Phones, Mobile Clients)
• VoIP Gateways
• Analog Telephone Adapters (ATAs)
• VoIP Servers
• Network Switches/ Routers for VoIP
VoIP Software
• Softphones (e.g., Zoiper, X-Lite)
• PBX (Private Branch Exchange) Systems
• VoIP Management Software
• Call Center Solutions (e.g., Asterisk, 3CX)
VoIP Network Infrastructure
• Quality of Service (QoS) Configuration
• VPNs (Virtual Private Networks) for VoIP
• VoIP Traffic Shaping & Bandwidth Management
• Firewall and Security Configurations for VoIP
• Network Monitoring & Optimization Tools
VoIP Security
• Encryption (SRTP, TLS)
• Authentication and Authorization
• Firewall & Intrusion Detection Systems
• VoIP Fraud DetectionVoIP Providers
• Hosted VoIP Services (e.g., RingCentral, Vonage)
• SIP Trunking Providers
• PBX Hosting & Managed Services
VoIP Quality and Testing
• Call Quality Monitoring
• Latency, Jitter, and Packet Loss Testing
• VoIP Performance Metrics and Reporting Tools
• User Acceptance Testing (UAT) for VoIP Systems
Integration with Other Systems
• CRM Integration (e.g., Salesforce with VoIP)
• Unified Communications (UC) Solutions
• Contact Center Integration
• Email, Chat, and Video Communication Integration
2 notes
·
View notes
Text
What is a Data Pipeline?
What is Data Pipeline? #sql #database #language #query #schema #ddl #dml#analytics #engineering #distributedcomputing #dataengineering #science #news #technology #data #trends #tech #hadoop #spark #hdfs #bigdata
A data pipeline is a process that extracts data from various sources, transforms it into a suitable format, and is loaded to a data warehouse or other data storage layer. Data pipelines are an integral part of Data engineering that produces data suitable for data owners or downstream users to analyze and produce and business-ready datasets to consume. It enables organizations to collect, store,…
View On WordPress
0 notes
Text
[Python] PySpark to M, SQL or Pandas
Hace tiempo escribí un artículo sobre como escribir en pandas algunos códigos de referencia de SQL o M (power query). Si bien en su momento fue de gran utilidad, lo cierto es que hoy existe otro lenguaje que representa un fuerte pie en el análisis de datos.
Spark se convirtió en el jugar principal para lectura de datos en Lakes. Aunque sea cierto que existe SparkSQL, no quise dejar de traer estas analogías de código entre PySpark, M, SQL y Pandas para quienes estén familiarizados con un lenguaje, puedan ver como realizar una acción con el otro.
Lo primero es ponernos de acuerdo en la lectura del post.
Power Query corre en capas. Cada linea llama a la anterior (que devuelve una tabla) generando esta perspectiva o visión en capas. Por ello cuando leamos en el código #“Paso anterior” hablamos de una tabla.
En Python, asumiremos a "df" como un pandas dataframe (pandas.DataFrame) ya cargado y a "spark_frame" a un frame de pyspark cargado (spark.read)
Conozcamos los ejemplos que serán listados en el siguiente orden: SQL, PySpark, Pandas, Power Query.
En SQL:
SELECT TOP 5 * FROM table
En PySpark
spark_frame.limit(5)
En Pandas:
df.head()
En Power Query:
Table.FirstN(#"Paso Anterior",5)
Contar filas
SELECT COUNT(*) FROM table1
spark_frame.count()
df.shape()
Table.RowCount(#"Paso Anterior")
Seleccionar filas
SELECT column1, column2 FROM table1
spark_frame.select("column1", "column2")
df[["column1", "column2"]]
#"Paso Anterior"[[Columna1],[Columna2]] O podría ser: Table.SelectColumns(#"Paso Anterior", {"Columna1", "Columna2"} )
Filtrar filas
SELECT column1, column2 FROM table1 WHERE column1 = 2
spark_frame.filter("column1 = 2") # OR spark_frame.filter(spark_frame['column1'] == 2)
df[['column1', 'column2']].loc[df['column1'] == 2]
Table.SelectRows(#"Paso Anterior", each [column1] == 2 )
Varios filtros de filas
SELECT * FROM table1 WHERE column1 > 1 AND column2 < 25
spark_frame.filter((spark_frame['column1'] > 1) & (spark_frame['column2'] < 25)) O con operadores OR y NOT spark_frame.filter((spark_frame['column1'] > 1) | ~(spark_frame['column2'] < 25))
df.loc[(df['column1'] > 1) & (df['column2'] < 25)] O con operadores OR y NOT df.loc[(df['column1'] > 1) | ~(df['column2'] < 25)]
Table.SelectRows(#"Paso Anterior", each [column1] > 1 and column2 < 25 ) O con operadores OR y NOT Table.SelectRows(#"Paso Anterior", each [column1] > 1 or not ([column1] < 25 ) )
Filtros con operadores complejos
SELECT * FROM table1 WHERE column1 BETWEEN 1 and 5 AND column2 IN (20,30,40,50) AND column3 LIKE '%arcelona%'
from pyspark.sql.functions import col spark_frame.filter( (col('column1').between(1, 5)) & (col('column2').isin(20, 30, 40, 50)) & (col('column3').like('%arcelona%')) ) # O spark_frame.where( (col('column1').between(1, 5)) & (col('column2').isin(20, 30, 40, 50)) & (col('column3').contains('arcelona')) )
df.loc[(df['colum1'].between(1,5)) & (df['column2'].isin([20,30,40,50])) & (df['column3'].str.contains('arcelona'))]
Table.SelectRows(#"Paso Anterior", each ([column1] > 1 and [column1] < 5) and List.Contains({20,30,40,50}, [column2]) and Text.Contains([column3], "arcelona") )
Join tables
SELECT t1.column1, t2.column1 FROM table1 t1 LEFT JOIN table2 t2 ON t1.column_id = t2.column_id
Sería correcto cambiar el alias de columnas de mismo nombre así:
spark_frame1.join(spark_frame2, spark_frame1["column_id"] == spark_frame2["column_id"], "left").select(spark_frame1["column1"].alias("column1_df1"), spark_frame2["column1"].alias("column1_df2"))
Hay dos funciones que pueden ayudarnos en este proceso merge y join.
df_joined = df1.merge(df2, left_on='lkey', right_on='rkey', how='left') df_joined = df1.join(df2, on='column_id', how='left')Luego seleccionamos dos columnas df_joined.loc[['column1_df1', 'column1_df2']]
En Power Query vamos a ir eligiendo una columna de antemano y luego añadiendo la segunda.
#"Origen" = #"Paso Anterior"[[column1_t1]] #"Paso Join" = Table.NestedJoin(#"Origen", {"column_t1_id"}, table2, {"column_t2_id"}, "Prefijo", JoinKind.LeftOuter) #"Expansion" = Table.ExpandTableColumn(#"Paso Join", "Prefijo", {"column1_t2"}, {"Prefijo_column1_t2"})
Group By
SELECT column1, count(*) FROM table1 GROUP BY column1
from pyspark.sql.functions import count spark_frame.groupBy("column1").agg(count("*").alias("count"))
df.groupby('column1')['column1'].count()
Table.Group(#"Paso Anterior", {"column1"}, {{"Alias de count", each Table.RowCount(_), type number}})
Filtrando un agrupado
SELECT store, sum(sales) FROM table1 GROUP BY store HAVING sum(sales) > 1000
from pyspark.sql.functions import sum as spark_sum spark_frame.groupBy("store").agg(spark_sum("sales").alias("total_sales")).filter("total_sales > 1000")
df_grouped = df.groupby('store')['sales'].sum() df_grouped.loc[df_grouped > 1000]
#”Grouping” = Table.Group(#"Paso Anterior", {"store"}, {{"Alias de sum", each List.Sum([sales]), type number}}) #"Final" = Table.SelectRows( #"Grouping" , each [Alias de sum] > 1000 )
Ordenar descendente por columna
SELECT * FROM table1 ORDER BY column1 DESC
spark_frame.orderBy("column1", ascending=False)
df.sort_values(by=['column1'], ascending=False)
Table.Sort(#"Paso Anterior",{{"column1", Order.Descending}})
Unir una tabla con otra de la misma característica
SELECT * FROM table1 UNION SELECT * FROM table2
spark_frame1.union(spark_frame2)
En Pandas tenemos dos opciones conocidas, la función append y concat.
df.append(df2) pd.concat([df1, df2])
Table.Combine({table1, table2})
Transformaciones
Las siguientes transformaciones son directamente entre PySpark, Pandas y Power Query puesto que no son tan comunes en un lenguaje de consulta como SQL. Puede que su resultado no sea idéntico pero si similar para el caso a resolver.
Analizar el contenido de una tabla
spark_frame.summary()
df.describe()
Table.Profile(#"Paso Anterior")
Chequear valores únicos de las columnas
spark_frame.groupBy("column1").count().show()
df.value_counts("columna1")
Table.Profile(#"Paso Anterior")[[Column],[DistinctCount]]
Generar Tabla de prueba con datos cargados a mano
spark_frame = spark.createDataFrame([(1, "Boris Yeltsin"), (2, "Mikhail Gorbachev")], inferSchema=True)
df = pd.DataFrame([[1,2],["Boris Yeltsin", "Mikhail Gorbachev"]], columns=["CustomerID", "Name"])
Table.FromRecords({[CustomerID = 1, Name = "Bob", Phone = "123-4567"]})
Quitar una columna
spark_frame.drop("column1")
df.drop(columns=['column1']) df.drop(['column1'], axis=1)
Table.RemoveColumns(#"Paso Anterior",{"column1"})
Aplicar transformaciones sobre una columna
spark_frame.withColumn("column1", col("column1") + 1)
df.apply(lambda x : x['column1'] + 1 , axis = 1)
Table.TransformColumns(#"Paso Anterior", {{"column1", each _ + 1, type number}})
Hemos terminado el largo camino de consultas y transformaciones que nos ayudarían a tener un mejor tiempo a puro código con PySpark, SQL, Pandas y Power Query para que conociendo uno sepamos usar el otro.
#spark#pyspark#python#pandas#sql#power query#powerquery#notebooks#ladataweb#data engineering#data wrangling#data cleansing
0 notes
Link
0 notes