#statistics vs data science
Explore tagged Tumblr posts
Visit Tumblr Blog
Explore Tumblr blogs with no restrictions, modern design and the best experience.
Last Seen Tumblr Blogs


Fun Fact
Tumblr was the first site to host the blog for President Barack Obama in 2011.
Text

My fan made Animation vs Coding part 2
Do you think stick figure AI would "assume" data type of all number to be float, double, or decimal?
...What? This is not a well-known fun fact outside STEM community?
So many people have this problem, someone made a whole webpage explaining it.
More organic explanation here; Defining a right data type is a big deal in programming. At least the programmer who manually assign it float/double would know why it went wrong.
JavaScript, however, will automatically assign an appropriate data type, and is advertised to be more beginner-friendly... Can you see why this became a meme?
0.1 and 0.2 will be considered double data type, which can't be accurate expressed in base 2.
There is only (1/2), (1/4), (1/8), ... ,(1/(2 power n)) in base 2.
It can't accurately express (1/10 and 2/10), but it still makes a very good approximation. That is why it is only 0.00000000000000004 off.
This is why in most statistic analysis and calculator use decimal data type. Or banking uses fixed-point numbers data. They both have their limitation; Decimal requires more computing power, which mean more specialized device. While fixed-point works fine with money because it's transferring money, not doing maths. It would never have to deal with 0.3333333... dollar.
Do you know what language is from the same family as JavaScript? That's right, it's Flash's programming language, ActionScript.
I told you my Computer Science grade was horrid, but this is very basic, so I am more confident explaining it.
#animation vs education#ava/m#ave#alan becker#animator vs animation#animation vs coding#wdragon work#sketch#ava yellow#ava orange#ava tsc#ava tco#ava alan becker#ava noogai#ava the chosen one#ava the second coming
117 notes
·
View notes
Text
For science and data analysis: a member of the @lesmisletters server has created a survey on which Les Mis characters "fuck" vs "Slay." Fill out the survey to help us get an empirical picture of these important statistics.
100 notes
·
View notes
Text
Here are the key points of this study:
6.08 million more deaths occurred in 2021 than in 2020, despite widespread COVID-19 vaccination.
Mortality rate among vaccinated individuals was 14.5% higher than among unvaccinated individuals.
If vaccines saved 14 million lives in 2021 as Watson et al claims, total deaths should have decreased, but instead, deaths increased.
Studies claiming vaccines saved lives rely on theoretical models, not direct statistical comparisons of vaccinated vs. unvaccinated mortality rates.
Negative correlation observed between vaccination rates and mortality in 37 countries.
Public health institutions refused to conduct proper comparisons of vaccinated vs. unvaccinated mortality rates.
Claims of lives saved by vaccination are based on assumptions, not statistical validation.
Set theory analysis suggests "saved lives" exist only in models, not in real-world mortality data.
As the study concludes,
Theoretical models of how many lives were saved with COVID-19 vaccination without statistical support have no scientific validity and represent a methodological fiasco of public health science. A rigorous and transparent approach to public health science is necessary to ensure that policies and medical interventions are guided by objective data rather than theoretical assumptions.
So, the next time Dr. Peter Hotez claims COVID-19 vaccines saved millions of lives, you’ll know it’s nothing but propaganda disguised as science:
13 notes
·
View notes
Note
I’ve seen many trans activists compare the sudden upsurge in trans-identifying youth with the infamous ‘left-handed phenomenon’ wherein the rates of left-handedness rose after people stopped associating left-handedness with demonic or satanic affiliation.
Is this a fair comparison? What are the similarities and differences between the upsurge in trans-identifying people and the aforementioned upsurge in left-handedness?
Hello!
While looking into this, I found someone else had already written something on this [1].
Their write up was very good, so I've linked to it above. There's a couple parts I don't completely agree with, but overall it's an excellent explanation of why this isn't a reasonable comparison.
(I found the comparison between their treatment of the left-handedness graph and right-wing treatment of climate change graphs particularly striking.)
The short summary: The graph of left-handedness that is used to make this comparison is:
Truncated/incomplete (i.e., cuts off the first part of the graph to distort the message, similar to climate-change denial-ists truncate temperature change graphs)
Ignores explainable factors for the change in handedness (e.g., the industrial revolution) and attributes everything to a single cause (i.e., discriminatory stereotypes)
Depicts a much smaller increase (~200% vs ~2500%) over a longer time period (~50 years vs ~10 years)
Is essentially a hypothesis (i.e., there's very little hard data, and even less representative data)
All in all, this is not a fair comparison. It's an example of how people misrepresent data/science/statistics to support their world view. (And how that misinformation spreads.)
Other data supporting the sharp increase in children referred for gender dysphoria includes:
This German article [2] documents an overall 8-fold increase (with a 12-fold increase for adolescent girls) over ~10 years
In Sweden [3] there has been 20-fold increase in gender identity diagnoses in people younger than 20 over 10 years
This systemic review [4] found that "based on 38 papers meeting inclusion criteria, there is evidence of an increase in frequency of presentation to services since 2011, and of a shift in the natal sex of referred cases: those assigned female at birth are now in the majority." This review covered 12 countries, but there are some important limitations discussed in the paper.
Highlights from the linked article:
"This analogy fails badly because we’re talking about vastly different populations, changing at vastly different rates, over vastly different timescales, making actual direct comparisons impossible."
"[An advocates for this explanation] has pointed at some random property, asserted it has fluctuated over time, given a superficial and incomplete reason why, and then asserted that a completely different thing must therefore be changing for the same reason, therefore there’s nothing to worry about ... when confronted with graphs showing the rapid rise in global temperature in recent decades, those who sought to minimise the severity of climate change and humanity’s need to do anything about it did exactly the same thing."
"The change in left-handedness was ~80% over 20 years, in comparison referrals to GIDS over the last 10 years have gone up around 6000% in girls, and 2000% in boys."
"Tiny in absolute numbers but the rate of change is vastly different, is different across sexes, is the subject of huge attention and celebration in schools and throughout media, shows absolutely no sign of plateauing, and - unlike handedness - is being medicalised, with potentially huge personal consequences. There are clear and glaring differences that a glib comparison to handedness simply can’t explain."
Issues I want to mention:
This is actually explicitly addressed in the article, but I just want to highlight, that attempting to compare world-wide data/hypothesis to gender clinic referrals in Europe is ... iffy.
I think the numbers reported (re: the above highlights) are slightly misleading. A better summary would be the one I provided in my summary (~200% in 50 years vs ~2400% in 10 years).
The article attempts to graph the gender clinic data on the same time scale as the handedness data, but, in doing so, are replicating the same issue underlying the handedness graph (over-reliance on hypothesis over data). I understand their goal here, but the graph they produce is misleading (i.e., we cannot reliably extrapolate past the data time frame we have).
The article (to a degree) and more so the twitter thread they linked appear to be arguing that because there was a reason for everything to be created for right-handed people (industrial revolution, mass production, etc.) it wasn't a case of discrimination. I don't really agree with this. That is, I think the fact that much of the modern world has been designed around right-handedness is unfair to left-handed people, even if there's a practical reason for the design.
Reference:
Void if Removed. The Left Hand of Daftness. 11 Nov. 2022, https://web.archive.org/web/20230501044319/https://www.voidifremoved.co.uk/p/the-left-hand-of-daftness
Bachmann, Christian J., et al. “Gender Identity Disorders among Young People in Germany: Prevalence and Trends, 2013–2022. An Analysis of Nationwide Routine Insurance Data.” Deutsches Ärzteblatt International, May 2024. DOI.org (Crossref), https://doi.org/10.3238/arztebl.m2024.0098.
Landen, Mikael. “[Dramatic increase in adolescent gender dysphoria requires careful consideration].” Lakartidningen, vol. 116, Oct. 2019, p. FSMH.
Thompson, Lucy, et al. “A PRISMA Systematic Review of Adolescent Gender Dysphoria Literature: 1) Epidemiology.” PLOS Global Public Health, vol. 2, no. 3, Mar. 2022, p. e0000245. PLoS Journals, https://doi.org/10.1371/journal.pgph.0000245.
18 notes
·
View notes
Note
Hi! Potentially a bit of a random question but I seem to have the idea in my mind that your wife has studied linguistics. I’m seriously considering applying to do French and Linguistics at uni and I was wondering if she had any thoughts or advice? The course allows people to apply having solely studied French so I don’t have much linguistic experience but I’m really interested by it and I don’t know any other linguists irl haha. I completely understand if not! Have a good day xx
she majored in both those things!
she also studied abroad in 3 different countries bc her program allowed her to and that was fantastic, not only for the experience itself but also for getting jobs later -- the job she's in now hired her with less direct related experience in part because they liked that she'd gone to different countries and done stuff while over there (ok she gave me the direct quote from the hiring manager "we had to meet with the person who had this background")
i'm speaking for her a bit rn bc she's napping but MY two cents is that i feel like people are like "teach" or "be a translator" but they're not the only jobs you can do with it -- one of the fastest growing careers right now is speech therapy/communicative disorders, whether it's developmental (kids) or helping people post-TBI / stroke or seniors with aphasia or more audiology focused but that's linguistics baby! (you totally can do translation, one of my friends works at nintendo doing english localizations but i feel like that's the one everyone thinks of and there's other stuff if it's not your jam)
OKAY SHE'S AWAKE i'm going to take notes while she thought-dumps under the cut
first off, she thinks linguistics is awesome, good on ya! she actually majored in french and japanese and didn't figure out the linguistics until the very last year, so she had to come back for another degree after working for a few years
linguistics is a very cool interdisciplinary field with lots of branches that intersect with many other things -- if you like a particular branch and you want to pursue it, take the electives that connect with that branch (e.g. she took psycholinguistics and cognitive science) which will give you good sense of it and help you if you want to explore more in it later on
when you do your language requirement, she recommends picking up one that's different to english or french in a significant way -- it'll help you wrap your head around different concepts if you speak or are learning a language that has those things (e.g. Japanese is subject-object-verb vs english/french subject-verb-object)
she VERY much recommends non-european languages in general ("tho there is cool shit in european languages too, like basque")
she is curious whether this is a double French major + Linguistics major OR a French linguistics major -- she recommends the first rather than the second, she has been in the second (while studying abroad) and finds that the language tends to colour the linguistics rather than studying cross-linguistically. so if you have the choice she does recommend the two separate majors if you can get it
linguistics is more maths than she expected -- you don't need to do a lot of calculations (unless you want to! you can get very mathsy if you want with quantitative or computational linguistics) but you're looking for trends so you do need to understand data and statistics, and in the higher levels stuff like plotting sentences and sentence diagramming involves way more equations. with that being said, my wife who has a math LD and had a really hard tim e with math in school turned out to LOVE it; it took her a bit to wrap her head around how things worked at first but it blew her mind and she has a huge appreciation for the breadth of the field (if you're from a science background then disregard hahaha)
linguistics intersects with psychology and science in a very cool way that she says also helped her understand some of the hard-science stuff
LEARN THE INTERNATIONAL PHONETIC ALPHABET -- you have to, it's a requirement, but get on that because it's important; she's obsessed with it, right now i actually need to pause bc she's explaining the layout of the chart to me (it's arranged by place of articulation) but for you i'm going to link it instead
this is a bit off topic and maybe not relevant and also obviously a personal choice regardless but she says if you suspect you have a learning disability and it has not been diagnosed, get it diagnosed, if you don't need to be doing that at 30 it's much easier lol
her username on here is @linguafranka if you want to add her / DM / continue convos! she loves to talk linguistics pretty much any time
6 notes
·
View notes
Text
Why I Love Studying at Sabaragamuwa University
🌿 Hey Tumblr fam! I just wanted to take a moment to share something close to my heart — my experience at Sabaragamuwa University of Sri Lanka, a place that’s more than just classrooms and assignments. It's where I found peace, passion, and purpose. 💚
🌄 A Hidden Gem in the Hills
Imagine studying on a campus surrounded by misty hills, green forests, and natural waterfalls. Sounds dreamy, right? Well, that’s exactly what SUSL in Belihuloya feels like. The air is fresh, the environment is peaceful, and nature literally whispers encouragement while you study. 😌🍃

📌 Location: Belihuloya, Sri Lanka 🔗 Official Website of SUSL
💻 My Faculty: Computing
As a proud student of the Faculty of Computing, I can honestly say that SUSL is more than qualified when it comes to academic excellence. 💯
Our professors are not just knowledgeable—they actually care. We work on cool projects, explore real-world tech, and even get support for internships and future careers.
?
👩💻 Tech, Talent & Tenacity
You might be surprised, but SUSL is seriously catching up with the tech world.
Let me break it down for you—our Faculty of Computing is organized into three departments, and each one opens up different futures:
🖥️ Department of Computing and Information Systems (CIS)
A great fit if you're interested in IT infrastructure, system design, software, and business applications
You learn how tech supports and transforms businesses, governments, and society
🛠️ Department of Software Engineering (SE)
Perfect if you love to build software from the ground up
Focuses on software architecture, testing, DevOps, and full development lifecycles
📊 Department of Data Science (DS)
The department of the future! 🌐
Teaches you how to work with big data, machine learning, AI, statistics, and more
If you like solving puzzles with data, this is your world
No matter which path you choose, you’ll get:
Modern course content aligned with global tech trends
Hands-on labs and access to real tools (GitHub, Python, VS Code, cloud platforms, etc.)
Internships with leading IT companies
Final-year projects that are often built with startups or community needs in mind
Some of my seniors are now working at top companies, others are doing research abroad—that’s the kind of transformation this faculty creates. 🙌
For more information: click here
🫶 Why SUSL Feels Like Home
Here’s a little list of what I adore about life here:
Friendly community – always someone to help you out
Calm campus – no traffic noise, just birds and waterfalls
Opportunities – tons of events, workshops, clubs
Affordable – both the university and the area are budget-friendly
Balance – education + mental wellness = perfect combo
🌐 Not Just a University – A Lifestyle
Sabaragamuwa University doesn't just prepare you for a career; it shapes you as a human being. It’s not all books and exams—we grow, we laugh, we support each other.
Whether you’re into tech, social sciences, management, or agriculture, there’s a faculty that fits your vibe.
✨ Learn more about SUSL here
💬 Final Thoughts
If you're thinking about studying in Sri Lanka, or even just curious about a different kind of university experience, I highly recommend checking out Sabaragamuwa University. It changed my life in the best way.
💚 Tag a friend who needs to hear about this gem! 📥 DM me if you want tips about the application process or student life here!
#SabaragamuwaUniversity#SUSL#SriLanka#CampusLife#UniversityExperience#StudentVibes#Belihuloya#HigherEducation#SriLankaUniversities#FacultyOfComputing
2 notes
·
View notes
Text
By: Patrice Onwuka
Published: Mar 25, 2025
There is no gender pay gap. This is a simple truth hidden from generations of women because it contradicts the Left’s narrative about victimhood in the workforce. Without the pay gap, their gender-equity policy proposals are obsolete. However, data prove that career and lifestyle choices drive the differential between the average earnings of men and women. Change the choices, you’ll close the gap.
Equal Pay Day is as fabricated as the pay gap itself. As the fable goes, Equal Pay Day symbolizes how far into the year women must work to match men’s earnings in the previous year. In 2025, the faux holiday falls on March 25th. Coincidentally, this is during Women’s History Month, when we collectively celebrate the progress of American women.
According to the Bureau of Labor Statistics, women’s earnings were 83.6% of men’s in 2023. Put another way, women earn about 84 cents on the dollar that men earn. This 16-cent pay gap is commonly attributed to gender discrimination.
This a grossly misleading tactic to trick women into thinking that they are unfairly underpaid because of their sex. There’s more to the story. The BLS notes, “These comparisons of earnings are on a broad level and do not control for many factors that may be important in explaining earnings differences.”
When controlled for factors that impact paychecks (such as occupation, job level, experience, job title, education, hours worked, etc.), the pay gap disappears. Examining these choices reveals how preferences lead to very different outcomes between the sexes.
First, time. Men work full-time more than women (72% vs. 67%); women comprise a greater share of part-time workers. Also, men work more hours per day than women (8.3 hours on average vs. 8 hours). Even women employed full-time are more likely than men to say they would rather work part-time.
Next, education and field of study. While it’s true that women accumulate more post-secondary degrees than men, they opt for low-paying fields of study. According to the National Center for Education Statistics, women earned 62.8% of associate degrees, 58.5% of bachelor’s degrees, 62.6% of master’s degrees, and 57% of doctoral degrees. The degree gap between young women and men began in the mid-1990s and has only widened over time.
Degrees do not necessarily translate into wealth. Women predominantly major in fields that lead them into lower-paid occupations such as humanities, education, and social sciences; and they are underrepresented in higher-paying fields. Occupations with the largest shares of women include childcare workers, preschool teachers, administrative assistants, and medical and dental assistants. While these jobs may offer non-financial benefits such as satisfaction, enjoyment, alignment with interests, community service, and better working conditions, the tradeoff is in earnings. Students strike this bargain when they choose majors.
Third, and often overlooked, dangerousness. Overwhelmingly men take on dirty and hazardous jobs that also carry higher pay. Women accounted for just 8.5% of all work-related fatalities in the U.S. In two of the three most fatal jobs (logging and roofing), women comprised less than 10% of those workforces (9% and 4.1%, respectively).
Additionally, caregiving. Motherhood is the overarching motivator behind the choices women make. There’s virtually no pay gap for young workers. Single, childless women outearn their male counterparts. The wage gap begins to widen around age 25, likely due to choices about family roles.
Women disproportionately choose occupations and career tracks that are less demanding or offer more flexibility. In a 2017 New York Federal Reserve report, economists found that, on average, women are more willing to pursue jobs with greater work flexibility and job stability. Conversely, men are more willing to chase higher earnings growth. Furthermore, they concluded that preferences in college majors and job choices account for an astonishing 25% of the gender wage gap.
Even in high-paying medical practice, a study of career choices for aspiring doctors found that more female medical students were drawn to specialties offering lower workloads and low-risk work than male students. The preference for lifestyle over income attracted far more women to family medicine while men opted for orthopedic surgery.
Sex discrimination in employment and pay is wrong and already illegal, thanks to the Equal Pay Act (1963) and Title VII of the 1964 Civil Rights Act. More legislation or regulation from Washington will not fix what is not broken.
Yet, leftist policymakers have tried and failed to make women act more like men. Pay transparency legislation was passed in 2022 and still did not close the pay gap. The Paycheck Fairness Act, proposed each year, would only serve to enrich the pockets of trial lawyers—who are overwhelmingly male—as they chase class-action lawsuits.
Meanwhile, when employers are forced or shamed into proving that they do not pay men and women differently, they will be less likely to negotiate flexibility and other benefits that female employees value.
Tradeoffs are not punishments. Women who make choices that reflect their desire for motherhood, fulfillment, or other priorities over earnings are not being penalized. We must accept women’s employment preferences and acknowledge that an abundance of opportunities and choices signals real progress.
--


3 notes
·
View notes
Text
Business Analytics vs. Data Science: Understanding the Key Differences

In today's data-driven world, terms like "business analytics" and "data science" are often used interchangeably. However, while they share a common goal of extracting insights from data, they are distinct fields with different focuses and methodologies. Let's break down the key differences to help you understand which path might be right for you.
Business Analytics: Focusing on the Present and Past
Business analytics primarily focuses on analyzing historical data to understand past performance and inform current business decisions. It aims to answer questions like:
What happened?
Why did it happen?
What is happening now?
Key characteristics of business analytics:
Descriptive and Diagnostic: It uses techniques like reporting, dashboards, and data visualization to summarize and explain past trends.
Structured Data: It often works with structured data from databases and spreadsheets.
Business Domain Expertise: A strong understanding of the specific business domain is crucial.
Tools: Business analysts typically use tools like Excel, SQL, Tableau, and Power BI.
Focus: Optimizing current business operations and improving efficiency.
Data Science: Predicting the Future and Building Models
Data science, on the other hand, focuses on building predictive models and developing algorithms to forecast future outcomes. It aims to answer questions like:
What will happen?
How can we make it happen?
Key characteristics of data science:
Predictive and Prescriptive: It uses machine learning, statistical modeling, and AI to predict future trends and prescribe optimal actions.
Unstructured and Structured Data: It can handle both structured and unstructured data from various sources.
Technical Proficiency: Strong programming skills (Python, R) and a deep understanding of machine learning algorithms are essential.
Tools: Data scientists use programming languages, machine learning libraries, and big data technologies.
Focus: Developing innovative solutions, building AI-powered products, and driving long-term strategic initiatives.
Key Differences Summarized:

Which Path is Right for You?
Choose Business Analytics if:
You are interested in analyzing past data to improve current business operations.
You have a strong understanding of a specific business domain.
You prefer working with structured data and using visualization tools.
Choose Data Science if:
You are passionate about building predictive models and developing AI-powered solutions.
You have a strong interest in programming and machine learning.
You enjoy working with both structured and unstructured data.
Xaltius Academy's Data Science & AI Course:
If you're leaning towards data science and want to delve into machine learning and AI, Xaltius Academy's Data Science & AI course is an excellent choice. This program equips you with the necessary skills and knowledge to become a proficient data scientist, covering essential topics like:
Python programming
Machine learning algorithms
Data visualization
And much more!
By understanding the distinct roles of business analytics and data science, you can make an informed decision about your career path and leverage the power of data to drive success.
2 notes
·
View notes
Text
The Philosophy of Statistics
The philosophy of statistics explores the foundational, conceptual, and epistemological questions surrounding the practice of statistical reasoning, inference, and data interpretation. It deals with how we gather, analyze, and draw conclusions from data, and it addresses the assumptions and methods that underlie statistical procedures. Philosophers of statistics examine issues related to probability, uncertainty, and how statistical findings relate to knowledge and reality.
Key Concepts:
Probability and Statistics:
Frequentist Approach: In frequentist statistics, probability is interpreted as the long-run frequency of events. It is concerned with making predictions based on repeated trials and often uses hypothesis testing (e.g., p-values) to make inferences about populations from samples.
Bayesian Approach: Bayesian statistics, on the other hand, interprets probability as a measure of belief or degree of certainty in an event, which can be updated as new evidence is obtained. Bayesian inference incorporates prior knowledge or assumptions into the analysis and updates it with data.
Objectivity vs. Subjectivity:
Objective Statistics: Objectivity in statistics is the idea that statistical methods should produce results that are independent of the individual researcher’s beliefs or biases. Frequentist methods are often considered more objective because they rely on observed data without incorporating subjective priors.
Subjective Probability: In contrast, Bayesian statistics incorporates subjective elements through prior probabilities, meaning that different researchers can arrive at different conclusions depending on their prior beliefs. This raises questions about the role of subjectivity in science and how it affects the interpretation of statistical results.
Inference and Induction:
Statistical Inference: Philosophers of statistics examine how statistical methods allow us to draw inferences from data about broader populations or phenomena. The problem of induction, famously posed by David Hume, applies here: How can we justify making generalizations about the future or the unknown based on limited observations?
Hypothesis Testing: Frequentist methods of hypothesis testing (e.g., null hypothesis significance testing) raise philosophical questions about what it means to "reject" or "fail to reject" a hypothesis. Critics argue that p-values are often misunderstood and can lead to flawed inferences about the truth of scientific claims.
Uncertainty and Risk:
Epistemic vs. Aleatory Uncertainty: Epistemic uncertainty refers to uncertainty due to lack of knowledge, while aleatory uncertainty refers to inherent randomness in the system. Philosophers of statistics explore how these different types of uncertainty influence decision-making and inference.
Risk and Decision Theory: Statistical analysis often informs decision-making under uncertainty, particularly in fields like economics, medicine, and public policy. Philosophical questions arise about how to weigh evidence, manage risk, and make decisions when outcomes are uncertain.
Causality vs. Correlation:
Causal Inference: One of the most important issues in the philosophy of statistics is the relationship between correlation and causality. While statistics can show correlations between variables, establishing a causal relationship often requires additional assumptions and methods, such as randomized controlled trials or causal models.
Causal Models and Counterfactuals: Philosophers like Judea Pearl have developed causal inference frameworks that use counterfactual reasoning to better understand causation in statistical data. These methods help to clarify when and how statistical models can imply causal relationships, moving beyond mere correlations.
The Role of Models:
Modeling Assumptions: Statistical models, such as regression models or probability distributions, are based on assumptions about the data-generating process. Philosophers of statistics question the validity and reliability of these assumptions, particularly when they are idealized or simplified versions of real-world processes.
Overfitting and Generalization: Statistical models can sometimes "overfit" data, meaning they capture noise or random fluctuations rather than the underlying trend. Philosophical discussions around overfitting examine the balance between model complexity and generalizability, as well as the limits of statistical models in capturing reality.
Data and Representation:
Data Interpretation: Data is often considered the cornerstone of statistical analysis, but philosophers of statistics explore the nature of data itself. How is data selected, processed, and represented? How do choices about measurement, sampling, and categorization affect the conclusions drawn from data?
Big Data and Ethics: The rise of big data has led to new ethical and philosophical challenges in statistics. Issues such as privacy, consent, bias in algorithms, and the use of data in decision-making are central to contemporary discussions about the limits and responsibilities of statistical analysis.
Statistical Significance:
p-Values and Significance: The interpretation of p-values and statistical significance has long been debated. Many argue that the overreliance on p-values can lead to misunderstandings about the strength of evidence, and the replication crisis in science has highlighted the limitations of using p-values as the sole measure of statistical validity.
Replication Crisis: The replication crisis in psychology and other sciences has raised concerns about the reliability of statistical methods. Philosophers of statistics are interested in how statistical significance and reproducibility relate to the notion of scientific truth and the accumulation of knowledge.
Philosophical Debates:
Frequentism vs. Bayesianism:
Frequentist and Bayesian approaches to statistics represent two fundamentally different views on the nature of probability. Philosophers debate which approach provides a better framework for understanding and interpreting statistical evidence. Frequentists argue for the objectivity of long-run frequencies, while Bayesians emphasize the flexibility and adaptability of probabilistic reasoning based on prior knowledge.
Realism and Anti-Realism in Statistics:
Is there a "true" probability or statistical model underlying real-world phenomena, or are statistical models simply useful tools for organizing our observations? Philosophers debate whether statistical models correspond to objective features of reality (realism) or are constructs that depend on human interpretation and conventions (anti-realism).
Probability and Rationality:
The relationship between probability and rational decision-making is a key issue in both statistics and philosophy. Bayesian decision theory, for instance, uses probabilities to model rational belief updating and decision-making under uncertainty. Philosophers explore how these formal models relate to human reasoning, especially when dealing with complex or ambiguous situations.
Philosophy of Machine Learning:
Machine learning and AI have introduced new statistical methods for pattern recognition and prediction. Philosophers of statistics are increasingly focused on the interpretability, reliability, and fairness of machine learning algorithms, as well as the role of statistical inference in automated decision-making systems.
The philosophy of statistics addresses fundamental questions about probability, uncertainty, inference, and the nature of data. It explores how statistical methods relate to broader epistemological issues, such as the nature of scientific knowledge, objectivity, and causality. Frequentist and Bayesian approaches offer contrasting perspectives on probability and inference, while debates about the role of models, data representation, and statistical significance continue to shape the field. The rise of big data and machine learning has introduced new challenges, prompting philosophical inquiry into the ethical and practical limits of statistical reasoning.
#philosophy#epistemology#knowledge#learning#education#chatgpt#ontology#metaphysics#Philosophy of Statistics#Bayesianism vs. Frequentism#Probability Theory#Statistical Inference#Causal Inference#Epistemology of Data#Hypothesis Testing#Risk and Decision Theory#Big Data Ethics#Replication Crisis
2 notes
·
View notes
Text
Understanding Research Methodologies and Design
Understanding Research Methodologies and DesignResearch is the cornerstone of progress in any field, from science and medicine to education and social sciences. To conduct meaningful research, one must first understand the fundamentals of research methodologies and design. These two concepts form the framework for systematic investigation and ensure the reliability and validity of results.This blog explores the essentials of research methodologies and design, offering a comprehensive guide for students, researchers, and enthusiasts.---What Is Research Methodology?Research methodology is the systematic plan for conducting research. It encompasses the tools, techniques, and procedures used to gather and analyze data, ensuring that the findings are accurate and relevant to the research question.Key components of research methodology include:1. Research PhilosophyPositivism: Focuses on observable phenomena and measurable facts.Interpretivism: Seeks to understand human behavior in its social context.Pragmatism: Combines positivism and interpretivism based on the research problem.2. Approach to ResearchDeductive Approach: Starts with a theory or hypothesis and tests it through data collection.Inductive Approach: Develops a theory based on observed patterns in the data.3. Types of ResearchQualitative: Explores experiences, concepts, and narratives. Common methods include interviews and thematic analysis.Quantitative: Measures variables numerically, often using surveys, experiments, and statistical analysis.Mixed Methods: Integrates both qualitative and quantitative approaches for a comprehensive understanding.---What Is Research Design?Research design is the blueprint of a study. It outlines the structure, techniques, and strategies for conducting research, ensuring the process is both effective and efficient.Key types of research design include:1. Exploratory Research DesignUsed when little is known about a problem.Methods include literature reviews, focus groups, and open-ended surveys.2. Descriptive Research DesignAims to describe characteristics or behaviors in detail.Surveys, observational studies, and case studies are common methods.3. Explanatory (Causal) Research DesignFocuses on identifying cause-and-effect relationships.Experimental designs, including randomized control trials, are widely used.4. Longitudinal vs. Cross-Sectional DesignsLongitudinal: Studies subjects over a long period to observe changes.Cross-Sectional: Collects data at a single point in time.---Steps to Create a Solid Research Design1. Define the Research ProblemStart with a clear and concise research question. For example, "What factors influence academic performance in college students?"2. Review LiteratureAnalyze existing studies to understand gaps and inform your design.3. Choose the Research MethodologyDecide whether your study will be qualitative, quantitative, or mixed-methods.4. Select Data Collection MethodsUse appropriate tools like surveys, interviews, experiments, or observational techniques.5. Plan Data AnalysisDecide on statistical methods or thematic approaches depending on your data type.6. Pilot the StudyConduct a small-scale trial to refine your methods.---The Importance of Ethical ConsiderationsEthics is integral to research methodologies and design. Ensure that your study respects the rights and dignity of participants by:Gaining informed consent.Ensuring confidentiality.Avoiding plagiarism and ensuring transparency in data reporting.---ConclusionMastering research methodologies and design is vital for conducting effective and credible research. By choosing the right approach, adhering to ethical practices, and meticulously planning each step, you can contribute valuable insights to your field of study.Whether you're a novice researcher or an experienced academic, understanding these concepts lays the foundation for impactful investigations. Keep learning, experimenting, and refining your approach to stay at the forefront of your discipline.
https://wa.me/919424229851/
2 notes
·
View notes
Text
Learning About Different Types of Functions in R Programming
Summary: Learn about the different types of functions in R programming, including built-in, user-defined, anonymous, recursive, S3, S4 methods, and higher-order functions. Understand their roles and best practices for efficient coding.
Introduction
Functions in R programming are fundamental building blocks that streamline code and enhance efficiency. They allow you to encapsulate code into reusable chunks, making your scripts more organised and manageable.
Understanding the various types of functions in R programming is crucial for leveraging their full potential, whether you're using built-in, user-defined, or advanced methods like recursive or higher-order functions.
This article aims to provide a comprehensive overview of these different types, their uses, and best practices for implementing them effectively. By the end, you'll have a solid grasp of how to utilise these functions to optimise your R programming projects.
What is a Function in R?
In R programming, a function is a reusable block of code designed to perform a specific task. Functions help organise and modularise code, making it more efficient and easier to manage.
By encapsulating a sequence of operations into a function, you can avoid redundancy, improve readability, and facilitate code maintenance. Functions take inputs, process them, and return outputs, allowing for complex operations to be performed with a simple call.
Basic Structure of a Function in R
The basic structure of a function in R includes several key components:
Function Name: A unique identifier for the function.
Parameters: Variables listed in the function definition that act as placeholders for the values (arguments) the function will receive.
Body: The block of code that executes when the function is called. It contains the operations and logic to process the inputs.
Return Statement: Specifies the output value of the function. If omitted, R returns the result of the last evaluated expression by default.
Here's the general syntax for defining a function in R:

Syntax and Example of a Simple Function
Consider a simple function that calculates the square of a number. This function takes one argument, processes it, and returns the squared value.

In this example:
square_number is the function name.
x is the parameter, representing the input value.
The body of the function calculates x^2 and stores it in the variable result.
The return(result) statement provides the output of the function.
You can call this function with an argument, like so:

This function is a simple yet effective example of how you can leverage functions in R to perform specific tasks efficiently.
Must Read: R Programming vs. Python: A Comparison for Data Science.
Types of Functions in R
In R programming, functions are essential building blocks that allow users to perform operations efficiently and effectively. Understanding the various types of functions available in R helps in leveraging the full power of the language.
This section explores different types of functions in R, including built-in functions, user-defined functions, anonymous functions, recursive functions, S3 and S4 methods, and higher-order functions.
Built-in Functions
R provides a rich set of built-in functions that cater to a wide range of tasks. These functions are pre-defined and come with R, eliminating the need for users to write code for common operations.
Examples include mathematical functions like mean(), median(), and sum(), which perform statistical calculations. For instance, mean(x) calculates the average of numeric values in vector x, while sum(x) returns the total sum of the elements in x.
These functions are highly optimised and offer a quick way to perform standard operations. Users can rely on built-in functions for tasks such as data manipulation, statistical analysis, and basic operations without having to reinvent the wheel. The extensive library of built-in functions streamlines coding and enhances productivity.
User-Defined Functions
User-defined functions are custom functions created by users to address specific needs that built-in functions may not cover. Creating user-defined functions allows for flexibility and reusability in code. To define a function, use the function() keyword. The syntax for creating a user-defined function is as follows:

In this example, my_function takes two arguments, arg1 and arg2, adds them, and returns the result. User-defined functions are particularly useful for encapsulating repetitive tasks or complex operations that require custom logic. They help in making code modular, easier to maintain, and more readable.
Anonymous Functions
Anonymous functions, also known as lambda functions, are functions without a name. They are often used for short, throwaway tasks where defining a full function might be unnecessary. In R, anonymous functions are created using the function() keyword without assigning them to a variable. Here is an example:

In this example, sapply() applies the anonymous function function(x) x^2 to each element in the vector 1:5. The result is a vector containing the squares of the numbers from 1 to 5.
Anonymous functions are useful for concise operations and can be utilised in functions like apply(), lapply(), and sapply() where temporary, one-off computations are needed.
Recursive Functions
Recursive functions are functions that call themselves in order to solve a problem. They are particularly useful for tasks that can be divided into smaller, similar sub-tasks. For example, calculating the factorial of a number can be accomplished using recursion. The following code demonstrates a recursive function for computing factorial:

Here, the factorial() function calls itself with n - 1 until it reaches the base case where n equals 1. Recursive functions can simplify complex problems but may also lead to performance issues if not implemented carefully. They require a clear base case to prevent infinite recursion and potential stack overflow errors.
S3 and S4 Methods
R supports object-oriented programming through the S3 and S4 systems, each offering different approaches to object-oriented design.
S3 Methods: S3 is a more informal and flexible system. Functions in S3 are used to define methods for different classes of objects. For instance:

In this example, print.my_class is a method that prints a custom message for objects of class my_class. S3 methods provide a simple way to extend functionality for different object types.
S4 Methods: S4 is a more formal and rigorous system with strict class definitions and method dispatch. It allows for detailed control over method behaviors. For example:

Here, setClass() defines a class with a numeric slot, and setMethod() defines a method for displaying objects of this class. S4 methods offer enhanced functionality and robustness, making them suitable for complex applications requiring precise object-oriented programming.
Higher-Order Functions
Higher-order functions are functions that take other functions as arguments or return functions as results. These functions enable functional programming techniques and can lead to concise and expressive code. Examples include apply(), lapply(), and sapply().
apply(): Used to apply a function to the rows or columns of a matrix.
lapply(): Applies a function to each element of a list and returns a list.
sapply(): Similar to lapply(), but returns a simplified result.
Higher-order functions enhance code readability and efficiency by abstracting repetitive tasks and leveraging functional programming paradigms.
Best Practices for Writing Functions in R
Writing efficient and readable functions in R is crucial for maintaining clean and effective code. By following best practices, you can ensure that your functions are not only functional but also easy to understand and maintain. Here are some key tips and common pitfalls to avoid.
Tips for Writing Efficient and Readable Functions
Keep Functions Focused: Design functions to perform a single task or operation. This makes your code more modular and easier to test. For example, instead of creating a function that processes data and generates a report, split it into separate functions for processing and reporting.
Use Descriptive Names: Choose function names that clearly indicate their purpose. For instance, use calculate_mean() rather than calc() to convey the function’s role more explicitly.
Avoid Hardcoding Values: Use parameters instead of hardcoded values within functions. This makes your functions more flexible and reusable. For example, instead of using a fixed threshold value within a function, pass it as a parameter.
Common Mistakes to Avoid
Overcomplicating Functions: Avoid writing overly complex functions. If a function becomes too long or convoluted, break it down into smaller, more manageable pieces. Complex functions can be harder to debug and understand.
Neglecting Error Handling: Failing to include error handling can lead to unexpected issues during function execution. Implement checks to handle invalid inputs or edge cases gracefully.
Ignoring Code Consistency: Consistency in coding style helps maintain readability. Follow a consistent format for indentation, naming conventions, and comment style.
Best Practices for Function Documentation
Document Function Purpose: Clearly describe what each function does, its parameters, and its return values. Use comments and documentation strings to provide context and usage examples.
Specify Parameter Types: Indicate the expected data types for each parameter. This helps users understand how to call the function correctly and prevents type-related errors.
Update Documentation Regularly: Keep function documentation up-to-date with any changes made to the function’s logic or parameters. Accurate documentation enhances the usability of your code.
By adhering to these practices, you’ll improve the quality and usability of your R functions, making your codebase more reliable and easier to maintain.
Read Blogs:
Pattern Programming in Python: A Beginner’s Guide.
Understanding the Functional Programming Paradigm.
Frequently Asked Questions
What are the main types of functions in R programming?
In R programming, the main types of functions include built-in functions, user-defined functions, anonymous functions, recursive functions, S3 methods, S4 methods, and higher-order functions. Each serves a specific purpose, from performing basic tasks to handling complex operations.
How do user-defined functions differ from built-in functions in R?
User-defined functions are custom functions created by users to address specific needs, whereas built-in functions come pre-defined with R and handle common tasks. User-defined functions offer flexibility, while built-in functions provide efficiency and convenience for standard operations.
What is a recursive function in R programming?
A recursive function in R calls itself to solve a problem by breaking it down into smaller, similar sub-tasks. It's useful for problems like calculating factorials but requires careful implementation to avoid infinite recursion and performance issues.
Conclusion
Understanding the types of functions in R programming is crucial for optimising your code. From built-in functions that simplify tasks to user-defined functions that offer customisation, each type plays a unique role.
Mastering recursive, anonymous, and higher-order functions further enhances your programming capabilities. Implementing best practices ensures efficient and maintainable code, leveraging R’s full potential for data analysis and complex problem-solving.
#Different Types of Functions in R Programming#Types of Functions in R Programming#r programming#data science
4 notes
·
View notes
Text
I'm really angry right now. TW Suicide, political transphobia
Okay so, any of my british mutuals will know about the ban on puberty blockers to treat gender dysphoria in England - and now Northern Ireland, too. And we all know about the complete lack of actual, credible, good quality evidence, the way the government actually explcitly went "we will not be listening to the voices of the community affected by this" and then turned around and only listened to transphobes, and most of all, we all know about the dangers of the puberty blocker ban, specifiically the increased suicide risk. This article from the goodlawproject talks about whistleblowers who revealed that there was a dramatic increase in suicides among trans people on the waiting list for the gender identity development service after the tories restricted trans healthcare back in 2020, after Bell vs Tavistock.
You may also have seen this article from July, re-published in a bunch of newspapers. I hadn't before today, and it's what's making me so angry, because I only have some basic knowledge about statistical testing, and even I know this is absolute bullshit. Let's break it down.
First off, it says Professor Appleby, the guy who conducted the review, found 12 suicides at the Tavistock over the three years before and three years after the restrictions. Becuase he only used Tavistock, and ignored attempted suicides. He did not look at the wider picture, and then tries to generalise his claims to the entire population of people needing puberty blockers?? babygirl that's just bad science. The whisteblowers told of a total of 17 (1 before, 16 after Bell vs Tavistock) from across the whole GIDS waiting list... an actually appropriate fucking sample that should have been investigated.
Oh, and that one? that was in seven years. Seven fucking years. And the 16 were in only three. Whereas this fool only looked at three years either side. This means he misses the larger picture - he ignores the very real possibility that increased transphobia leading up to government anti-trans action could have also accounted for the similarity in number. He should have also done a wider investigation into, say, the decade before the Bell case and subsequent anti-trans government action.
We've talked about neglect of the present (only focussing on patients at Tavistock), about neglect of the past (only looking at the three years before, so inable to see any kind of pattern), but we haven't talked about the future. This review's purpose wasn't just to tell us what happened (which it failed to do), it was to use the past to provide the government with an idea of the risk of their actions. This should also have included a risk assesment with projected figures on likely suicide rates following the puberty blocker ban. Now, I haven't been able to find the actual review, only news articles talking about it, so maybe he did do this, but it really doesn't seem like he did. The articles say that he was using these figures to find the statistical significance. This is a number that you use a statsitical test to work out following results of a clinical trial - may I remind the court that this was not a fucking clinical trial, this was real childrens' lives, what the actual fuck. But let's focus on the number itself for a sec. This man said that the rise from 5 to 7 suicides comparing the two sets of three years was normal fluctuation and is not statistically significant.
Using the numbers he had, that's true. Now, I don't have all the numbers he did, so I'm going to have to do a little guesswork, but here we go: I am going to use the chi-squared independent test, the '5' and '7' from Appleby's review, the figure '9000' for post-2020 number of patients (based on this), and the figure '5,000' for pre-2020 (based on this). My sources are far from perfect but it's all I can find so here we are.
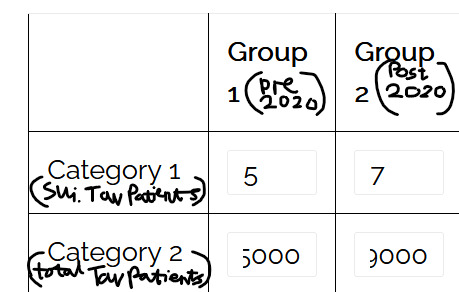
The p-value from this data is "0.667099". Any value above 0.05 should be taken to be significant; this is not below 0.05, so yes, it is insignificant. (also, the X^2 Test Statistic is 0.185015, if anyone is interested).
The review could have been good for what it was really measuring: relationship between government action against trans rights on Tavistock patients. But the fact that it was supposed to be a review on the entire damn situation with puberty blockers means that it falls short and should not be used as evidence in this debate, let alone generalised to such a degree and brandished about by news outlets and the government as proof that trans activists are dangerous for talking abotu the relationship between suicide and lack of access to puberty blockers.
#Lila speaks#tumblr#UK#transgender#puberty blockers#puberty blocker ban#politics#science#typing all this out helped channel my anger. feel a bit better now#beyond fucked the way the govt. misuses science to take away our rights#psychology#psychiatry#like. I only have up to A-level knowledge of psychology and even I know how fucked this is
2 notes
·
View notes
Text
How do I learn R, Python and data science?
Learning R, Python, and Data Science: A Comprehensive Guide
Choosing the Right Language
R vs. Python: Both R and Python are very powerful tools for doing data science. R is usually preferred for doing statistical analysis and data visualisations, whereas Python is much more general and currently is very popular for machine learning and general-purpose programming. Your choice of which language to learn should consider your specific goals and preferences.
Building a Strong Foundation
Structured Courses Online Courses and Tutorials: Coursera, edX, and Lejhro offer courses and tutorials in R and Python for data science. Look out for courses that develop theoretical knowledge with practical exercises. Practise your skills with hands-on coding challenges using accompanying datasets, offered on websites like Kaggle and DataCamp.
Books: There are enough books to learn R and Python for data science. You may go through the classical ones: "R for Data Science" by Hadley Wickham, and "Python for Data Analysis" by Wes McKinney.
Learning Data Science Concepts
Statistics: Know basic statistical concepts: probability, distribution, hypothesis testing, and regression analysis.
Cleaning and Preprocessing: Learn how to handle missing data techniques, outliers, and data normalisation.
Data Visualization: Expert libraries to provide informative visualisations, including but not limited to Matplotlib and Seaborn in Python and ggplot2 in R.
Machine Learning: Learn algorithms-Linear Regression, Logistic Regression, Decision Trees, Random Forest, Neural Networks, etc.
Deep Learning: Study deep neural network architecture and how to build and train them using the frameworks TensorFlow and PyTorch.
Practical Experience
Personal Projects: In this, you apply your knowledge to personal projects which help in building a portfolio.
Kaggle Competitions: Participate in Kaggle competitions to solve real-world problems in data science and learn from others.
Contributions to Open-Source Projects: Contribute to some open-source projects for data science in order to gain experience and work with other people.
Other Advice
Join Online Communities: Join online forums or communities such as Stack Overflow and Reddit to ask questions, get help, and connect with other data scientists.
Attend Conferences and Meetups: This is a fantastic way to network with similar working professionals in the field and know the latest trends going on in the industry.
Practice Regularly: For becoming proficient in data science, consistent practice is an indispensable element. Devote some time each day for practising coding challenges or personal projects.
This can be achieved by following the above-mentioned steps and having a little bit of dedication towards learning R, Python, and Data Science.
2 notes
·
View notes
Text
The minimal clinically important difference (MCID) is a concept defined as “the smallest difference in a score that patients perceive as beneficial and that would lead, in the absence of harmful side effects or excessive costs, to adaptations in care management”. —Annals of Physical and Rehabilitation Medicine, 2012
After investigating the terrible policy decisions made during COVID, Subcommittee Chairman Wenstrup issued a statement defining how things must be treated differently in the United States when moving forward from the COVID debacle:
In short, responses to pandemics must be guided by conclusive data. But two questions immediate arise:
What constitutes conclusive data?
Which, if any measures, was backed by conclusive data?
In science, there is some measurement error that only allows you to give a range of estimates on the effect of something. In the real-world, there is also something called the Minimum Clinically Important Difference (MCID). You might be able to find a difference within your measurement error, achieving statistical significance.
But statistical significance is not good enough for “real-world” policies. To have conclusive data on a measure or protocol means having so much good data that your minimum estimate is beyond the MCID. The MCID is patient-centered, it depends on what it is that people want out of a measure or protocol.
It is not chosen by what it is that “doctors” think is best for people. It is chosen by what it is that “people” think is best for themselves. In economics, when people are offered an amount of money today versus an amount in one month’s time, they want 33% more money ($20 vs. $15) if they have to wait one month in order to receive it:
4 notes
·
View notes
Text
Navigating Challenges in R Programming Homework: A Comprehensive Guide for Students
When it comes to mastering R programming, students often find themselves facing numerous challenges in completing their homework assignments. In this comprehensive guide, we'll explore the common obstacles students encounter and provide practical tips to overcome them. Whether you're a beginner or an experienced R programmer, this handbook aims to be your go-to resource for navigating the complexities of R homework.
Understanding the Importance of R Homework
Before delving into the challenges, let's establish why R homework is crucial for students pursuing statistics or data science courses. R programming is widely used in these fields for data analysis, visualization, and statistical modeling. Completing R homework assignments not only reinforces theoretical knowledge but also hones practical skills, preparing students for real-world applications.
Challenges Faced by Students
Complexity of R Syntax Overcoming the Syntax Maze The intricacies of R syntax can be overwhelming, especially for beginners. To overcome this challenge, consider breaking down your code into smaller segments, focusing on one concept at a time. Utilize online resources and seek assistance from R programming communities to enhance your understanding of syntax rules.
Data Handling and Manipulation Mastering Data Manipulation Effective data handling is a fundamental aspect of R programming. Practice with real-world datasets and explore functions like dplyr and tidyr to enhance your data manipulation skills. Online platforms and tutorials can provide hands-on exercises to reinforce these concepts.
Debugging and Error Resolution Navigating the Debugging Terrain Encountering errors in your R code is inevitable, but learning how to debug efficiently is key. Utilize debugging tools, such as the traceback function, and carefully review error messages. Online forums and communities can be valuable resources for seeking guidance on specific error resolutions.
Time Management Balancing Act: Homework vs. Other Commitments Many students struggle with time management when it comes to R homework. Create a schedule, allocate dedicated time slots for homework, and break down tasks into manageable chunks. Prioritize assignments based on deadlines and complexity, allowing for a more structured and efficient approach.
Seeking External Support
Relying on Professional Assistance Exploring R Homework Help Services For students facing persistent challenges, seeking professional help is a viable option. Websites like StatisticsHomeworkHelper.com offer specialized R homework help services, ensuring personalized assistance and timely completion of assignments. These services can provide valuable insights and guidance, complementing your learning journey.
Conclusion
In conclusion, overcoming obstacles in completing R homework requires a strategic approach, persistence, and access to the right resources. By understanding the challenges associated with R programming, implementing effective learning strategies, and leveraging external support when needed, students can navigate the complexities of R homework successfully. Remember, mastering R programming is a gradual process, and each obstacle conquered is a step closer to becoming a proficient R programmer.
Frequently Asked Questions
Q1: Is it common for students to struggle with R homework? A1: Yes, it's common for students to face challenges in R homework, especially due to the complexity of syntax, data manipulation, and debugging. Q2: How can I improve my time management for R homework? A2: To improve time management, create a schedule, allocate dedicated time slots, and prioritize assignments based on deadlines and complexity. Q3: When should I consider seeking professional R homework help? A3: If you're facing persistent challenges and need personalized assistance, consider seeking professional help from reliable services like StatisticsHomeworkHelper.com.
By addressing the challenges associated with R homework and providing practical solutions, this handbook aims to empower students to tackle their assignments with confidence. Whether you're a beginner or an advanced R programmer, the key lies in persistence, strategic learning, and utilizing available resources to overcome obstacles successfully.
10 notes
·
View notes
Note
hey hi hi you said "ask me about the shark paper" and i am here to do precisely that. i too love niche academic beef, pretty please tell me everything
I'm so glad you asked I am so happy to answer this I love niche academic drama. The best part about being an academic lol.
Anyway I read these papers YEARS ago in a political economy grad seminar, so my memory is a lil fuzzy lol.
BUT ANYWAY
Paper one: So basically this group of political scientists wrote a paper with some title about whether shark attacks impact voting behavior. And the paper was about a really specific case study. See there was a series of deadly shark attacks, sensationalized in the media (and were actually the inspiration for Jaws!), that were happening around the same time Woodrow Wilson (I think) was running his reelection campaign, and apparently he had some links to the local community where the attacks were happening. And the paper was arguing that these highly sensationalized shark attacks happening on his turf made him lose points in the polls in the effected counties.
(Achen and Bartels - Why Shark Attacks Are Bad for Democracy)
Paper Two: But THEN another group of political scientists take that question - do shark attacks effect voting behavior? - remove all that context and attack the original paper's methodology and make like a huge dataset of all shark attacks in america and the vote share for candidates before and after the shark attacks in those counties and decide that shark attacks DON'T impact voting.
(Fowler and Hall - Do shark attacks influence presidential elections? Reassessing a prominent finding on voter competence)
Paper Three: And then the original authors clarify that the case was specific and its more about like.. sensationalized headlines than sharks specifically. But then they also decided to tear apart Paper Two's methodology and data collection. And write a paper about what methodology they would use and make their OWN dataset for if they wanted to look at shark attacks more broadly.
(Achen and Bartels - Statistics as If Politics Mattered: A Reply to Fowler and Hall)
Paper Four: Then the authors of Paper Two write another paper defending their methodology and pointing out some problems with Paper Three's dataset. (I can't find this one right now but i remember reading it)
I think they continued fighting in like... the footnotes of other projects, and this went on for years and they teach it in grad school methods classes to talk about various data collection issues and large datasets vs selective case studies. Anyway I'm pretty sure this all started because some political science data nerds really loved Jaws.
3 notes
·
View notes