#technical analysis chart patterns
Explore tagged Tumblr posts
Visit Tumblr Blog
Explore Tumblr blogs with no restrictions, modern design and the best experience.
Last Seen Tumblr Blogs


Fun Fact
Tumblr was acquired by Yahoo for $1.1B in 2013.
Text
Unveiling the Magic of Shooting Star Candlestick Pattern
Title: Unveiling the Magic of Shooting Star Candlestick Pattern: A Step-by-Step Guide Introduction:Candlestick patterns are essential tools for technical analysts in the world of trading. Among the myriad patterns, the Shooting Star stands out as a powerful indicator of potential trend reversals. In this blog post, we will delve into the nuances of the Shooting Star candlestick pattern,…

View On WordPress
#candlestick#candlestick chart#candlestick patterns#candlestick trading#candlestick trading patterns#candlestick trading setup#candlestick trading strategies#candlesticks#candlesticks pattern#elemer of the briar#forex trading against the trend#history of the elder scrolls#japanese candlesticks#making of the elder scrolls#swing trading guide#swing trading patterns#technical analysis chart patterns#the elder scrolls: arena - a complete retrospective
1 note
·
View note
Text
Importance of chart analysis for equity investments
Image by freepik Chart analysis, or technical analysis, can be quite helpful for equity investment in the Indian stock market. Here are several reasons why it is beneficial: Benefits of Chart Analysis in the Indian Stock Market 1.Trend Identification The Indian stock market, like any other, exhibits trends over time. Chart analysis helps in identifying these trends, allowing investors to ride…
#chart analysis#equity investment#Financial Markets#Indian stock market#investment strategies#market analysis#Market Sentiment#Stock Charts#Stock Market#Stock Trading#Support and Resistance#Technical Analysis#Technical Indicators#Trading Patterns#Trend Identification#Volume Analysis
3 notes
·
View notes
Text
Technical Analysis in a Nutshell
Technical analysis is a method used to evaluate and forecast the price movements of financial instruments, such as stocks, commodities, and currencies, by analyzing historical price data and trading volumes. Unlike fundamental analysis, which focuses on a company’s financial health, technical analysis relies on patterns, trends, and statistical indicators to make trading decisions. This article…
#Bollinger Bands#Chart Patterns#Divergence#Entry and Exit Points#Exponential Moving Average#Financial Markets#Fundamental Analysis#MACD#Market Movements#Moving Average#Moving Average Convergence Divergence#Oversold Conditions#Position Sizing#Price Charts#Price Movement#Price Movements#Relative Strength#Risk Management#RSI#Security#Stop-Loss#Support And Resistance#Technical Analysis#Trading Decisions#Trading Strategies#Trading Volume#Trend Lines#Volatility
2 notes
·
View notes
Text
Technical Analysis & Trend Patterns: Learn Share Market Trading the Right Way

At Chart Monks, we believe that trading is a skill — not a gamble. If you’re tired of confusion, indicator overload, or following calls blindly, it’s time to change the way you trade. With our practical approach to technical analysis and real-time understanding of trend continuation patterns, we help you learn online trading the right way — with clarity, confidence, and control.
Whether you're a complete beginner or someone looking to refine your strategies, we offer some of the best trading courses in India tailored to every stage of your journey.
Why Choose Chart Monks to Learn Online Trading?
Unlike traditional platforms that focus heavily on theory or flashy strategies, we simplify the process. At Chart Monks, we teach you to read the price action, understand market psychology, and make independent decisions based on structure and logic — not noise.
Our mission is to provide online trading courses for beginners and intermediate traders that are grounded, actionable, and free from unnecessary complexity.
Trading Classes for Beginners – Build a Strong Foundation
If you're just getting started, you don’t need complicated strategies. You need a strong foundation. That’s why our trading classes for beginners focus on what truly matters:
Understanding how price moves
Identifying market phases
Recognizing demand and supply zones
Reading structure and trend continuation patterns
Managing risk and maintaining discipline
We break down each concept in a simple, visual way that anyone can understand — no financial background needed. You’ll gain the skills to trade independently, without relying on tips or signals.
Share Market Technical Analysis Course – Learn What Really Moves the Market
Our share market technical analysis course is one of the most practical and insightful programs available online in India. We go beyond just candlesticks and indicators. We train you to see the bigger picture — how institutions move the market, how retail traders react, and how you can stay ahead by reading pure price action.
Inside this course, you’ll learn:
How to recognize and trade trend continuation patterns with confidence
How to build high-probability setups using price structure
The psychology behind big moves
How to avoid common traps and false breakouts
Real chart examples from the Indian stock market
This isn’t about memorizing patterns — it’s about understanding why the market moves and where it’s likely to go next.
Avoid Trading Burnout – Train with Clarity and Focus
Many traders face trading burnout not because they lack motivation, but because they’re overwhelmed with too much conflicting information. At Chart Monks, we remove that stress by offering a structured, step-by-step learning journey.
Our approach helps you:
Focus on one system and master it
Avoid information overload from too many sources
Gain mental clarity with simple, repeatable strategies
Build the right mindset to handle wins and losses calmly
At Chart Monks, we believe trading success is 20% strategy and 80% psychology. That’s why we also help you develop the mental discipline to stay consistent.
Online Trading Courses in India – Learn Anytime, Anywhere
We understand that flexibility is important. That’s why we offer all our online courses —so you can learn whenever and wherever it suits you. Whether you're working full-time, in college, or trading part-time, our online trading courses for beginners are designed to fit your schedule.
With our platform, you get:
Lifetime access to course material
Mobile and desktop-friendly video content
Downloadable resources and charts
Live sessions and mentor support
Community access for feedback and progress tracking
No need to travel or attend costly seminars — with Chart Monks, everything is available from the comfort of your home.
What Makes Our Trading Courses Online the Best?
There are many platforms offering trading courses online, but few truly focus on what matters. We stand out by:
Teaching real price action, not just theory
Breaking down live chart examples from the Indian stock market
Focusing on trend continuation patterns and practical setups
Helping you develop a consistent mindset
Offering support through mentorship, not just videos
Keeping things affordable and transparent
We don’t promise overnight success. We promise real skills and lifelong learning.
Free Online Courses for Trading – Start With Zero Risk
Still unsure if our courses are the right fit? Try our free online courses for trading. These mini-courses give you an introduction to how we teach and what we cover. You’ll learn key trading concepts, market structures, and entry-level technical analysis — all at zero cost.
They’re a great way to test the waters and see if our approach aligns with your goals.
Prepared to Begin Your Trading Journey with the Right Approach?
If you’re serious about trading and want to learn in a clear, practical, and mentally sustainable way, Chart Monks is here to guide you. Whether you're looking for trading classes for beginners, a share market technical analysis course, or a full online trading course in India, we’ve got the roadmap you need.Start with our free courses, or dive into our full programs to transform your approach to the market. Call us now at +91-9220943789, Visit: www.chartmonks.com.
#Learn Online Trading#Trading Classes For Beginners#Share Market Technical Analysis Course#Trend Continuation Patterns#Trading Courses Online#Best Trading Courses#Trading Burnout#Free Online courses For Trading#Online Trading Courses For Beginners#Online Trading Course in India#Price Action#Technical Analysis Course#Chart Monks
0 notes
Text
youtube
Looking to spot trend reversals before the rest of the market catches on? This video breaks down powerful reversal signals every smart trader should know to maximize profits and minimize losses. In this detailed guide, we uncover the top reversal patterns, indicators, and techniques used by successful traders across the stock, forex, and crypto markets. Learn how to identify momentum shifts, trap zones, and entry/exit points that could change the game for your trading strategy. Whether you're day trading, swing trading, or investing long-term, understanding reversal signals is key to protecting your capital and boosting returns. Websites: https://tradegenie.com/ https://nosheekhan.com/ Twitter - https://twitter.com/marketswizard Facebook - https://www.facebook.com/financialmar Head Office: Trade Genie Inc. 315 South Coast Hwy 101, Encinitas, CA 92024 Phone Number: 212-408-3000 #ReversalSignals #TradingProfits #TechnicalAnalysis #PriceAction #ChartPatterns #StockMarketTips #ForexTrading #CryptoSignals #SwingTrading #DayTrading #TrendReversal #SmartTrading #UnlockProfits #TradingEducation #MarketMoves
#Reversal-Signals#Trading-Profits#Technical-Analysis#Price-Action#Chart-Patterns#Stock-Market-Tips#Forex-Trading#Crypto-Signals#Swing-Trading#Day-Trading#Trend-Reversal#Smart-Trading#Trading-Education#Youtube
0 notes
Text
Nifty Forecast Tomorrow: Expert Predictions and Market Trends You Should Know
If you're looking for the most accurate Nifty forecast for tomorrow, you're not alone. Every day, thousands of traders and investors closely follow the Nifty 50 index, aiming to anticipate the next market move and get a step ahead of the volatility. In this post, we break down key technical levels, current sentiment, and expert-backed strategies to help you prepare for the trading session ahead.
📊 What Is the Nifty 50 and Why Its Forecast Matters
The Nifty 50 is India’s flagship stock market index, representing 50 of the largest and most liquid companies listed on the National Stock Exchange (NSE). It's a key barometer for market trends and investor confidence.
A well-researched forecast for Nifty 50 movement tomorrow can be highly valuable for:
Intraday traders planning entry and exit points.
Swing traders timing short-term opportunities.
Investors staying aligned with macroeconomic trends.
🔍 Nifty 50 Technical Analysis for Tomorrow
1. Key Support and Resistance Levels
Based on today’s market close and recent trading patterns:
Support zones: 22,300 and 22,180
Resistance zones: 22,500 and 22,640
If the index breaks above 22,500 with momentum, it may push higher. A drop below 22,180 could shift sentiment toward bearish.
2. Moving Averages
Nifty is trading above both 20-day and 50-day EMAs, suggesting the trend remains positive.
The Relative Strength Index (RSI) is around 58–60, reflecting healthy momentum without overbought conditions.
3. Candlestick Pattern
Today’s session showed indecision, forming a neutral candle. A breakout candle or a bullish engulfing pattern tomorrow would be a strong confirmation of upward momentum.
🗣️ Market Sentiment & Global Cues
Sentiment in the market remains cautiously optimistic. Some of the key global and domestic factors influencing the Nifty forecast tomorrow include:
U.S. Federal Reserve commentary on interest rates
Movement in crude oil prices
INR/USD exchange rate fluctuations
Institutional investor activity (FII/DII inflow/outflow)
FIIs were net buyers today, a signal that global appetite for Indian equities remains intact — at least for now.
📈 Expert Outlook: Nifty Forecast for Tomorrow
Analysts are leaning towards a mild bullish trend continuing into tomorrow’s session, assuming no sudden negative cues overnight. That said, volatility is likely to spike during the first hour of trade.
Here are some smart trading reminders:
Don’t chase early price gaps.
Stick to well-defined stop losses.
Wait for volume confirmation, especially near breakout zones.
💡 Tip: A breakout above 22,500 on strong volume could provide a high-probability setup for short-term trades.
🛠️ Action Plan for Traders
Intraday Traders
Observe the first 15–30 minute range for market direction.
Indicators like MACD, RSI, and volume spikes are crucial for timing entries.
Use a trailing stop-loss strategy once in profit.
Positional Traders
Consider adding long positions above 22,500 with upside targets around 22,800.
If Nifty dips below 22,180, reassess and wait for a base to form before entering.
🔗 Live Updates and Tools
Want more granular data? For real-time charts, key levels, and analyst videos, check out the full Nifty 50 forecast and live analysis page.
📬 Final Thoughts
A well-informed Nifty prediction for tomorrow helps traders cut through the noise and take calculated risks. No forecast is 100% guaranteed, but combining technical signals, market sentiment, and global cues can give you an edge.
Trade smart. Stay disciplined. And always have a plan.
#nifty forecast tomorrow#nifty 50 prediction#nifty 50 forecast#nifty technical analysis#nifty trend tomorrow#share market forecast#stock market prediction#nifty outlook#nifty analysis#nifty trading strategy#nifty support and resistance#nifty levels tomorrow#intraday trading tips#stock market india#nifty market trend#nifty tomorrow analysis#nifty movement prediction#NSE forecast#indian stock market forecast#market trend analysis#technical analysis nifty 50#nifty 50 chart#fii dii data analysis#stock market update today#trading view nifty#nifty live updates#nifty chart pattern#nifty stock tips#nifty breakout strategy#nifty candlestick analysis
0 notes
Text
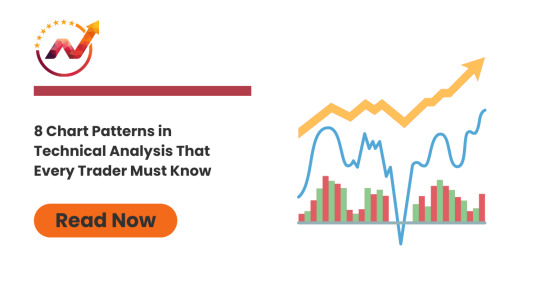
Top 8 Must-Know Chart Patterns in Technical Analysis | NTA®
Discover the 8 essential chart patterns every trader should master. Enhance your trading strategy with insights into market trends and price action analysis.
0 notes
Text
Unlocking the Power of TradingView: The Best Charting Platform for Traders
A sleek and modern TradingView dashboard displaying real-time charts, candlestick patterns, and powerful technical indicators like RSI and MACD. Are you looking for a powerful, easy-to-use charting tool to enhance your trading? Whether you’re a beginner or an experienced trader, TradingView is one of the best platforms for technical analysis, market insights, and strategy building. And here’s…
#Affiliate Marketing#Automated trading#Candlestick patterns#Crypto trading#Day trading#Forex trading#Investing#MACD#Market analysis#Online trading#passive income#RSI#Stock market#Swing trading#Technical analysis#Trading alerts#Trading bots#Trading platform#Trading signals#Trading strategies#Trading tools#TradingView#TradingView charts#TradingView indicators#TradingView plans#TradingView pricing#TradingView review
0 notes
Text
Binge-Worthy Trading: When Technical Analysis Meets Your Watch List
Hey streaming fanatics turned traders! Ever notice how your chart analysis skills improved after watching 47 episodes of your favorite show in one sitting? No? Let me explain this hilarious connection between your Netflix addiction and trading success!
Remember how you predicted that plot twist in your favorite series because you noticed all the subtle hints? That's exactly what technical analysis is - except instead of predicting who ends up with who, you're predicting where prices might go. And trust me, both can be equally dramatic!
Think about your favorite crime series. You know how detectives look for patterns to solve cases? Well, traders are basically market detectives! Instead of looking for clues at a crime scene, we're searching for clues in our charts. Though sometimes the market commits crimes against our portfolio, but that's another story...
The best part is how similar chart patterns are to TV show formulas. You've got your reversal patterns (like season finales), continuation patterns (like mid-season episodes), and those false breakouts (like clickbait episode titles that promise more than they deliver).
And don't even get me started on double tops and bottoms - they're like those classic "evil twin" episodes. Just when you think you know what's happening, the market pulls a soap opera move on you!
Concluding paragraph: So next time someone tells you you're watching too much TV, just tell them you're actually studying advanced pattern recognition for your trading career! And remember, just like you wouldn't skip to the last episode of a series, don't rush your trading journey. Enjoy the show, learn the patterns, and maybe keep some popcorn handy for those volatile market days!
#trading entertainment#Netflix analysis#market patterns#trading humor#technical analysis basics#chart patterns#trading psychology#market trends#trading education#beginner trading
1 note
·
View note
Text
Head and Shoulders Chart Pattern in Stock Trading

The Head and Shoulders pattern is a chart formation that often signals a reversal in the trend of a financial asset like stocks, commodities, or currencies. Traders use this pattern to spot when a market is about to shift from an upward trend to a downward trend (or vice versa), making it an essential tool for both beginners and experienced investors. This pattern has three peaks with the centre peak shaped like a ‘head’ supported by the two ‘shoulders’ or smaller peaks on either side which gives the pattern its name.
Read Full Blog Post: Head and Shoulders Pattern in Technical Analysis
#Head and Shoulders Chart Pattern in Technical Analysis#How to Trade using Head and Shoulders Pattern#Different Types of Head and Shoulders Pattern#Head And Shoulders Pattern In Stock Trading#Inverse head and shoulders pattern
0 notes
Text
youtube
Mastering Forex Charts: A Beginner's Guide to Candlesticks, Lines, and Bar Patterns
#Forex trading#Forex charts#candlestick charts#line charts#bar charts#trading tutorial#chart analysis#technical analysis#Forex market#bullish patterns#bearish patterns#price movements#market trends#OHLC#trading strategies#chart reading#price action#trading tips#beginner trading#advanced trading#Forex education#PipInfuse#trading insights#market sentiment#trend analysis#trading confidence#Youtube
1 note
·
View note
Text

GIFT Nifty Indicates Muted Opening; UCO Bank Hikes Lending Rates by 5bps for Certain Tenures
for more details click here
#William J. O'Neil (William O Neil)#CANSLIM#Indian Stock Market#Stock Market Research#Market Outlook#Stock Screener#Stock Watchlists#Chart Pattern#Stock Analysis#Breakout Stocks#Stocks to Watch#Stocks to Buy#Growth Stocks#Stock Investing#Stock Trading#Momentum Investing#IPO Stocks#Fundamental Analysis#Technical Analysis#Stock M#arket Courses#Best Sector To Invest#Top Stock Advisory Services
1 note
·
View note
Text
Triangle Chart Pattern: Forex Trading Indicator Explained
The triangle chart pattern is a common and versatile formation used by forex traders to predict potential market movements. This pattern helps traders identify periods of consolidation and subsequent breakouts, providing valuable insights for making informed trading decisions. In this article, we will explore the triangle chart pattern, its types, and how to effectively use it in forex…
#Chart Patterns#Currency Pairs#DeFi#Entry and Exit Points#Forex#Forex Traders#Forex Trading#Market Movements#Price Action#Price Movements#Stop-Loss#Take-Profit#Technical Analysis#Trading Decisions#Trading Indicator#Trading Strategies#Volume Analysis
0 notes
Text
शेयर मार्किट चार्ट कैसे समझे
जब आप चार्ट खोलो तो आप घबराये नहीं कि इसमें हम क्या देखें क्यूंकि मैंने पहले भी बोला है कि आपको शेयर मार्केट चार्ट समझने के लिए थोड़ा बहुत चीज़ें समझनी पड़ेगी जैसे की मार्केट का ट्रेंड, ट्रेंड लाइन, सपोर्ट और रेजिस्टेंस जिसे डिमांड और सप्लाई जोन भी कहते हैं |
अगर आप शेयर मार्किट चार्ट कैसे समझे जानना चाहते हैं तो आपको यह सब भी थोड़ा बहुत सीखना पड़ेगा और इसमें आपको लगातार अभ्यास करना पड़ेगा क्यूंकि सिर्फ जान लेने से कुछ नहीं होगा, इसके निरंतर अभ्यास से आपको आत्मविश्वास आयेगा और चार्ट देखने का कौशल भी बढ़ेगा |
अगर आपको इंसान पढ़ना आता है तो आप चार्ट को भी पढ़ना सीख जायेंगे | ऐसे मैं क्यों कह रहा हूँ ? ऐसा मैं इसलिए कह रहा हूँ क्यूँकि शेयर को भी खरीदा और बेचा जाता है और उसे खरीदता कौन है ? इंसान !!!
इसलिए अगर आप यह समझ जाएं की इंसान कौन से प्राइस पर किसी शेयर को खरीदने और बेचने में रूचि लेता है तो आप चार्ट को पढ़ना आसानी से सीख जाएंगे |
इसलिए स्टॉक्स का भी अपना एक व्यवहार (behaviour) होता है, हर स्टॉक का चार्ट उसके व्यवहार को बताता है | यानि उसके खरीदने और बेचने वाले के व्यवहार को बताता है |
इसलिए अगर आप किसी स्टॉक में निवेश कर रहे हैं तो पहले उसके व्यवहार (behaviour) को समझिये फिर उसके बाद उसमे निवेश करिये |
बहुत सारे ऐसे स्टॉक होते हैं जो धरल्ले से ऊपर जाते हैं और धरल्ले से निचे आते हैं मतलब इसमें single top बनता है, जो एक पैटर्न है |
पर कुछ स्टॉक ऐसे भी होते हैं जो या तो दो बार या तीन बार टॉप बनाते हैं फिर निचे आते हैं, यह सब आप आराम से देख पाएंगे जब आप शेयर मार्किट चार्ट कैसे समझे जान जाएंगे |
और तो और कई स्टॉक ऐसे होते हैं जो धीरे से ऊपर जाते हैं और हौले – हौले निचे आते हैं | इसे ही हम स्टॉक का बिहै��ियर कहते हैं |
जब आप स्टॉक के बिहैवियर को समझ जाते हैं तो आप यह अनुमान लगा सकते हैं कि उसके साथ अगला क्या हो सकता है, क्यूंकि उसने पहले ऐसा किया है | आप पढ़ रहे हैं शेयर मार्किट चार्ट कैसे समझे |
0 notes
Text
laguestbook.com/finance/what-is-the-currency-trading-and-how-to-start-with-proper-knowledge/
What is the Currency Trading and How to Start with Proper Knowledge:- Trading in forex and related derivatives takes place over the counter as well as on exchanges. From all over the globe, the Foreign exchange market is the largest financial market, larger than the equity or debt market. Read more: https://laguestbook.com/finance/what-is-the-currency-trading-and-how-to-start-with-proper-knowledge/
0 notes
Video
youtube
Mastering the DOUBLE BOTTOM FOREX TRADING for Maximum Gain 2023
#youtube#youtube trending#Double Bottom Pattern Explained#Trading Strategies with Double Bottom#Identifying Double Bottom Reversals#Double Bottom Chart Pattern Tutorial#How to Spot Double Bottoms in Forex#Double Bottom Candlestick Patterns#Double Bottom Trading Signals#Double Bottom vs. Double Top Differences#Double Bottom Formation Analysis#Successful Double Bottom Trading Tips#Double Bottom Pattern for Beginners#Real Examples of Double Bottom in Stock Market#Double Bottom Breakout Strategies#Double Bottom Technical Analysis Guide#Common Mistakes in Double Bottom Trading
0 notes