#Big Data and Analytics
Explore tagged Tumblr posts
Visit Tumblr Blog
Explore Tumblr blogs with no restrictions, modern design and the best experience.
Last Seen Tumblr Blogs


Fun Fact
Mobile Tumblr US users spend an average of 4.04 minutes per session on the app.
Text
Mastering HR Analytics for Workforce Management & Productivity
HR analytics is crucial for monitoring and improving the role of the workforce in business success. Organizations always look for skilled employees to achieve their goals and rely heavily on human resource teams or staffing agencies to hire the best ones.
Besides talent acquisition, HR teams up with official administrators to make informed workforce planning and management decisions. They use people management software and big data analytics to view and analyze significant metrics relating to employee productivity.
You must be curious about how data science empowers HR professionals worldwide. Don’t miss out on reading this blog on human resource data analytics.
What is Human Resource Analytics?
HR analytics is also called people, workforce, and talent analytics.
It involves gathering, analyzing, and managing data to make informed decisions about talent acquisition, retention, and overall team productivity.
Enterprises using business automation tools for leave and attendance management software, employee retention, and recruitment deploy data analytics in human resource management.
What are the Types of HR Analytics?
There are four types of HR analytics techniques: descriptive analytics, diagnostic analytics, predictive analytics, and prescriptive analytics.
Descriptive analytics: It involves analyzing data patterns and gaining insights from historical data using data visualization such as leaves taken, attendance, active hours, etc. It helps them understand past events without making future forecasts.
Diagnostic analytics: This technique goes beyond descriptive analytics to understand the underlying reasons behind issues identified from historical data. It covers metrics for payouts, leaves, skill training, net income per employee, etc.
Predictive analytics: It helps anticipate outcomes of processes based on past and present data, leading to more efficient recruitment and employee engagement strategies. Most recruitment consultants even hire data science experts for predictive modeling and insights.
Prescriptive analytics: It provides recommendations for future actions based on predictive analytics and other data-related insights.
What are the Benefits of Data Analytics in HR?
HR analytics enhances talent acquisition by leveraging big data trends. It contributes to workforce planning, employee experience, and training.
Here are a few other advantages of HR analytics for recruitment consultants and enterprises working with them:
Employee Retention Rates
Data analytics provides insights to improve recruiting and onboarding processes. It helps in understanding employee satisfaction, turnover rates, and misconduct.
Optimized Allocation of Resources
With big data engineering services and analytics, HR managers can ensure precise allocation of resources so that they can easily visualize staff utilization.
Unified Employee Support
People analytics offers transparency in employer-employee relationships. It uses cloud data engineering solutions to introduce a flexible support channel for employees to connect with HR, share concerns, and get direct updates.
Accelerated Business Growth
HRs using big data and analytics are more likely to retain a valuable workforce for higher productivity. As a result, they contribute to upscaling business growth to a great extent.
At BluEnt, our data analysts use advanced machine learning algorithms to match the needs of growing organizations.
For HR analytics, we bring certified and experienced industry experts to assist recruitment agencies and HR professionals in decision-making.
Whether you want to elevate your workforce productivity or improve your talent-hunting techniques, enterprise-grade data solutions and analytics can be a game changer for your business. Get in touch to implement big data in your human resource operations.
0 notes
Photo

Nvidia has announced the availability of DGX Cloud on Oracle Cloud Infrastructure. DGX Cloud is a fast, easy and secure way to deploy deep learning and AI applications. It is the first fully integrated, end-to-end AI platform that provides everything you need to train and deploy your applications.
#AI#Automation#Data Infrastructure#Enterprise Analytics#ML and Deep Learning#AutoML#Big Data and Analytics#Business Intelligence#Business Process Automation#category-/Business & Industrial#category-/Computers & Electronics#category-/Computers & Electronics/Computer Hardware#category-/Computers & Electronics/Consumer Electronics#category-/Computers & Electronics/Enterprise Technology#category-/Computers & Electronics/Software#category-/News#category-/Science/Computer Science#category-/Science/Engineering & Technology#Conversational AI#Data Labelling#Data Management#Data Networks#Data Science#Data Storage and Cloud#Development Automation#DGX Cloud#Disaster Recovery and Business Continuity#enterprise LLMs#Generative AI
0 notes
Text
got jumpscared by these ‘cus it looks like he is a junior analyst at an investment bank


from mclaren’s ig
#he would be lethal on a Bloomberg terminal#his data-backed rizz would have no limits#that’s why his forehead’s so big it’s full of analytical secrets#Oscar piastri#op81#you don’t get him he’s just at one with capital markets like a gen z dollar sign megamind#wiz.yaps
413 notes
·
View notes
Text
The U.S. intelligence community is now buying up vast volumes of sensitive information that would have previously required a court order, essentially bypassing the Fourth Amendment.
#illegal
#big brother#spyware#data analytics#privacy#online privacy#private data#intelligence services#cia#fbi#mossad#creepy#fourth amendment#usa#us politics#secrets#personal data
3 notes
·
View notes
Text
Abathur

At Abathur, we believe technology should empower, not complicate.
Our mission is to provide seamless, scalable, and secure solutions for businesses of all sizes. With a team of experts specializing in various tech domains, we ensure our clients stay ahead in an ever-evolving digital landscape.
Why Choose Us? Expert-Led Innovation – Our team is built on experience and expertise. Security First Approach – Cybersecurity is embedded in all our solutions. Scalable & Future-Proof – We design solutions that grow with you. Client-Centric Focus – Your success is our priority.
#Software Development#Web Development#Mobile App Development#API Integration#Artificial Intelligence#Machine Learning#Predictive Analytics#AI Automation#NLP#Data Analytics#Business Intelligence#Big Data#Cybersecurity#Risk Management#Penetration Testing#Cloud Security#Network Security#Compliance#Networking#IT Support#Cloud Management#AWS#Azure#DevOps#Server Management#Digital Marketing#SEO#Social Media Marketing#Paid Ads#Content Marketing
2 notes
·
View notes
Text
Understanding Outliers in Machine Learning and Data Science

In machine learning and data science, an outlier is like a misfit in a dataset. It's a data point that stands out significantly from the rest of the data. Sometimes, these outliers are errors, while other times, they reveal something truly interesting about the data. Either way, handling outliers is a crucial step in the data preprocessing stage. If left unchecked, they can skew your analysis and even mess up your machine learning models.
In this article, we will dive into:
1. What outliers are and why they matter.
2. How to detect and remove outliers using the Interquartile Range (IQR) method.
3. Using the Z-score method for outlier detection and removal.
4. How the Percentile Method and Winsorization techniques can help handle outliers.
This guide will explain each method in simple terms with Python code examples so that even beginners can follow along.
1. What Are Outliers?
An outlier is a data point that lies far outside the range of most other values in your dataset. For example, in a list of incomes, most people might earn between $30,000 and $70,000, but someone earning $5,000,000 would be an outlier.
Why Are Outliers Important?
Outliers can be problematic or insightful:
Problematic Outliers: Errors in data entry, sensor faults, or sampling issues.
Insightful Outliers: They might indicate fraud, unusual trends, or new patterns.
Types of Outliers
1. Univariate Outliers: These are extreme values in a single variable.
Example: A temperature of 300°F in a dataset about room temperatures.
2. Multivariate Outliers: These involve unusual combinations of values in multiple variables.
Example: A person with an unusually high income but a very low age.
3. Contextual Outliers: These depend on the context.
Example: A high temperature in winter might be an outlier, but not in summer.
2. Outlier Detection and Removal Using the IQR Method
The Interquartile Range (IQR) method is one of the simplest ways to detect outliers. It works by identifying the middle 50% of your data and marking anything that falls far outside this range as an outlier.
Steps:
1. Calculate the 25th percentile (Q1) and 75th percentile (Q3) of your data.
2. Compute the IQR:
{IQR} = Q3 - Q1
Q1 - 1.5 \times \text{IQR}
Q3 + 1.5 \times \text{IQR} ] 4. Anything below the lower bound or above the upper bound is an outlier.
Python Example:
import pandas as pd
# Sample dataset
data = {'Values': [12, 14, 18, 22, 25, 28, 32, 95, 100]}
df = pd.DataFrame(data)
# Calculate Q1, Q3, and IQR
Q1 = df['Values'].quantile(0.25)
Q3 = df['Values'].quantile(0.75)
IQR = Q3 - Q1
# Define the bounds
lower_bound = Q1 - 1.5 * IQR
upper_bound = Q3 + 1.5 * IQR
# Identify and remove outliers
outliers = df[(df['Values'] < lower_bound) | (df['Values'] > upper_bound)]
print("Outliers:\n", outliers)
filtered_data = df[(df['Values'] >= lower_bound) & (df['Values'] <= upper_bound)]
print("Filtered Data:\n", filtered_data)
Key Points:
The IQR method is great for univariate datasets.
It works well when the data isn’t skewed or heavily distributed.
3. Outlier Detection and Removal Using the Z-Score Method
The Z-score method measures how far a data point is from the mean, in terms of standard deviations. If a Z-score is greater than a certain threshold (commonly 3 or -3), it is considered an outlier.
Formula:
Z = \frac{(X - \mu)}{\sigma}
is the data point,
is the mean of the dataset,
is the standard deviation.
Python Example:
import numpy as np
# Sample dataset
data = {'Values': [12, 14, 18, 22, 25, 28, 32, 95, 100]}
df = pd.DataFrame(data)
# Calculate mean and standard deviation
mean = df['Values'].mean()
std_dev = df['Values'].std()
# Compute Z-scores
df['Z-Score'] = (df['Values'] - mean) / std_dev
# Identify and remove outliers
threshold = 3
outliers = df[(df['Z-Score'] > threshold) | (df['Z-Score'] < -threshold)]
print("Outliers:\n", outliers)
filtered_data = df[(df['Z-Score'] <= threshold) & (df['Z-Score'] >= -threshold)]
print("Filtered Data:\n", filtered_data)
Key Points:
The Z-score method assumes the data follows a normal distribution.
It may not work well with skewed datasets.
4. Outlier Detection Using the Percentile Method and Winsorization
Percentile Method:
In the percentile method, we define a lower percentile (e.g., 1st percentile) and an upper percentile (e.g., 99th percentile). Any value outside this range is treated as an outlier.
Winsorization:
Winsorization is a technique where outliers are not removed but replaced with the nearest acceptable value.
Python Example:
from scipy.stats.mstats import winsorize
import numpy as np
Sample data
data = [12, 14, 18, 22, 25, 28, 32, 95, 100]
Calculate percentiles
lower_percentile = np.percentile(data, 1)
upper_percentile = np.percentile(data, 99)
Identify outliers
outliers = [x for x in data if x < lower_percentile or x > upper_percentile]
print("Outliers:", outliers)
# Apply Winsorization
winsorized_data = winsorize(data, limits=[0.01, 0.01])
print("Winsorized Data:", list(winsorized_data))
Key Points:
Percentile and Winsorization methods are useful for skewed data.
Winsorization is preferred when data integrity must be preserved.
Final Thoughts
Outliers can be tricky, but understanding how to detect and handle them is a key skill in machine learning and data science. Whether you use the IQR method, Z-score, or Wins
orization, always tailor your approach to the specific dataset you’re working with.
By mastering these techniques, you’ll be able to clean your data effectively and improve the accuracy of your models.
#science#skills#programming#bigdata#books#machinelearning#artificial intelligence#python#machine learning#data centers#outliers#big data#data analysis#data analytics#data scientist#database#datascience#data
4 notes
·
View notes
Text
instagram
Hey there! 🚀 Becoming a data analyst is an awesome journey! Here’s a roadmap for you:
1. Start with the Basics 📚:
- Dive into the basics of data analysis and statistics. 📊
- Platforms like Learnbay (Data Analytics Certification Program For Non-Tech Professionals), Edx, and Intellipaat offer fantastic courses. Check them out! 🎓
2. Master Excel 📈:
- Excel is your best friend! Learn to crunch numbers and create killer spreadsheets. 📊🔢
3. Get Hands-on with Tools 🛠️:
- Familiarize yourself with data analysis tools like SQL, Python, and R. Pluralsight has some great courses to level up your skills! 🐍📊
4. Data Visualization 📊:
- Learn to tell a story with your data. Tools like Tableau and Power BI can be game-changers! 📈📉
5. Build a Solid Foundation 🏗️:
- Understand databases, data cleaning, and data wrangling. It’s the backbone of effective analysis! 💪🔍
6. Machine Learning Basics 🤖:
- Get a taste of machine learning concepts. It’s not mandatory but can be a huge plus! 🤓🤖
7. Projects, Projects, Projects! 🚀:
- Apply your skills to real-world projects. It’s the best way to learn and showcase your abilities! 🌐💻
8. Networking is Key 👥:
- Connect with fellow data enthusiasts on LinkedIn, attend meetups, and join relevant communities. Networking opens doors! 🌐👋
9. Certifications 📜:
- Consider getting certified. It adds credibility to your profile. 🎓💼
10. Stay Updated 🔄:
- The data world evolves fast. Keep learning and stay up-to-date with the latest trends and technologies. 📆🚀
. . .
#programming#programmers#developers#mobiledeveloper#softwaredeveloper#devlife#coding.#setup#icelatte#iceamericano#data analyst road map#data scientist#data#big data#data engineer#data management#machinelearning#technology#data analytics#Instagram
8 notes
·
View notes
Text

Pickl.AI offers a comprehensive approach to data science education through real-world case studies and practical projects. By working on industry-specific challenges, learners gain exposure to how data analysis, machine learning, and artificial intelligence are applied to solve business problems. The hands-on learning approach helps build technical expertise while developing critical thinking and problem-solving abilities. Pickl.AI’s programs are designed to prepare individuals for successful careers in the evolving data-driven job market, providing both theoretical knowledge and valuable project experience.
#Pickl.AI#data science#data science certification#data science case studies#machine learning#AI#artificial intelligence#data analytics#data science projects#career in data science#online education#real-world data science#data analysis#big data#technology
2 notes
·
View notes
Text
How DeepSeek AI Revolutionizes Data Analysis
1. Introduction: The Data Analysis Crisis and AI’s Role2. What Is DeepSeek AI?3. Key Features of DeepSeek AI for Data Analysis4. How DeepSeek AI Outperforms Traditional Tools5. Real-World Applications Across Industries6. Step-by-Step: Implementing DeepSeek AI in Your Workflow7. FAQs About DeepSeek AI8. Conclusion 1. Introduction: The Data Analysis Crisis and AI’s Role Businesses today generate…
#AI automation trends#AI data analysis#AI for finance#AI in healthcare#AI-driven business intelligence#big data solutions#business intelligence trends#data-driven decisions#DeepSeek AI#ethical AI#ethical AI compliance#Future of AI#generative AI tools#machine learning applications#predictive modeling 2024#real-time analytics#retail AI optimization
3 notes
·
View notes
Text
French initiative for responsible AI leaders - AI News
New Post has been published on https://thedigitalinsider.com/french-initiative-for-responsible-ai-leaders-ai-news/
French initiative for responsible AI leaders - AI News
ESSEC Business School and Accenture have announced the launch of a new initiative, ‘AI for Responsible Leadership,’ which marks the 10th anniversary of the establishment of the role of Chair at ESSEC, titled the ESSEC Accenture Strategic Business Analytics Chair.
The initiative aims to encourage the use of artificial intelligence by leaders in ways that are responsible and ethical, and that lead to high levels of professional performance. It aims to provide current and future leaders with the skills they require when faced with challenges in the future; economic, environmental, or social.
Several organisations support the initiative, including institutions, businesses, and specialised groups, including ESSEC Metalab for Data, Technology & Society, and Accenture Research.
Executive Director of the ESSEC Metalab, Abdelmounaim Derraz, spoke of the collaboration, saying, “Technical subjects are continuing to shake up business schools, and AI has opened up opportunities for collaboration between partner companies, researchers, and other members of the ecosystem (students, think tanks, associations, [and] public service).”
ESSEC and Accenture aim to integrate perspectives from multiple fields of expertise, an approach that is a result of experimentation in the decade the Chair has existed.
The elements of the initiative include workshops and talks designed to promote the exchange of knowledge and methods. It will also include a ‘barometer’ to help track AI’s implementation and overall impact on responsible leadership.
The initiative will engage with a network of institutions and academic publications, and an annual Grand Prix will recognise projects that focus on and explore the subject of AI and leadership.
Fabrice Marque, founder of the initiative and the current ESSEC Accenture Strategics Business Analytics Chair, said, “For years, we have explored the potential of using data and artificial intelligence in organisations. The synergies we have developed with our partners (Accenture, Accor, Dataiku, Engie, Eurofins, MSD, Orange) allowed us to evaluate and test innovative solutions before deploying them.
“With this initiative, we’re taking a major step: bringing together an engaged ecosystem to sustainably transform how leaders think, decide, and act in the face of tomorrow’s challenges. Our ambition is clear: to make AI a lever for performance, innovation and responsibility for […] leaders.”
Managing Director at Accenture and sponsor of the ESSEC/Accenture Chair and initiative, Aurélien Bouriot, said, “The ecosystem will benefit from the resources that Accenture puts at its disposal, and will also benefit our employees who participate.”
Laetitia Cailleteau, Managing Director at Accenture and leader of Responsible AI & Generative AI for Europe, highlighted the importance of future leaders understanding all aspects of AI.
“AI is a pillar of the ongoing industrial transformation. Tomorrow’s leaders must understand the technical, ethical, and human aspects and risks – and know how to manage them. In this way, they will be able to maximise value creation and generate a positive impact for the organisation, its stakeholders and society as a whole.”
Image credit: Wikimedia Commons
See also: Microsoft and OpenAI probe alleged data theft by DeepSeek
Want to learn more about AI and big data from industry leaders? Check out AI & Big Data Expo taking place in Amsterdam, California, and London. The comprehensive event is co-located with other leading events including Intelligent Automation Conference, BlockX, Digital Transformation Week, and Cyber Security & Cloud Expo.
Explore other upcoming enterprise technology events and webinars powered by TechForge here.
#accenture#ai#ai & big data expo#ai news#amp#Analytics#anniversary#approach#artificial#Artificial Intelligence#automation#Big Data#Business#business analytics#california#Cloud#Collaboration#Companies#comprehensive#conference#cyber#cyber security#data#data theft#deepseek#deploying#Digital Transformation#economic#education#employees
3 notes
·
View notes
Text
For anyone currently in school or recently in school

I am doing a few guest lectures at some of the universities in my state and working on my presentation. Curious if anyone has any recommendations of topics they really enjoyed from a past guest speaker that isn't major/field-specific?
#college#college student#studying#studyblr#school#university#accounting#finance#consulting#data analytics#data analysis#data visualization#big data#data
22 notes
·
View notes
Text
How Dr. Imad Syed Transformed PiLog Group into a Digital Transformation Leader?
The digital age demands leaders who don’t just adapt but drive transformation. One such visionary is Dr. Imad Syed, who recently shared his incredible journey and PiLog Group’s path to success in an exclusive interview on Times Now.
In this inspiring conversation, Dr. Syed reflects on the milestones, challenges, and innovative strategies that have positioned PiLog Group as a global leader in data management and digital transformation.
The Journey of a Visionary:
From humble beginnings to spearheading PiLog’s global expansion, Dr. Syed’s story is a testament to resilience and innovation. His leadership has not only redefined PiLog but has also influenced industries worldwide, especially in domains like data governance, SaaS solutions, and AI-driven analytics.
PiLog’s Success: A Benchmark in Digital Transformation:
Under Dr. Syed’s guidance, PiLog has become synonymous with pioneering Lean Data Governance SaaS solutions. Their focus on data integrity and process automation has helped businesses achieve operational excellence. PiLog’s services are trusted by industries such as oil and gas, manufacturing, energy, utilities & nuclear and many more.
Key Insights from the Interview:
In the interview, Dr. Syed touches upon:
The importance of data governance in digital transformation.
How PiLog’s solutions empower organizations to streamline operations.
His philosophy of continuous learning and innovation.
A Must-Watch for Industry Leaders:
If you’re a business leader or tech enthusiast, this interview is packed with actionable insights that can transform your understanding of digital innovation.
👉 Watch the full interview here:
youtube
The Global Impact of PiLog Group:
PiLog’s success story resonates globally, serving clients across Africa, the USA, EU, Gulf countries, and beyond. Their ability to adapt and innovate makes them a case study in leveraging digital transformation for competitive advantage.
Join the Conversation:
What’s your take on the future of data governance and digital transformation? Share your thoughts and experiences in the comments below.
#datamanagement#data governance#data analysis#data analytics#data scientist#big data#dataengineering#dataprivacy#data centers#datadriven#data#businesssolutions#techinnovation#businessgrowth#businessautomation#digital transformation#piloggroup#drimadsyed#timesnowinterview#datascience#artificialintelligence#bigdata#datadrivendecisions#Youtube
3 notes
·
View notes
Text
In the subject of data analytics, this is the most important concept that everyone needs to understand. The capacity to draw insightful conclusions from data is a highly sought-after talent in today's data-driven environment. In this process, data analytics is essential because it gives businesses the competitive edge by enabling them to find hidden patterns, make informed decisions, and acquire insight. This thorough guide will take you step-by-step through the fundamentals of data analytics, whether you're a business professional trying to improve your decision-making or a data enthusiast eager to explore the world of analytics.
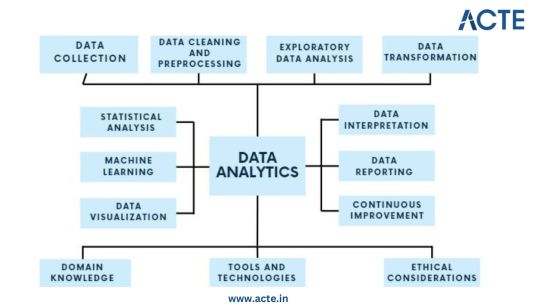
Step 1: Data Collection - Building the Foundation
Identify Data Sources: Begin by pinpointing the relevant sources of data, which could include databases, surveys, web scraping, or IoT devices, aligning them with your analysis objectives. Define Clear Objectives: Clearly articulate the goals and objectives of your analysis to ensure that the collected data serves a specific purpose. Include Structured and Unstructured Data: Collect both structured data, such as databases and spreadsheets, and unstructured data like text documents or images to gain a comprehensive view. Establish Data Collection Protocols: Develop protocols and procedures for data collection to maintain consistency and reliability. Ensure Data Quality and Integrity: Implement measures to ensure the quality and integrity of your data throughout the collection process.
Step 2: Data Cleaning and Preprocessing - Purifying the Raw Material
Handle Missing Values: Address missing data through techniques like imputation to ensure your dataset is complete. Remove Duplicates: Identify and eliminate duplicate entries to maintain data accuracy. Address Outliers: Detect and manage outliers using statistical methods to prevent them from skewing your analysis. Standardize and Normalize Data: Bring data to a common scale, making it easier to compare and analyze. Ensure Data Integrity: Ensure that data remains accurate and consistent during the cleaning and preprocessing phase.
Step 3: Exploratory Data Analysis (EDA) - Understanding the Data
Visualize Data with Histograms, Scatter Plots, etc.: Use visualization tools like histograms, scatter plots, and box plots to gain insights into data distributions and patterns. Calculate Summary Statistics: Compute summary statistics such as means, medians, and standard deviations to understand central tendencies. Identify Patterns and Trends: Uncover underlying patterns, trends, or anomalies that can inform subsequent analysis. Explore Relationships Between Variables: Investigate correlations and dependencies between variables to inform hypothesis testing. Guide Subsequent Analysis Steps: The insights gained from EDA serve as a foundation for guiding the remainder of your analytical journey.
Step 4: Data Transformation - Shaping the Data for Analysis
Aggregate Data (e.g., Averages, Sums): Aggregate data points to create higher-level summaries, such as calculating averages or sums. Create New Features: Generate new features or variables that provide additional context or insights. Encode Categorical Variables: Convert categorical variables into numerical representations to make them compatible with analytical techniques. Maintain Data Relevance: Ensure that data transformations align with your analysis objectives and domain knowledge.
Step 5: Statistical Analysis - Quantifying Relationships
Hypothesis Testing: Conduct hypothesis tests to determine the significance of relationships or differences within the data. Correlation Analysis: Measure correlations between variables to identify how they are related. Regression Analysis: Apply regression techniques to model and predict relationships between variables. Descriptive Statistics: Employ descriptive statistics to summarize data and provide context for your analysis. Inferential Statistics: Make inferences about populations based on sample data to draw meaningful conclusions.
Step 6: Machine Learning - Predictive Analytics
Algorithm Selection: Choose suitable machine learning algorithms based on your analysis goals and data characteristics. Model Training: Train machine learning models using historical data to learn patterns. Validation and Testing: Evaluate model performance using validation and testing datasets to ensure reliability. Prediction and Classification: Apply trained models to make predictions or classify new data. Model Interpretation: Understand and interpret machine learning model outputs to extract insights.
Step 7: Data Visualization - Communicating Insights
Chart and Graph Creation: Create various types of charts, graphs, and visualizations to represent data effectively. Dashboard Development: Build interactive dashboards to provide stakeholders with dynamic views of insights. Visual Storytelling: Use data visualization to tell a compelling and coherent story that communicates findings clearly. Audience Consideration: Tailor visualizations to suit the needs of both technical and non-technical stakeholders. Enhance Decision-Making: Visualization aids decision-makers in understanding complex data and making informed choices.
Step 8: Data Interpretation - Drawing Conclusions and Recommendations
Recommendations: Provide actionable recommendations based on your conclusions and their implications. Stakeholder Communication: Communicate analysis results effectively to decision-makers and stakeholders. Domain Expertise: Apply domain knowledge to ensure that conclusions align with the context of the problem.
Step 9: Continuous Improvement - The Iterative Process
Monitoring Outcomes: Continuously monitor the real-world outcomes of your decisions and predictions. Model Refinement: Adapt and refine models based on new data and changing circumstances. Iterative Analysis: Embrace an iterative approach to data analysis to maintain relevance and effectiveness. Feedback Loop: Incorporate feedback from stakeholders and users to improve analytical processes and models.
Step 10: Ethical Considerations - Data Integrity and Responsibility
Data Privacy: Ensure that data handling respects individuals' privacy rights and complies with data protection regulations. Bias Detection and Mitigation: Identify and mitigate bias in data and algorithms to ensure fairness. Fairness: Strive for fairness and equitable outcomes in decision-making processes influenced by data. Ethical Guidelines: Adhere to ethical and legal guidelines in all aspects of data analytics to maintain trust and credibility.
Data analytics is an exciting and profitable field that enables people and companies to use data to make wise decisions. You'll be prepared to start your data analytics journey by understanding the fundamentals described in this guide. To become a skilled data analyst, keep in mind that practice and ongoing learning are essential. If you need help implementing data analytics in your organization or if you want to learn more, you should consult professionals or sign up for specialized courses. The ACTE Institute offers comprehensive data analytics training courses that can provide you the knowledge and skills necessary to excel in this field, along with job placement and certification. So put on your work boots, investigate the resources, and begin transforming.
24 notes
·
View notes
Text
Big Data and AI: The Perfect Partnership for Future Innovations

Innovation allows organizations to excel at differentiation, boosting competitive advantages. Amid the growth of industry-disrupting technologies, big data analytics and artificial intelligence (AI) professionals want to support brands seeking bold design, delivery, and functionality ideas. This post discusses the importance of big data and AI, explaining why they matter to future innovations and business development.
Understanding Big Data and AI
Big data is a vast data volume, and you will find mixed data structures because of continuous data collection involving multimedia data objects. A data object or asset can be a document, an audio track, a video clip, a photo, or identical objects with special file formats. Since big data services focus on sorting and exploring data objects’ attributes at an unprecedented scale, integrating AI tools is essential.
Artificial intelligence helps computers simulate human-like thinking and idea synthesis capabilities. Most AI ecosystems leverage advanced statistical methods and machine learning models. Their developers train the AI tools to develop and document high-quality insights by processing unstructured and semi-structured data objects.
As a result, the scope of big data broadens if you add AI integrations that can determine data context. Businesses can generate new ideas instead of recombining recorded data or automatically filter data via AI-assisted quality assurances.
Why Are Big Data and AI Perfect for Future Innovations?
1| They Accelerate Scientific Studies
Material sciences, green technology projects, and rare disorder research projects have provided humans with exceptional lifestyle improvements. However, as markets mature, commoditization becomes inevitable.
At the same time, new, untested ideas can fail, attracting regulators’ dismay, disrespecting consumers’ beliefs, or hurting the environment. Additionally, bold ideas must not alienate consumers due to inherent complexity. Therefore, private sector stakeholders must employ scientific methods to identify feasible, sustainable, and consumer-friendly product ideas for brand differentiation.
AI-powered platforms and business analytics solutions help global corporations immediately acquire, filter, and document data assets for independent research projects. For instance, a pharmaceutical firm can use them during clinical drug formulations and trials, while a car manufacturer might discover efficient production tactics using AI and big data.
2| Brands Can Objectively Evaluate Forward-Thinking Business Ideas
Some business ideas that a few people thought were laughable or unrealistic a few decades ago have forced many brands and professionals to abandon conventional strategies. Consider how streaming platforms’ founders affected theatrical film releases. They have reduced the importance of box office revenues while increasing independent artists’ discoverability.
Likewise, exploring real estate investment opportunities on a tiny mobile or ordering clothes online were bizarre practices, according to many non-believers. They also predicted socializing through virtual reality (VR) avatars inside a computer-generated three-dimensional space would attract only the tech-savvy young adults.
Today, customers and investors who underestimated those innovations prefer religiously studying how disrupting startups perform. Brands care less about losing money than missing an opportunity to be a first mover for a niche consumer base. Similarly, rejecting an idea without testing it at least a few times has become a taboo.
Nobody can be 100% sure which innovation will gain global momentum, but AI and big data might provide relevant hints. These technologies are best for conducting unlimited scenario analyses and testing ideas likely to satisfy tomorrow’s customer expectations.
3| AI-Assisted Insight Explorations Gamifies Idea Synthesis
Combining a few ideas is easy but finding meaningful and profitable ideas by sorting the best ones is daunting. Innovative individuals must embrace AI recommendations to reduce time spent on brainstorming, product repurposing, and multidisciplinary collaborations. Furthermore, they can challenge themselves to find ideas better than an AI tool.
Gamification of brainstorming will facilitate a healthy pursuit of novel product features, marketing strategies, and customer journey personalization. Additionally, incentivizing employees to leverage AI and big data to experiment with designing methods provides unique insights for future innovations.
4| You Can Optimize Supply Chain Components with Big Data and AI Programs
AI can capture extensive data on supply chains and offer suggestions on alternative supplier relations. Therefore, businesses will revise supply and delivery planning to overcome the flaws in current practices.
For instance, Gartner awarded Beijing’s JD.com the Technology Innovation Award in 2024 because they combined statistical forecasting. The awardee has developed an explainable artificial intelligence to enhance its supply chain. Other finalists in this award category were Google, Cisco, MTN Group, and Allina Health.
5| Academia Can Embrace Adaptive Learning and Psychological Well-Being
Communication barriers and trying to force all learners to follow the standard course material based on a fixed schedule have undermined educational institutions’ goals worldwide. Understandably, expecting teachers to customize courses and multimedia assets for each student is impractical and humanly infeasible.
As a result, investors, policymakers, parents, and student bodies seek outcome-oriented educational innovations powered by AI and big data for a learner-friendly, inclusive future. For instance, some edtech providers use AI computer-aided learning and teaching ecosystems leveraging videoconferencing, curriculum personalization, and psycho-cognitive support.
Adaptive learning applications build student profiles and segments like marketers’ consumer categorizations. Their AI integrations can determine the ideal pace for teaching, whether a student exhibits learning disabilities, and whether a college or school has adequate resources.
Challenges in Promoting Innovations Based on Big Data and AI Use Cases
Encouraging stakeholders to acknowledge the need for big data and AI might be challenging. After all, uninformed stakeholders are likely to distrust tech-enabled lifestyle changes. Therefore, increasing AI awareness and educating everyone on data ethics are essential.
In some regions, the IT or network infrastructure necessary for big data is unavailable or prone to stability flaws. This issue requires more investments and talented data specialists to leverage AI tools or conduct predictive analyses.
Today’s legal frameworks lack provisions for regulating AI, big data, and scenario analytics. So, brands are unsure whether expanding data scope will get public administrators’ approvals. Lawmakers must find a balanced approach to enable AI-powered big data innovations without neglecting consumer rights or “privacy by design” principles.
Conclusion
The future of enterprise, institutional, and policy innovations lies in responsible technology implementations. Despite the obstacles, AI enthusiasts are optimistic that more stakeholders will admire the potential of new, disruptive technologies.
Remember, gamifying how your team finds new ideas or predicting the actual potential of a business model necessitates AI’s predictive insights. At the same time, big data will offer broader perspectives on global supply chains and how to optimize a company’s policies.
Lastly, academic improvements and scientific research are integral to developing sustainable products, accomplishing educational objectives, and responding to global crises. As a result, the informed stakeholders agree that AI and big data are perfect for shaping future innovations.
2 notes
·
View notes
Text


I thought this one would be just another developer of mobile game that use The Sims 4 contents in its (fake) ads to fraud users by making people belive it is its game, when it has a completely different gameplay.
Unfortunately, Room Makover by FlyBird Casual Games is much more than this.
Room Makover has plenty of false ads. This time I actually tried the game, because the pictures and videos on Google Play were cute and I decided to give it a try.
I was so naive. Happens that the whole page on Google Play is full of fake contents.
It's just one of those mobile games in which you have to match and remove nails. Every time you pass a level, you will rewarded with bills that you can use to unlock part of a building under "makeover". You have just three option for every part of the building or the room to choose between.
There is nothing creative. Not actual building or cluttering rooms or decoring.
As, always, since I'm a curious little bitch, I decided to dig further into this FlyBird Casual Game and... Oh. God. Their site looks even less legit than LUCKY FORTUNE GAMES' one!
It is just a void page. There is nothing here. NOTHING. The only two working section are the privacy and conditions of use, in which they try to convince you that they didn't have any liability for damages or fraud committed.
The privacy one is curious, because mentions this Commissioner's Office in UK and a long list of partners. Both for ads and for data collection, which is hugely uncommon for this kind of games.
Sooooo... In this magical list of apps, I noticed a few tech nightmares, which I will explain briefly here:
Aarki is an AI company that builds advertising solutions to drive mobile revenue growth. Traslated from bullshit: they use AI to generate fake ads and sells it to shady corps.
Blind Ferret is the big deal here! Not only gave you digital marketing solutions, data collection and analytics, but also pays influencers and product placement on social media to promote the game and, hear me out, CREATE fake ads too! It's literally written in their site: "Our Creative Services don’t just make things look pretty. Our team uses data to guide us! How do we make brands shine? By turning the arts into a numbers game with top-performing creative content." This include: Graphic Design, Illustration, 2D Animation, Video Editing and Composition, Copywriting and conceptualizing.
InMobi is a big Corp that does native advertising, which means promoted contents, collabs with influencers, etc.
Ironsource. This one is a fucking cancer. IronSource Ltd. is an Israeli software company that focuses on developing technologies for app monetization and distribution, with its core production focused on the app economy. That would sound harmless, but Samsung use it in its budget and midrange smartphone to install multiple third-party apps during the set-up process. This platform slips bloatware on the pretext of recommended apps, leading to apps clutter and reduction in on-board storage space. The only purpose it exists on Samsung phones is to download games without your consent with no way to remove it (no app installed).
Mintegral is another fucking tech nightmare. Not only poses serious threats to your privacy and datas, but also uses malicious codes to spy your activity and when you seem intentioned to install a mobile app, Mintegral’s software would then fire off fake clicks on non-existent ads to claim credit for the install and essentially collect a bounty from app publishers who pay ad networks to promote their apps.
Mistplay is one of those "play to earn bucks" that I find very very dangerous. Because YOUR data are their revenue.
Tapjoy does monetization of ads and also surveys, that force users to download one from a long list of games, download it and playing for hours or since it is gained some in-game prize. This surveys are rewarded with credits and user can spend on the mobile game they actually want to play. Tapjoy has a huge market among IMVU users, who need credits to buy piece of clothing and accessories for their avi.
The other apps do mobile app marketing, using data collection that allow shady corps to target more gullable and naive people to scam. Plus they do also monetization surveys to earn money and at the same time forcefully grow the engagement of this shady corps.


Obviously, there is no user support mail listed in their Google Play page, but at least this has a contact mail listed on their website: [email protected]
As always, stay safe and please tell me if you know more about everything above or know the person who create this build first.
Help people to stay safe.
Thank you.
<<< previous Coloring app uses design of The Sims 4 builds without the consent of the creators and other mobile developers steal TS4 speed build contents and claim it's the actual gameplay of their mobile game.
#vavuskapakage#the sims 4 build#sims 4 build#ts4 build#mobile gaming#mobile games#fake ads#fake advertising#fake game#caught stealing#stealing content#stop stealing#scam alert#fake games#google play#fraud alert#internet fraud#fraud allegations#internet privacy#data protection#data breach#data analytics#datascience#big data#fraud#mobile ads#google ads#facebook ads#ads#false advertising
2 notes
·
View notes
Text
Decisiones Basadas en Datos, Resultados Reales
Transforma datos complejos en acciones concretas. Descubre cómo en Maedcore impulsamos el crecimiento empresarial con análisis avanzado.
🔗 Más detalles en: https://maedcore.com/analisis-de-datos/
2 notes
·
View notes