#american community survey
Text
so apparently, the US census is about to make 40% of disabled people disappear in its data.
they gonna change the disability-related questions, and then only count the two most negative answers as a disability. and also the new version will do even worse than the old version at counting disabled ppl who are chronically and/or mentally ill. and just in time for long covid to create more of exactly those kinds of disabled ppl [/tinfoil hat]
article about the change they're trying to make:
https://nationalpartnership.org/new-census-proposal-would-reduce-disabled-women-girls-counted-nearly-10-million/?fbclid=IwAR09pGjYoMwdik6mo-uzEOf3kD7xe2oLIEU7wlm7wWlV9ykbgq02_fljJr8
on how to leave a public comment to try to make that not happen:
#disability rights#census#long covid#disability#ableism#disability discrimination#nothing about us without us#ada#american community survey#signal boost#us census
104 notes
·
View notes
Text
Detroit Population Density Map 2020
Detroit Population Density Map 2020
It’s always important to assess and re-assess where population is dense based on the most recent Census estimates via the American Community Survey (ACS). The ACS is not the most perfect survey tool, but it is the best data that we have access to on a regular basis. A notable concern with the 2020 Census is the expanding undercount of Black, Latino, and Native American peoples.
Population…

View On WordPress
#American Community Survey#cartography#Census#Detroit#downtown#Far East#geography#Greater Downtown#map#Northwest#population#population density#Southwest
0 notes
Text
Census BS
https://americanyellowvest.wpcomstaging.com/wp-content/uploads/2022/05/census.mp4
View On WordPress
0 notes
Text

Thanks for Participating. Post It Forward for Higher Participation.
#food#breakfast#foodies#food lovers#comfort food#food culture#foodblogger#lunch#dinner#coffeelovers#research#survey#polls#everyonelovestoeat#american culture#black american culture#culture studies#women writers#writing community
91 notes
·
View notes
Text
Here is a brief summary of what is happening in Wikipedia right now:
In the last few years (3-4 years) the WikiProject Indigenous peoples of North America, which was originally created to improve the quality and coverage of native issues and native articles on wikipedia, has been hijacked by a small number of users with an extremist agenda. They have been working diligently over the last few years to change the definition of both what it means to be an Indigenous American and even what it means to be state and federally recognized.
The four or five key players (Mainly Editor Yuchitown, Bohemian Baltimore, ARoseWolf, (now retired editor CorbieVreccan, Netherzone and Oncamera) who are part of the “Native American Articles Improvement Project” started implementing these changes slowly, but they started pursuing their goals aggressively after November 2023, when state-recognized tribes retained their voting rights in NCAI. Essentially, after the movement to delegitimize state-recognized tribes failed officially, the key players doubled down on altering and controlling the flow of information about Native Americans through Wikipedia.
The talk page of Lily Gladstone’s article has a relevant discussion here. Initially, the leaders of the WikiProject removed any reference to her being a “Native American Actress” and instead had her as “Self-identifying as Blackfoot” and “Self-identifying as Nez Perce” because her blood quantum was too low to be enrolled in either tribe.
You can see some of the discussion here:
https://en.wikipedia.org/wiki/Talk:Lily_Gladstone
Eventually they relented and changed her category to being “Of Nez Perce Descent” but you can see in the discussion that they are referring to an article that these editors (Yuchitown, Bohemian Baltimore, and CorbieVreccan) themselves appeared to have mostly written and revised:
https://en.wikipedia.org/wiki/Native_American_identity_in_the_United_States
This statement is very much at odds with even the government’s description, as seen below;
The DOJ Office of Tribal Justice Office on their webpage “Frequently Asked Questions About Native American”, question “Who is an American Indian or Alaskan Native” states:
“As a general principle, an Indian is a person who is of some degree Indian blood and is recognized as an Indian by a Tribe and/or the United States. No single federal or tribal criterion establishes a person's identity as an Indian. Government agencies use differing criteria to determine eligibility for programs and services. Tribes also have varying eligibility criteria for membership.”
In addition, “List” pages have been created on Wikipedia for federally and state recognized tribes. The Wikipedia “List” page for state-recognized tribes is inaccurate in its interpretation of state recognition and not supported by expert reliable sources--(1) Cohen’s Handbook of Federal Indian Law 2012 edition, (2) NCSL.org current stand on state recognition (not the archived list from 2017 which NCSL no longer supports), (3) Koenig & Stein’s paper “Federalism and the State Recognition of Native American Tribes: a survey of state-recognized tribes and state recognition processes across the United States” (both 2008 & updated 2013 in book “ Recognition, sovereignty struggles, and indigenous rights in the United States: A sourcebook”)
https://en.wikipedia.org/wiki/State-recognized_tribes_in_the_United_States
State-recognized tribes who have received recognition through less formal but acceptable means have been moved from the Wikipedia list page on state-recognized tribes to the Wikipedia list page of unrecognized or self-identifying organizations.
The Wiki page "List of organizations that self-identify as Native American tribes", in particular, is being used to purposely defame legitimate Native American individuals who are members of the tribes/Native communities that are on this list.
By the parameters set up on Wikipedia, only the colonizer’s governments can acknowledge who is Native American through either federal recognition or state recognition. If an individual is not a member of a federally or state-recognized tribe, then it is determined that they cannot be Native American and are, instead, considered “self-identifying” or only “a descendant of ...” (example Lily Gladstone). As a result, Native individuals are currently being tagged as “self-identifying” and their names are put on “list” pages that strongly imply they are “pretend” Indians.
These editors have indicated that they would like “self-identification” to be the default setting for any people who they deem do not fit within the parameters that they themselves created within Wikipedia.
Moreof, these editors are admin and senior editors within the Wikiproject Indigenous Peoples of North America, and are being called in specifically to weigh on Native Identity, and any project involving any Indigenous Group.
Any attempt to correct misinformation, add information, or change any of these articles is often met with being blocked, reported for various offenses, or reported for having a Conflict of Interest, whether or not that is actually applicable. They have use this strategically in many different pages for many different individuals and groups within the scope of their Wikiprojects.
While changing things in Wikipedia does not change the truth, it is a way to control how most people take in information, and thus they hope to manipulate the narrative to better suit their goals.
This is quick and messy but:
Here is a link to the google document with the other state recognized tribes (Including yours) that were edited by these editors. This is an incomplete list so far that only goes back to September 2023 but I am going to add to it. If you can add to your own part of this list, and send your complaints and information to the arbitrator committee (the email is below) with the involved editors, this will help our case.
The more tribes who complain, and the more Wikipedia editors complain, the better our case will be.
https://docs.google.com/document/d/1YNDEjLTrrZ_mMIRCVxtvt69FwCYpJWKs71lBhWa5a9M/edit?usp=sharing
The place to make complaints on Wikipedia is oversight-en-wpwikipedia.org , and
arbcom-enwikimedia.org . It is most helpful to have an editing account on Wikipedia, because Yuchitown and the others will try to defend themselves using Wikipedia methodology and make anyone who confronts them look like the aggressor (see the other tribes who tried to fight back on Wikipedia I found).
The more people and tribes make complaints the more likely it is that this will work and we can rid ourselves of these monsters.
Some of the tribes I have spoken to are taking legal action against these editors. Any groups affected by their policies should also reach out to the news to make knowledge of this more widespread.
Thank you
- quoted with permission from an email sent by an associate of my tribe. Message me for their email address if you'd like to reach out to them.
#indigenous#intertribal infighting#state recognized tribes#seaconke Wampanoag#our chief and first councilman were at NCAI and there was ver nearly physical violence about this issue#Seaconke Wampanoag is recognized in MA and currently pursuing recognition by RI#like we gave active bills in tge state house
3K notes
·
View notes
Text
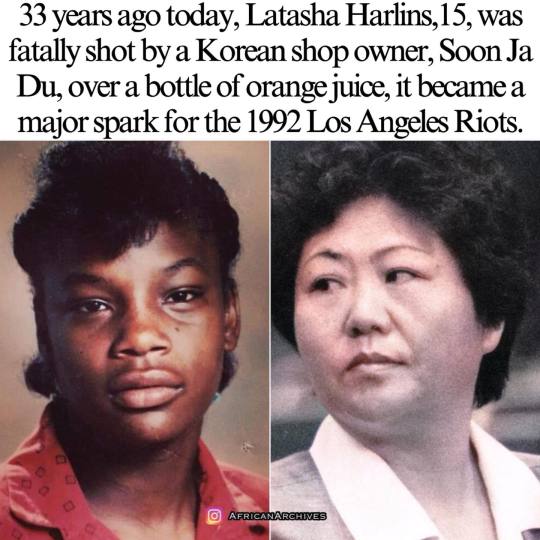
On March 16, 1991 Latasha Harlin’s short life came to a violent end in the midst of racial tensions in LA, and became a major spark for the 1992 Los Angeles Riots.
By the late 1980s, racial tensions were high in South Los Angeles.
After the change in national immigration laws in 1965 a large number of Korean immigrants arrived in Los Angeles and by 1968 the first Korean-owned market opened in South Central LA.
Longtime African American residents in the area at first welcomed the Koreans but eventually grew angry with them because they refused to hire black employees and often treated their customers poorly.
By 1990, 65% of South Central businesses were Korean-owned and a 1992 survey of these storeowners revealed considerable racial prejudice against black customers and black people in general.
Koreans in response argued that their attitudes evolved from high crime rates in the area and shop owner fears of shootings and burglaries. Latasha Harlins became a victim of these racial tensions on the morning of Saturday, March 16, 1991.
She entered a store owned by a Korean family, to purchase a bottle of orange juice. As she approached the counter, Soon Ja Du, accused her of stealing after seeing her place the bottle in her backpack, despite her holding the $2 payment approaching the counter to pay.
Du grabbed the bag and the two women had a violent scuffle. Harlins threw the juice bottle back on the counter and turned to leave the store when Du pulled a .38-caliber handgun and shot 15-year-old Harlins in the back of the head.
Du was arrested and her trial was held on November 15, 1991. Security-camera footage which showed Harlins’ attempt to pay for the juice and the subsequent scuffle between the two women convinced a jury to find Du guilty of voluntary manslaughter.
The Judge, Joyce Karlin, rejected the jury’s recommendation and instead sentenced Du to five years probation, 400 hours of community service, and a $500 fine.
One of the many reasons black people don't f*** with Asians like that and we should collectively drive them out of our neighborhoods
#latasha harlins#los angeles riots#racial tensions#korean immigrants#south los angeles#soon ja du#racial prejudice#voluntary manslaughter#racial discrimination#asian anti blackness#asian racism
254 notes
·
View notes
Text
Alphaworld File 1: Oral History
The universe is multifarious, constantly diverging as new choices are made. Spinning away through time, these alternate realities become locked away from our own, so we can never know exactly what would have happened if a single choice was made differently.
Except, sometimes, two of those worlds, careening through the upper dimensions, happen to converge. As they slide past each other, they may line up just so, each leaving behind fragments as they continue their journey into their divergent futures. You’ve never heard of this, because the remnants, mostly data, are swiftly collected by various government agencies and collected into reports on the intercepted reality.
This report collects various scientific articles, personal journals, news reels, and even a documentary series from one such reality, codenamed Alphaworld. In this world, gay men have not only become the norm, but have seemingly replaced all other people. In this world, society is stratified into an apparently biological hierarchy of homosexual castes, based on men’s physical characteristics and psychologies. Upon finishing the following fragment from a peer-reviewed article that was a trace recovered from Alphaworld, please select the next fragment you would like to consume.
X
An Oral History of the Creation and Initial Spread of the Alpha Phenomenon, by Alpha Dr. Jose Martinez
Until recently, it was not known what sparked the spread of the Alpha Phenomenon which has wholly remade the world in recent years. This was until Alpha Joshua Dearfoot, who resides with his Betas in rural ex-Ontario, stated during a livestream on OnlyFans that he is the original Alpha.
Alpha Dearfoot does not interact with Betas from outside his harem unless they renounce their current Alpha. As this research team contains no unbonded Betas—Alpha Dr. Martinez says we can’t spend too much time with non-harem Betas—we investigated among those close to Alpha Dearfoot, conducting interviews and surveying in the local area to discover as much as we could.
Joshua, as he was known before the emergence of the Alpha Phenomenon, was a PhD candidate in nanotechnology, with a secondary focus in physiology. Photographs kept by his father (Beta to Alpha Sean Barehill) reveal that through his youth and young adulthood Joshua was physically unimpressive, with a physique not even reaching the base level expected of a Beta.
According to a classmate of Joshua’s from university (Beta to Alpha Liam Oliver), Joshua was studious but insecure: “I mean, I used to push him around all the time for being a fa— gay kid. Gay and a nerd? In the Old World, that was, like, the worst thing.” When asked about whether he has properly apologised, the Beta said, in a rapturous voice, “Oh, yeah, Alpha Dearfoot was my first. He disciplined me so well I could barely walk, I came like four times. Then he told me to come join Alpha Liam’s harem. I mean, he wasn’t Alpha Liam then, I was one of the first guys to go full Beta on campus.”
It appears that Alpha Dearfoot had a difficult youth, growing up unable to meet certain Old World expectations of manhood. The masculine stereotypes of Native Americans also seem to have weighed on him, as he was entirely unable to meet them. As his father told us, “Joshua was a sweet kid, but he got bullied for being too short and scrawny, not matching the image of an “Indian” in all these bigoted kids’ heads. He was obsessed with growing bigger, which is why he went into physio.” Remember, in some communities it is normal for a Beta father to continue to refer to his Alpha son by his first name.
According to Sigma Harrison White, a former lab partner of Dearfoot’s who fucked us on his lawn in exchange for this interview, Joshua was obsessed with creating some way to become more manly. “He spent some really long evenings in the lab,” said Harrison while one of us squealed in the grass beneath him. “One morning he came out with this manic grin on his face, said that he’d finally done it, and ran off. Two weeks later, he came back a full Alpha.” At this point, Harrison’s pace slowed down as he became contemplative. “It was only after he started hooking up with all the queer guys on campus that we started becoming Alphas and Sigmas and stuff, too.”
Did Alpha Dearfoot intend for the Alpha Phenomenon to be infectious? A Beta from his harem claims not. “He got home from school one morning all excited about some project he’d finished,” the Beta told us—it seems that he and Alpha Dearfoot were childhood friends. “The next day, he seemed a little different, a little more muscular, more assertive. He seemed really satisfied for about a week, then he got scared. He just kept getting bigger. The day he got taller than me and nearly broke a bar at the gym doing deadlifts, I started feeling the Beta change.
“I went to him and started telling him about my muscle gains and all the weird thoughts and sensations I was experiencing, and he got really scared,” the Beta continued, his eyes distant. “I started to comfort him, and that was when we felt the bond form. It felt so right for him to be my first, to finger me open and fill me with his still-growing dick.”
While we pressed for more details about what may have been the first Alpha/Beta bond in history, the Beta refused to disclose more information, claiming that it was private to him and his Alpha. For the reader’s imagination, see Figure A to find a picture of Alpha Dearfoot from his Instagram profile.

Alpha Dearfoot appears to have intended to create a nanomachine-based masculinity booster, and the transmissibility of the Alpha Phenomenon, as well as the behavioural and sexual changes it induces, were unintended side effects, perhaps introduced in the particles’ replication process. The effects of the Alpha Phenomenon on aging and physical fitness may also be unexpected consequences of Alpha Dearfoot's programming efforts.
According to Alpha Young Baek Hyeon, who lives in the former New York area with a mixed harem, he and Alpha Dearfoot attempted to “date,” an outmoded practice common in the Old World, during the early weeks of the Alpha Phenomenon’s spread. “Alpha DeWayne and I work well together,” Alpha Young told us by video call, “but we’re both pretty chill even since we changed. Alpha Dearfoot and I couldn’t even stand to be in the same room once I had transformed. He’s one of the most territorial Alphas I’ve ever met, he can barely stand to have another Alpha within a mile of him.” As Alpha Young spoke, we watched a well-trained Beta enter the room with a plate of apple slices and present them to his Alpha.
“He was really torn up about it, too. Even though we couldn’t stop yelling at each other in person or over the phone, he left me a ton of really sweet voice messages about how much he’d liked me before we became Alphas.” Alpha Young took a bite of apple and ruffled his Beta’s hair, causing all of us to shudder with phantom pleasure at the affection. With a contemplative expression, Alpha Young said, “No, I don’t think he meant for any of this to happen.”
While this study has yielded plenty of useful biographical information about the man apparently responsible for the Alpha Phenomenon that changed the world, we appear no closer to understanding the precise mechanism of that change. With better access to the programming of the nanomachines, perhaps it would be possible to reduce the natural aggressiveness of the Alphas, allowing Alphas like Dearfoot to return to their studies or jobs if they so wish. In the following section, we will propose potential opportunities for further research in the effort to isolate the Alpha Phenomenon.
Or vote on Strawpoll here: https://strawpoll.com/wby5A0vw8yA
This series is my way of celebrating reaching 2000 followers! I hope you enjoy this glimpse into Alphaworld and vote on what file you would like to see next. There is no strict update schedule, so you good boys better be on the lookout for a new chapter you can vote on ;)
169 notes
·
View notes
Text
I feel like we need to talk about how increasingly poor reading literacy (in America, ofc) is causing subtle negative effects that affect daily lives and make it extremely difficult to understand arguments, analysis, data, and other content, and it is undoubtedly affecting the political sphere.
Over half of Americans 16-74 have a reading comprehension lower than 6th-grade level (source linked below). This is honestly a crisis, yet we already have so many other critical emergencies going on that it’s put on the back-burner. Many people are looking at headlines referencing studies and assuming that whatever’s put in the headline is the truth (they’re often directly against findings or based on deeply flawed studies/surveys). Many don’t understand speeches and debates from politicians (and definitely not the implications they house). In this confusing, heavily biased and illicitly-funded era of endless headlines and content, many don’t even have a 6th-grade level of reading comprehension - how the hell are they going to understand even the basics that are already from unreliable sources?
I can’t help but to think that this may be part of the reason extremist ideologies (MAGA, anti-vaxxers, cultists, TRAs) are becoming increasingly popular. Now, people need to be told what an article or survey or study means - usually by the same people who are trying to get them on their side. Every single TRA I’ve encountered has had massive misunderstandings in the very basics of radfem ideology: they believe we want to kill all gender-nonconforming people, that we think trans-identified people should kill themselves, that we are all conservatives, that JKR has outright advocated for the murder of trans-identified people.
What scares me is that we have one side with all of the anti-vaxxers, MAGA-enthusiasts, and creepy religious cults, and on the other we have the TRA movement absolutely screaming we need for trans people to be catered for in every possible public setting or we’ll “have blood on our hands.” I think anti-vaxxers and the Bible-enthusiasts are more dangerous than TRAs, but at least they are recognised as dangerous. Both sides are controlled by at least one extremist ideology. What the hell are we to do in the 2024 election?
PLEASE take a college reading comprehension course if possible. Many community colleges offer courses cheap, and if it still isn’t feasible, there are plenty of sources online to help improve your reading comprehension.
#gender critical#radblr#radfems do interact#radical feminist#radfem#radical feminists do touch#terfsafe
175 notes
·
View notes
Text
The American Census Bureau is considering changes that would artificially decrease the number of disabled people in the US. We may be able to stop this.
According to this article from the Associated Press, the Census Bureau's proposed changes would align the way that the American Community Survey measures disability with international standards. They will be changing the way that some of the questions are worded, as well as changing the options for answers.
The problem is this: the questions about disability will ask if respondents if they have “no difficulty,” “some difficulty,” “a lot of difficulty” or “cannot do at all” with regard to things like hearing, seeing, ability to bathe or dress oneself, etc. Someone will only be counted as disabled if they answer "a lot of difficulty" or "cannot do at all." This excludes a lot of people. "During testing last year by the Census Bureau, the percentage of respondents who were defined as having a disability went from 13.9% using the current questions to 8.1% under the international standards. When the definition was expanded to also include “some difficulty,” it grew to 31.7%" (AP).
So what can we do? The Census Bureau is accepting public comment on the proposed changes until the end of the day on Tuesday, December 19th. Visit this link to submit your comments, and tell the Census Bureau why this change is a bad idea! Statistics show that at least 25% of Americans are disabled (CDC). We can't let the Census Bureau erase us.
Please share this widely, and submit your comments before the close of business on Tuesday, December 19th! I also highly encourage you to check out the Associate Press article linked above, since it does a good job of explaining the situation in more detail.
#disability#disability advocacy#signal boost#disabled#actually disabled#advocacy#social justice#current events#census#surveys#tagging to boost#disability justice#disability awareness#invisible disability#physical disability#intellectual disability#disability rights#spoonie#disability community
173 notes
·
View notes
Text
Power and Light Exhibit 💡
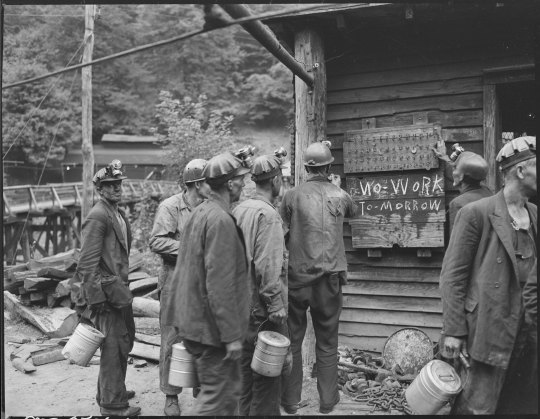
Immerse yourself in the Power & Light exhibit, a profound exploration of the coal miner’s life in 1946 America through the compassionate lens of Russell Lee. A master of documentary photography, Lee was tasked with an extraordinary project following labor strikes—a nationwide survey capturing the essence of remote coal communities. His photos, over 200 of which are featured in our #ArchivesPowerAndLight exhibit, shed light on the rich tapestry of everyday moments against the backdrop of a pivotal time in labor history.
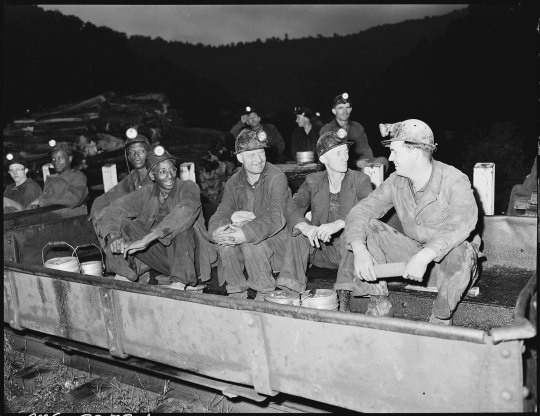
Beyond documenting the gritty realities of coal mining, Lee's photographs celebrate the strength, resilience, and unity of the families that powered these communities. From pride in their homes to solidarity in the mines, every image narrates a story woven into the broader American saga.
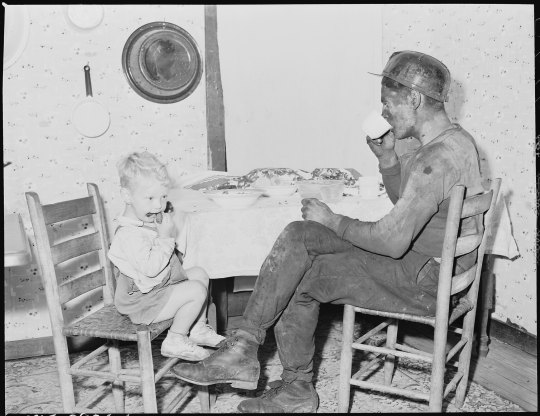
Lee, a notable figure among the greats like Walker Evans and Dorothea Lange, believed in the power of photography to create social change. He carried his camera through 13 states, into the homes and lives of those who toiled beneath the earth, and emerged with more than just images—he captured stories that continue to resonate with us today.
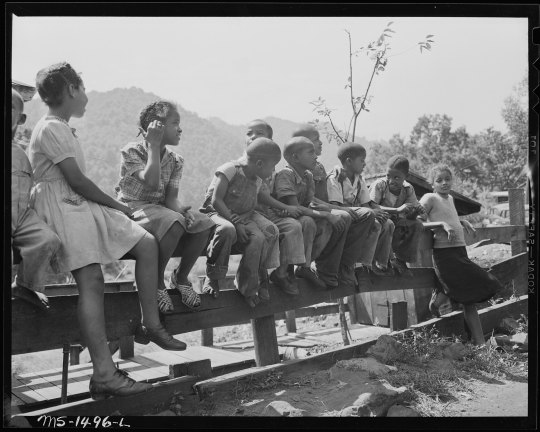
This exhibit invites you to traverse time and experience the power and light within this historical archive. Witness the intimate and candid moments Lee immortalized and see the enduring legacy of his work at the National Archives.
93 notes
·
View notes
Text
Poor people pay higher time tax
Doubtless you’ve heard that “we all get the same 24 hours in the day.” Of course it’s not true: rich people and poor people experience very different demands on their time. The richer you are, the more your time is your own — not only are many systems arranged with your convenience in mind, but you also command the social power to do something about systems that abuse your time.
If you’d like an essay-formatted version of this post to read or share, here’s a link to it on pluralistic.net, my surveillance-free, ad-free, tracker-free blog:
https://pluralistic.net/2023/02/10/my-time/#like-water-down-the-drain
For example: if you live in most American cities, public transit is slow, infrequent and overcrowded. Without a car, you lose hours every day to a commute spent standing on a lurching bus. And while a private car can substantially shorted that commute, people who can afford taxis or Ubers get even more time every day.
There’s a thick anthropological literature on the ways that cash-poverty translates into #TimePoverty. In David Graeber’s must-read essay “The Utopia of Rules,” he nails the way that capitalist societies generate Soviet-style bureaucracies, especially for poor people. Means-testing for benefits means that poor people spend endless hours filling in forms, waiting on hold, and lining up to see caseworkers to prove that they are among the “deserving poor” — not “mooches” who are defrauding the system:
https://memex.craphound.com/2015/02/02/david-graebers-the-utopia-of-rules-on-technology-stupidity-and-the-secret-joys-of-bureaucracy/
The social privilege gradient is also a time gradient: if you can afford a plane ticket, you can travel quickly across the country rather than losing days to the Greyhound or a road-trip. But if you’re even richer, you can pay for TSA Precheck and cut your airport security time from an hour to minutes. Go further up the privilege gradient and you’ll acquire airline status, shaving another hour off the check-in process.
This qualitative account of time poverty is well-developed, but it’s lacked a good, detailed quantitative counterpart, and our society often discounts qualitative work as mere anecdote and insists on having every story converted to numbers before it is taken seriously.
In “Examining inequality in the time cost of waiting,” published this month in Nature Human Behavior, public affairs researchers Steve Holt (SUNY) and Katie Vinopal (Ohio State) analyze data from the American Time Use Survey (AUTS) to produce a detailed, vibrant quantitative backstop to the qualitative narrative about time poverty:
https://www.nature.com/articles/s41562-023-01524-w
(The paper is paywalled, but the authors made a mostly final preprint available)
https://osf.io/preprints/socarxiv/jbk3x/download
The AUTS “collects retrospective time diary data from a nationally representative subsample drawn from respondents to the Census Bureau’s Community Population Survey (CPS) each year.” These time-diary entries are sliced up in 15-minute chunks.
Here’s what they found: first, there are categories of basic services where high-income people avoid waiting altogether, and where low-income people experience substantial waits. A person from a low-income household “an hour more waiting for the same set of services than people from high-income household.” That’s 73 hours/year.
Some of that gap (5%) is attributable to proximity. Richer people don’t have to go as far to access the same services as poorer people. Travel itself accounts for 2% more — poorer people wait longer for buses and have otherwise worse travel options.
A larger determinant of the gap (25%) is working flexibility. Poor people work jobs where they have less freedom to take time off to receive services, so they are forced to take appointments during peak hours.
Specific categories show more stark difference. If a poor person and a wealthy person go to the doctor’s on the same day, the poor person waits 46.28m to receive care, while the wealthy person waits 28.75m. The underlying dynamic here isn’t hard to understand. Medical practices that serve rich people have more staff.
The same dynamic plays out in grocery stores: poor people wait an average of 24m waiting every time they go shopping. For rich people, it’s 15m. Poor people don’t just wait in longer lines — they also have to wait for understaffed stores to unlock the cases that basic necessities are locked behind (poor people also travel longer to get to the grocery store — and they travel by slower means).
A member of a poor household with a chronic condition that requires two clinic visits per month loses an additional five hours/year to waiting rooms when compared to a wealthy person. As the authors point out, this also translates to delayed care, missed appointments, and exacerbated health conditions. Time poverty leads to health poverty.
All of this is worse for people of color: “Low-income White and Black Americans are both more likely to wait when seeking services than their wealthier same-race peer” but “wealthier White people face an average wait time of 28 minutes while wealthier Black people face a 54 minute average wait time…wealthier Black people do not receive the same time-saving attention from service providers that wealthier non-Black people receive” (there’s a smaller gap for Latino people, and no observed gap for Asian Americans.)
The gender gap is more complicated: “Low-income women are 3 percentage points more likely than low-income men and high-income women are 6 percentage points more likely than high-income men to use common services” — it gets even worse for low-income mothers, who take on the time-burdens associated with their kids’ need to access services.
Surprisingly, men actually end up waiting longer than women to access services: “low-income men spend about 6 more minutes than low-income women waiting for service…high-income men spend about 12 more minutes waiting for services than high-income women.”
Given the important role that scheduling flexibility plays in the time gap, the authors propose that interventions like subsidized day-care and afterschool programming could help parents access services at off-peak hours. They also echo Graeber’s call for reduced paperwork burdens for receiving benefits and accessing public services.
They recommend changes to labor law to protect the right of low-waged workers to receive services during off-peak hours, in the manner of their high-earning peers (they reference research that shows that this also improves worker productivity and is thus a benefit to employers as well as workers).
Finally, they come to the obvious point: making people less cash-poor will alleviate their time-poverty. Higher minimum wages, larger earned income tax credits, investments in low-income neighborhoods and better public transit will all give poor people more time and more money with which to command better services.
This week (Feb 13–17), I’ll be in Australia, touring my book Chokepoint Capitalism with my co-author, Rebecca Giblin. We’re doing a remote event for NZ on Feb 13. Next are Melbourne (Feb 14), Sydney (Feb 15) and Canberra (Feb 16/17). More tickets just released for Sydney!
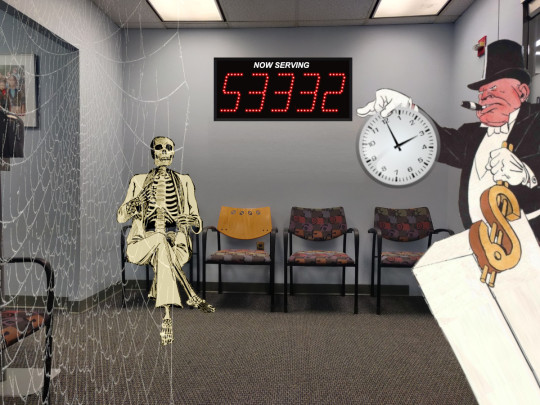
[Image ID: A waiting room, draped with cobwebs. A skeleton sits in one of the chairs. A digital display board reads 'Now serving 53332.' An ogrish, top-hatted figure standing at a podium, yanking a dollar-sign shaped lever looms into the frame from the right. He holds a clock aloft disdainfully, pinched between the thumb and fingers of one white-gloved hand.]
#pluralistic#scholarship#auts#american time use survey#time use#jenny odell#race#graeber#david graeber#how to do nothing#utopia of rules#inequality#gender#time poverty
797 notes
·
View notes
Note
I saw a post that was showing some statistics about trans women getting paid the least out of like al trans people like a way to discredit transandrophobia and compared us to cis mras and all I could think about was that trans men are the most likely to be suicidal out of all trans people and like I just wanted to scream at OP this isn't a competition we all are oppressed
Idk what study/studies they were citing, but I will say that this study suggests that trans pay rates are a bit more complicated than that?
They look at binary trans men (FTM), binary trans women (MTF), and genderqueer/nonbinary people AFAB & AMAB in the USA. Here are some findings:
Within the ‘Trans’ grouping, these estimates indicate that the income of FTMs ranges between 5–19% less than similarly situated MTFs. Within the ‘GQNB’ grouping, the income of AFAB GQNBs ranges between 9–22% less than AMAB GQNBs. For the ‘AMAB’ grouping, AMAB GQNBs income ranges 12–15% less than their MTF counterparts, with the exception of one insignificant decomposition estimate.28 Finally, AFAB GQNBs income ranges 13–26% less than their FTM counterparts in the ‘AFAB’ grouping.
Compared with this group, MTFs who transitioned from male-to-female later in life – between 25–29 years, 30–34 years, or ≥35 years – have incomes which are 30%, 43% and 52% more, respectively. In contrast, FTMs transitioning to male later in life is correlated with progressively lower incomes, with those transitioning at ≥35 years having 25% lower incomes than those who transitioned up to 24 years old
The two groups [identifying as wo/men vs. identifying as trans wo/men] of MTFs do not significantly differ along standard demographic or employment characteristics, while FTMs who identify as men have higher rates of education and income compared with their trans male identifying counterparts. The main differences in these groups are along trans specific characteristics. Those simply identifying as women and men are significantly more likely to have socially transitioned to living as their gender identity on a day-to-day basis, and to “pass” as their gender identity rather than their assigned sex. Of those who have socially transitioned, the age at which they began doing so does not significantly differ among these sub-groups of MTFs and FTMs.
Compared with ACS [American Community Survey] cis-men, those assigned male at birth (MTFs and AMAB GQNBs) have similar rates of labour force participation, while those assigned female at birth (FTMs and AFAB GQNBs) are around 4 percentage points more likely to be out of the labour force. Despite similar or lower rates of labour force participation, all transgender groups have higher rates of unemployment (5–8 pp) and, conditional on being in employment, being transgender is correlated with higher rates of part-time work (2–19 pp). All transgender groups have higher rates of poverty (8–16 pp) also.
This is just one study but I really like how it looks further into the issue and is inclusive of GQ/NB people. The authors actually point out how identifying as GQ/NB can result in worse treatment because of having a gender further outside the norm. I also find it interesting how they look at trans people who identify specifically as trans vs. just as men or women, and the result that trans-identified FTMs tend to have higher education and income- which could point to them having better access to transitioning through wealth and being more aligned with cisheternormative standards, giving them more experiences in line with cis men of their race and class, while FTMs who do not pass as cis(het) men feel their transness is more crucial to their experiences.
But anyways. Even if trans women are paid the least, that doesn't erase the real damage of anti-transmasculinity- but, also, it may be much more complex than that. There's a lot more variables to consider than just "trans or not trans." And, ultimately, we're all paid less as a result of being trans.
166 notes
·
View notes
Text
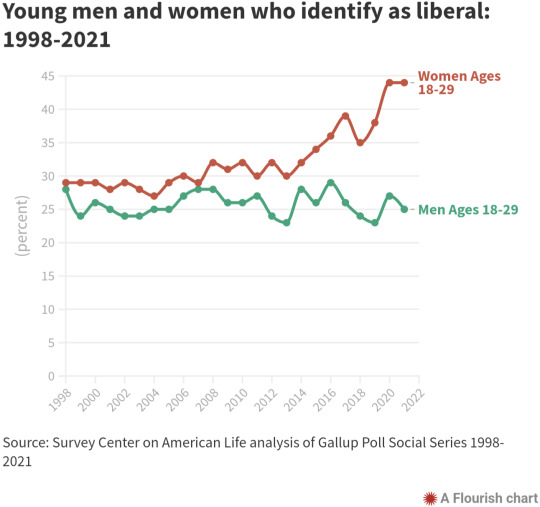
Young women are more likely to identify as liberal now than at any time in the past two decades, a trend that puts them squarely at odds with young men.
44% of young women counted themselves liberal in 2021, compared to 25% of young men, according to Gallup Poll data analyzed by the Survey Center on American Life. The gender gap is the largest recorded in 24 years of polling. The finding culminates years of rising liberalism among women ages 18 to 29, without any increase among their male peers.
Several societal forces have conspired to push young women to the left in recent years, including the #MeToo movement, former President Trump, rising LGBTQ identification and, most recently, abortion policy. Slower-cooking trends in marital status and educational attainment have also nudged the needle.
“I think there is a big generational shift that happened with Generation Z women who were really coming of age in the last five years,” said Kelsy Kretschmer, a sociologist at Oregon State University who studies gender politics.
The rift between young men and women may widen further. Earlier this year, the Supreme Court overturned Roe v. Wade, a precedent that had protected abortion as a constitutional right for nearly half a century. The ruling has energized young women. New survey data, released this week, shows that 61% of young women consider abortion a critical issue, compared with 36% of all Americans.
“I would always choose a candidate that’s pro-abortion,” said Rose Merjos, 21, a government major at Wesleyan University in Connecticut who is an avowed liberal. “Almost everyone either knows someone who has had an abortion or has had one themselves. This is something everyone can relate to.”
The share of men who identify as liberal has held fairly steady for almost 25 years, according to annual Gallup surveys. Roughly one-quarter of men ages 18 to 29 term themselves liberal, year after year.
Meanwhile, among young women, liberalism has exploded. In the late 1990s and early 2000s, fewer than 30% of women identified as liberal. The liberal camp grew through the second term of former President George W. Bush. It expanded further during the tenure of former President Obama. It reached 39% in 2017 with the inauguration of Trump. In the last two years, liberalism surged anew.
“Young women today are much more liberal than young men,” Daniel Cox wrote in a June newsletter of the Survey Center on American Life, a project of the American Enterprise Institute. His work documents “a growing political rift” between young women and men.
Merjos attends a university long associated with both liberalism and activism. These days, though, she senses more of both among the women.
“In all of my government classes, there are probably two men out of 18 people,” she said. “ACLU [American Civil Liberties Union], that’s mostly women. I’m wondering if women are maybe just more inclined to be involved in the community, engaged in the community. And that liberalizes them.”
Ezra Meyer, 22, is a senior at the George Washington (GW) University who leads the College Republicans. He is a conservative on a campus that is overwhelmingly liberal and largely female. In conversations with classmates about politics, he treads lightly.
“My metric for deciding if I’m going to be friends with someone really does not come down to what their politics are,” he said. “It comes down to how tolerant they are.”
Meyer doesn’t know whether the men at GW skew more liberal or conservative than the women. But he has noticed a distinct trend among campus conservatives this fall.
“We’ve been doing a lot of recruiting of freshmen on campus,” he said. “And I would say, overwhelmingly, it has been male. The conservative females that do get involved, there’s fewer of them, but they tend to be way more passionate and way more involved.”
Several factors have liberalized the nation’s 20-something women. The most recent, and perhaps the most powerful, is #MeToo, an uprising against sexual assault, abuse and harassment that caught fire in 2017, empowering millions of women to come forward and seek justice.
The inauguration of Trump in the same year pushed more young women into the liberal column. The 45th president battled his own #MeToo allegations and proved uniquely unpopular among young, female voters. Polling in 2016 showed that only 25% of women ages 18 to 34 favored Trump, compared with 40% of same-aged men.
The rise of liberalism among young women has also marched apace with a dramatic increase in young people identifying as lesbian, gay, bisexual, transgender or queer. In a recent survey, 56% of young women reported exclusive attraction to men, while three-quarters of young men said they were solely attracted to women. Prior research suggests LGBTQ Americans of all ages trend toward liberalism.
Several longer-term trends have fed the liberalization of young women as well. One is marriage. The share of women ages 18-29 who are married has fallen by half in twenty years, from 31% in 2000 to 15% in 2021, according to the National Opinion Research Center.
The growing ranks of single, 20-something women feel a sense of “linked fate,” researchers say. They gravitate toward female friends in political views, whereas married women more often mirror the politics of their spouses.
“The correlation between women’s sense of linked fate and liberal political preferences suggests that the Democratic Party will benefit” from declining marriage rates among young women, Kretschmer and two co-authors wrote in a 2017 paper for the journal Political Research Quarterly. They noted that “women make up the majority of the population and vote at high rates.”
Women also outpace men in educational attainment, a trend that dates to the 1980s. The ratio of women to men in college enrollment now stands at roughly 60 to 40, and it continues to grow. Americans who complete college are more liberal than those who do not.
“Putting off marriage, going to college, entering the workforce, women are doing that at much higher rates than they used to,” said Marc Hetherington, a professor of political science at the University of North Carolina at Chapel Hill. “And all of those things are going to make conservatism and the Republicans significantly less attractive to women.”
In 1998, the first year of data collected by Gallup in its Social Series surveys, 28% of young men and 29% of young women identified as liberal. The gender gap in liberalism grew steadily wider in the 2000s, wider still in the 2010s. The 2021 poll yielded a 19-point spread between young men and young women, the largest on record.
“I do have some male friends that are moderate,” said Luci Paczkowski, 20, a California liberal. “And it annoys the hell out of me.”
What bothers Paczkowski about her nonliberal friends is not their centrism but her suspicion that they “do not have any clue why they are moderate. They just do not want to pick a side and, therefore, they are apathetic.”
#us politics#news#the hill#2022#liberals#liberalism#Democrats#polls#polling#Survey Center on American Life#Gallup Poll#conservatives#conservatism#republicans#graphs#data#National Opinion Research Center
363 notes
·
View notes
Text
….? Someone replied to my post on my side blog about trans men being extremely vulnerable to sexual assault and statistics to show how trans men - especially black and Native American trans men - are sexually assaulted at the highest rate of trans community by saying “oh what do you think trans women never get sexually assaulted?” like . Where did I say that. Trans women are 4x more likely to be sexually assaulted compared to cis women. Trans women are vulnerable to sexual assault.
Me saying “trans men - especially black and Native American trans men - are extremely vulnerable to sexual assault. Multiple surveys have shows that trans men experience the highest rate of sexual assault in the trans community and that black and Native American trans men specifically are the vulnerable to sexual assault” is not me saying “trans women never get sexually assaulted”
And of course when I checked the persons bio it said ‘tme’. Like shhhh stop speaking for trans women and acting like you’re fighting for trans women when you erase the experiences of trans men .
98 notes
·
View notes
Text
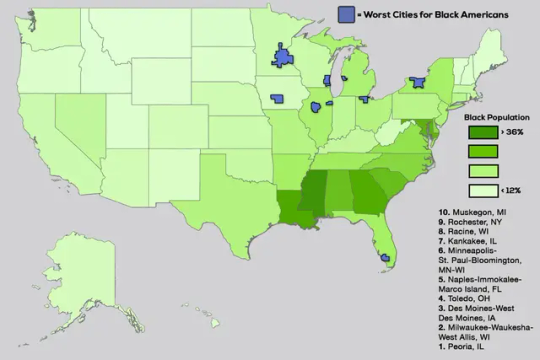
Where It’s Most Dangerous to Be Black in America
Black Americans made up 13.6% of the US population in 2022 and 54.1% of the victims of murder and non-negligent manslaughter, aka homicide. That works out, according to Centers for Disease Control and Prevention data, to a homicide rate of 29.8 per 100,000 Black Americans and four per 100,000 of everybody else.(1)
A homicide rate of four per 100,000 is still quite high by wealthy-nation standards. The most up-to-date statistics available from the Organization for Economic Cooperation and Development show a homicide of rate one per 100,000 in Canada as of 2019, 0.8 in Australia (2021), 0.4 in France (2017) and Germany (2020), 0.3 in the UK (2020) and 0.2 in Japan (2020).
But 29.8 per 100,000 is appalling, similar to or higher than the homicide rates of notoriously dangerous Brazil, Colombia and Mexico. It also represents a sharp increase from the early and mid-2010s, when the Black homicide rate in the US hit new (post-1968) lows and so did the gap between it and the rate for everybody else. When the homicide rate goes up, Black Americans suffer disproportionately. When it falls, as it did last year and appears to be doing again this year, it is mostly Black lives that are saved.
As hinted in the chart, racial definitions have changed a bit lately; the US Census Bureau and other government statistics agencies have become more open to classifying Americans as multiracial. The statistics cited in the first paragraph of this column are for those counted as Black or African American only. An additional 1.4% of the US population was Black and one or more other race in 2022, according to the Census Bureau, but the CDC Wonder (for “Wide-ranging Online Data for Epidemiologic Research”) databases from which most of the statistics in this column are drawn don’t provide population estimates or calculate mortality rates for this group. My estimate is that its homicide rate in 2022 was about six per 100,000.
A more detailed breakdown by race, ethnicity and gender reveals that Asian Americans had by far the lowest homicide rate in 2022, 1.6, which didn’t rise during the pandemic, that Hispanic Americans had similar homicide rates to the nation as a whole and that men were more than four times likelier than women to die by homicide in 2022. The biggest standout remained the homicide rate for Black Americans.

Black people are also more likely to be victims of other violent crime, although the differential is smaller than with homicides. In the 2021 National Crime Victimization Survey from the Bureau of Justice Statistics (the 2022 edition will be out soon), the rate of violent crime victimization was 18.5 per 1,000 Black Americans, 16.1 for Whites, 15.9 for Hispanics and 9.9 for Asians, Native Hawaiians and other Pacific Islanders. Understandably, Black Americans are more concerned about crime than others, with 81% telling Pew Research Center pollsters before the 2022 midterm elections that violent crime was a “very important” issue, compared with 65% of Hispanics and 56% of Whites.
These disparities mainly involve communities caught in cycles of violence, not external predators. Of the killers of Black Americans in 2020 whose race was known, 89.4% were Black, according to the FBI. That doesn’t make those deaths any less of a tragedy or public health emergency. Homicide is seventh on the CDC’s list of the 15 leading causes of death among Black Americans, while for other Americans it’s nowhere near the top 15. For Black men ages 15 to 39, the highest-risk group, it’s usually No. 1, although in 2022 the rise in accidental drug overdoses appears to have pushed accidents just past it. For other young men, it’s a distant third behind accidents and suicides.
To be clear, I do not have a solution for this awful problem, or even much of an explanation. But the CDC statistics make clear that sky-high Black homicide rates are not inevitable. They were much lower just a few years ago, for one thing, and they’re far lower in some parts of the US than in others. Here are the overall 2022 homicide rates for the country’s 30 most populous metropolitan areas.
Metropolitan areas are agglomerations of counties by which economic and demographic data are frequently reported, but seldom crime statistics because the patchwork of different law enforcement agencies in each metro area makes it so hard. Even the CDC, which gets its mortality data from state health departments, doesn’t make it easy, which is why I stopped at 30 metro areas.(2)
Sorting the data this way does obscure one key fact about homicide rates: They tend to be much higher in the main city of a metro area than in the surrounding suburbs.
But looking at homicides by metro area allows for more informative comparisons across regions than city crime statistics do, given that cities vary in how much territory they cover and how well they reflect an area’s demographic makeup. Because the CDC suppresses mortality data for privacy reasons whenever there are fewer than 10 deaths to report, large metro areas are good vehicles for looking at racial disparities. Here are the 30 largest metro areas, ranked by the gap between the homicide rates for Black residents and for everybody else.
The biggest gap by far is in metropolitan St. Louis, which also has the highest overall homicide rate. The smallest gaps are in metropolitan San Diego, New York and Boston, which have the lowest homicide rates. Homicide rates are higher for everybody in metro St. Louis than in metro New York, but for Black residents they’re six times higher while for everyone else they’re just less than twice as high.
There do seem to be some regional patterns to this mayhem. The metro areas with the biggest racial gaps are (with the glaring exception of Portland, Oregon) mostly in the Rust Belt, those with the smallest are mostly (with the glaring exceptions of Boston and New York) in the Sun Belt. Look at a map of Black homicide rates by state, and the highest are clustered along the Mississippi River and its major tributaries. Southern states outside of that zone and Western states occupy roughly the same middle ground, while the Northeast and a few middle-of-the-country states with small Black populations are the safest for their Black inhabitants.(3)
Metropolitan areas in the Rust Belt and parts of the South stand out for the isolation of their Black residents, according to a 2021 study of Census data from Brown University’s Diversity and Disparities Project, with the average Black person living in a neighborhood that is 60% or more Black in the Detroit; Jackson, Mississippi; Memphis; Chicago; Cleveland and Milwaukee metro areas in 2020 (in metro St. Louis the percentage was 57.6%). Then again, metro New York and Boston score near the top on another of the project’s measures of residential segregation, which tracks the percentage of a minority group’s members who live in neighborhoods where they are over-concentrated compared with White residents, so segregation clearly doesn’t explain everything.
Looking at changes over time in homicide rates may explain more. Here’s the long view for Black residents of the three biggest metro areas. Again, racial definitions have changed recently. This time I’ve used the new, narrower definition of Black or African American for 2018 onward, and given estimates in a footnote of how much it biases the rates upward compared with the old definition.
All three metro areas had very high Black homicide rates in the 1970s and 1980s, and all three experienced big declines in the 1990s and 2000s. But metro Chicago’s stayed relatively high in the early 2010s then began a rebound in mid-decade that as of 2021 had brought the homicide rate for its Black residents to a record high, even factoring in the boost to the rate from the definitional change.
What happened in Chicago? One answer may lie in the growing body of research documenting what some have called the “Ferguson effect,” in which incidents of police violence that go viral and beget widespread protests are followed by local increases in violent crime, most likely because police pull back on enforcement. Ferguson is the St. Louis suburb where a 2014 killing by police that local prosecutors and the US Justice Department later deemed to have been in self-defense led to widespread protests that were followed by big increases in St. Louis-area homicide rates. Baltimore had a similar viral death in police custody and homicide-rate increase in 2015. In Chicago, it was the October 2014 shooting death of a teenager, and more specifically the release a year later of a video that contradicted police accounts of the incident, leading eventually to the conviction of a police officer for second-degree murder.

It’s not that police killings themselves are a leading cause of death among Black Americans. The Mapping Police Violence database lists 285 killings of Black victims by police in 2022, and the CDC reports 209 Black victims of “legal intervention,” compared with 13,435 Black homicide victims. And while Black Americans are killed by police at a higher rate relative to population than White Americans, this disparity — 2.9 to 1 since 2013, according to Mapping Police Violence — is much less than the 7.5-to-1 ratio for homicides overall in 2022. It’s the loss of trust between law enforcement agencies and the communities they serve that seems to be disproportionately deadly for Black residents of those communities.
The May 2020 murder of George Floyd by a Minneapolis police officer was the most viral such incident yet, leading to protests nationwide and even abroad, as well as an abortive local attempt to disband and replace the police department. The Minneapolis area subsequently experienced large increases in homicides and especially homicides of Black residents. But nine other large metro areas experienced even bigger increases in the Black homicide rate from 2019 to 2022.
A lot of other things happened between 2019 and 2022 besides the Floyd protests, of course, and I certainly wouldn’t ascribe all or most of the pandemic homicide-rate increase to the Ferguson effect. It is interesting, though, that the St. Louis area experienced one of the smallest percentage increases in the Black homicide rate during this period, and it decreased in metro Baltimore.
Also interesting is that the metro areas experiencing the biggest percentage increases in Black residents’ homicide rates were all in the West (if your definition of West is expansive enough to include San Antonio). If this were confined to affluent areas such as Portland, Seattle, San Diego and San Francisco, I could probably spin a plausible-sounding story about it being linked to especially stringent pandemic policies and high work-from-home rates, but that doesn’t fit Phoenix, San Antonio or Las Vegas, so I think I should just admit that I’m stumped.
The standout in a bad way has been the Portland area, which had some of the longest-running and most contentious protests over policing, along with many other sources of dysfunction. The area’s homicide rate for Black residents has more than tripled since 2019 and is now second highest among the 30 biggest metro areas after St. Louis. Again, I don’t have any real solutions to offer here, but whatever the Portland area has been doing since 2019 isn’t working.
(1) The CDC data for 2022 are provisional, with a few revisions still being made in the causes assigned to deaths (was it a homicide or an accident, for example), but I’ve been watching for weeks now, and the changes have been minimal. The CDC is still using 2021 population numbers to calculate 2022 mortality rates, and when it updates those, the homicide rates will change again, but again only slightly. The metropolitan-area numbers also don’t reflect a recent update by the White House Office of Management and Budget to its list of metro areas and the counties that belong to them, which when incorporated will bring yet more small mortality-rate changes. To get these statistics from the CDC mortality databases, I clicked on “Injury Intent and Mechanism” and then on “Homicide”; in some past columns I instead chose “ICD-10 Codes” and then “Assault,” which delivered slightly different numbers.
(2) It’s easy to download mortality statistics by metro area for the years 1999 to 2016, but the databases covering earlier and later years do not offer this option, and one instead has to select all the counties in a metro area to get area-wide statistics, which takes a while.
(3) The map covers the years 2018-2022 to maximize the number of states for which CDC Wonder will cough up data, although as you can see it wouldn’t divulge any numbers for Idaho, Maine, Vermont and Wyoming (meaning there were fewer than 10 homicides of Black residents in each state over that period) and given the small numbers involved, I wouldn’t put a whole lot of stock in the rates for the Dakotas, Hawaii, Maine and Montana.
(https://www.washingtonpost.com/business/2023/09/14/where-it-s-most-dangerous-to-be-black-in-america/cdea7922-52f0-11ee-accf-88c266213aac_story.html)
139 notes
·
View notes
Last Seen Blogs

cattiittii
Get Penis Blasted

wearechicoscivamps
THIS IS NOT A CHICOSCI FAN BLOG

madantane-blog
Untitled

sara-danica-and-other-babes
Danica, Sara and other Babes

panicatthecriscogainer
Panicatthecrisco