#merging dataframes
Explore tagged Tumblr posts
Visit Tumblr Blog
Explore Tumblr blogs with no restrictions, modern design and the best experience.
Last Seen Tumblr Blogs


Fun Fact
12.7% of mobile users access Tumblr.
Text
DataFrame in Pandas: Guide to Creating Awesome DataFrames
Explore how to create a dataframe in Pandas, including data input methods, customization options, and practical examples.
Data analysis used to be a daunting task, reserved for statisticians and mathematicians. But with the rise of powerful tools like Python and its fantastic library, Pandas, anyone can become a data whiz! Pandas, in particular, shines with its DataFrames, these nifty tables that organize and manipulate data like magic. But where do you start? Fear not, fellow data enthusiast, for this guide will…
View On WordPress
#advanced dataframe features#aggregating data in pandas#create dataframe from dictionary in pandas#create dataframe from list in pandas#create dataframe in pandas#data manipulation in pandas#dataframe indexing#filter dataframe by condition#filter dataframe by multiple conditions#filtering data in pandas#grouping data in pandas#how to make a dataframe in pandas#manipulating data in pandas#merging dataframes#pandas data structures#pandas dataframe tutorial#python dataframe basics#rename columns in pandas dataframe#replace values in pandas dataframe#select columns in pandas dataframe#select rows in pandas dataframe#set column names in pandas dataframe#set row names in pandas dataframe
0 notes
Text
Python for Data Science: The Only Guide You Need to Get Started in 2025
Data is the lifeblood of modern business, powering decisions in healthcare, finance, marketing, sports, and more. And at the core of it all lies a powerful and beginner-friendly programming language — Python.
Whether you’re an aspiring data scientist, analyst, or tech enthusiast, learning Python for data science is one of the smartest career moves you can make in 2025.
In this guide, you’ll learn:
Why Python is the preferred language for data science
The libraries and tools you must master
A beginner-friendly roadmap
How to get started with a free full course on YouTube
Why Python is the #1 Language for Data Science
Python has earned its reputation as the go-to language for data science and here's why:
1. Easy to Learn, Easy to Use
Python’s syntax is clean, simple, and intuitive. You can focus on solving problems rather than struggling with the language itself.
2. Rich Ecosystem of Libraries
Python offers thousands of specialized libraries for data analysis, machine learning, and visualization.
3. Community and Resources
With a vibrant global community, you’ll never run out of tutorials, forums, or project ideas to help you grow.
4. Integration with Tools & Platforms
From Jupyter notebooks to cloud platforms like AWS and Google Colab, Python works seamlessly everywhere.
What You Can Do with Python in Data Science
Let’s look at real tasks you can perform using Python: TaskPython ToolsData cleaning & manipulationPandas, NumPyData visualizationMatplotlib, Seaborn, PlotlyMachine learningScikit-learn, XGBoostDeep learningTensorFlow, PyTorchStatistical analysisStatsmodels, SciPyBig data integrationPySpark, Dask
Python lets you go from raw data to actionable insight — all within a single ecosystem.
A Beginner's Roadmap to Learn Python for Data Science
If you're starting from scratch, follow this step-by-step learning path:
✅ Step 1: Learn Python Basics
Variables, data types, loops, conditionals
Functions, file handling, error handling
✅ Step 2: Explore NumPy
Arrays, broadcasting, numerical computations
✅ Step 3: Master Pandas
DataFrames, filtering, grouping, merging datasets
✅ Step 4: Visualize with Matplotlib & Seaborn
Create charts, plots, and visual dashboards
✅ Step 5: Intro to Machine Learning
Use Scikit-learn for classification, regression, clustering
✅ Step 6: Work on Real Projects
Apply your knowledge to real-world datasets (Kaggle, UCI, etc.)
Who Should Learn Python for Data Science?
Python is incredibly beginner-friendly and widely used, making it ideal for:
Students looking to future-proof their careers
Working professionals planning a transition to data
Analysts who want to automate and scale insights
Researchers working with data-driven models
Developers diving into AI, ML, or automation
How Long Does It Take to Learn?
You can grasp Python fundamentals in 2–3 weeks with consistent daily practice. To become proficient in data science using Python, expect to spend 3–6 months, depending on your pace and project experience.
The good news? You don’t need to do it alone.
🎓 Learn Python for Data Science – Full Free Course on YouTube
We’ve put together a FREE, beginner-friendly YouTube course that covers everything you need to start your data science journey using Python.
📘 What You’ll Learn:
Python programming basics
NumPy and Pandas for data handling
Matplotlib for visualization
Scikit-learn for machine learning
Real-life datasets and projects
Step-by-step explanations
📺 Watch the full course now → 👉 Python for Data Science Full Course
You’ll walk away with job-ready skills and project experience — at zero cost.
🧭 Final Thoughts
Python isn’t just a programming language — it’s your gateway to the future.
By learning Python for data science, you unlock opportunities across industries, roles, and technologies. The demand is high, the tools are ready, and the learning path is clearer than ever.
Don’t let analysis paralysis hold you back.
Click here to start learning now → https://youtu.be/6rYVt_2q_BM
#PythonForDataScience #LearnPython #FreeCourse #DataScience2025 #MachineLearning #NumPy #Pandas #DataAnalysis #AI #ScikitLearn #UpskillNow
1 note
·
View note
Text
Python for Data Science: Libraries You Must Know
Python has become the go-to programming language for data science professionals due to its readability, extensive community support, and a rich ecosystem of libraries. Whether you're analyzing data, building machine learning models, or creating stunning visualizations, Python has the right tools to get the job done. If you're looking to start a career in this field, enrolling in the best Python training in Hyderabad can give you a competitive edge and help you master these crucial libraries.
1. NumPy – The Foundation of Numerical Computing
NumPy is the backbone of scientific computing with Python. It offers efficient storage and manipulation of large numerical arrays, which makes it indispensable for high-performance data analysis. NumPy arrays are faster and more compact than traditional Python lists and serve as the foundation for other data science libraries.
2. Pandas – Data Wrangling Made Simple
Pandas is essential for handling structured data. Data structures such as Series and DataFrame make it easy to clean, transform, and explore data. With Pandas, tasks like filtering rows, merging datasets, and grouping values become effortless, saving time and effort in data preprocessing.
3. Matplotlib and Seaborn – Data Visualization Powerhouses
Matplotlib is the standard library for creating basic to advanced data visualizations. From bar graphs to histograms and line charts, Matplotlib covers it all. For more visually appealing and statistically rich plots, Seaborn is an excellent choice. It simplifies the process of creating complex plots and provides a more aesthetically pleasing design.
4. Scikit-learn – Machine Learning Made Easy
In Python, Scikit-learn is one of the most widely used libraries for implementing machine learning algorithms. It provides easy-to-use functions for classification, regression, clustering, and model evaluation, making it ideal for both beginners and experts.
5. TensorFlow and PyTorch – Deep Learning Frameworks
For those diving into artificial intelligence and deep learning, TensorFlow and PyTorch are essential. These frameworks allow developers to create, train, and deploy neural networks for applications such as image recognition, speech processing, and natural language understanding.
Begin Your Data Science Journey with Expert Training
Mastering these libraries opens the door to countless opportunities in the data science field. To gain hands-on experience and real-world skills, enroll in SSSIT Computer Education, where our expert trainers provide industry-relevant, practical Python training tailored for aspiring data scientists in Hyderabad.
#best python training in hyderabad#best python training in kukatpally#best python training in KPHB#Kukatpally & KPHB
0 notes
Text
K-mean Analysis
Script:
from pandas import Series, DataFrame import pandas as pd import numpy as np import matplotlib.pylab as plt from sklearn.model_selection import train_test_split from sklearn import preprocessing from sklearn.cluster import KMeans import os """ Data Management """
data = pd.read_csv("tree_addhealth.csv")
upper-case all DataFrame column names
data.columns = map(str.upper, data.columns)
Data Management
data_clean = data.dropna()
subset clustering variables
cluster=data_clean[['ALCEVR1','MAREVER1','ALCPROBS1','DEVIANT1','VIOL1', 'DEP1','ESTEEM1','SCHCONN1','PARACTV', 'PARPRES','FAMCONCT']] cluster.describe()
standardize clustering variables to have mean=0 and sd=1
clustervar=cluster.copy() clustervar['ALCEVR1']=preprocessing.scale(clustervar['ALCEVR1'].astype('float64')) clustervar['ALCPROBS1']=preprocessing.scale(clustervar['ALCPROBS1'].astype('float64')) clustervar['MAREVER1']=preprocessing.scale(clustervar['MAREVER1'].astype('float64')) clustervar['DEP1']=preprocessing.scale(clustervar['DEP1'].astype('float64')) clustervar['ESTEEM1']=preprocessing.scale(clustervar['ESTEEM1'].astype('float64')) clustervar['VIOL1']=preprocessing.scale(clustervar['VIOL1'].astype('float64')) clustervar['DEVIANT1']=preprocessing.scale(clustervar['DEVIANT1'].astype('float64')) clustervar['FAMCONCT']=preprocessing.scale(clustervar['FAMCONCT'].astype('float64')) clustervar['SCHCONN1']=preprocessing.scale(clustervar['SCHCONN1'].astype('float64')) clustervar['PARACTV']=preprocessing.scale(clustervar['PARACTV'].astype('float64')) clustervar['PARPRES']=preprocessing.scale(clustervar['PARPRES'].astype('float64'))
split data into train and test sets
clus_train, clus_test = train_test_split(clustervar, test_size=.3, random_state=123)
k-means cluster analysis for 1-9 clusters
from scipy.spatial.distance import cdist clusters=range(1,9) meandist=[]
for k in clusters: model=KMeans(n_clusters=k) model.fit(clus_train) clusassign=model.predict(clus_train) meandist.append(sum(np.min(cdist(clus_train, model.cluster_centers_, 'euclidean'), axis=1)) / clus_train.shape[0])
""" Plot average distance from observations from the cluster centroid to use the Elbow Method to identify number of clusters to choose """
plt.plot(clusters, meandist) plt.xlabel('Number of clusters') plt.ylabel('Average distance') plt.title('Selecting k with the Elbow Method')
Interpret 3 cluster solution
model3=KMeans(n_clusters=2) model3.fit(clus_train) clusassign=model3.predict(clus_train)
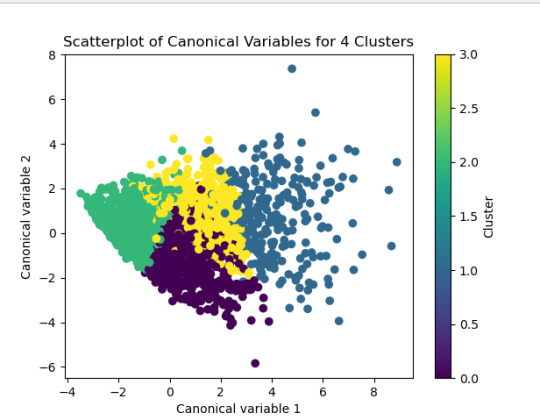
plot clusters
from sklearn.decomposition import PCA pca_2 = PCA(2) plot_columns = pca_2.fit_transform(clus_train) plt.scatter(x=plot_columns[:,0], y=plot_columns[:,1], c=model3.labels_) plt.xlabel('Canonical variable 1') plt.ylabel('Canonical variable 2') plt.title('Scatterplot of Canonical Variables for 4 Clusters')
Add the legend to the plot
import matplotlib.patches as mpatches patches = [mpatches.Patch(color=plt.cm.viridis(i/4), label=f'Cluster {i}') for i in range(4)]
plt.legend(handles=patches, title="Clusters") plt.show()
""" BEGIN multiple steps to merge cluster assignment with clustering variables to examine cluster variable means by cluster """
create a unique identifier variable from the index for the
cluster training data to merge with the cluster assignment variable
clus_train.reset_index(level=0, inplace=True)
create a list that has the new index variable
cluslist=list(clus_train['index'])
create a list of cluster assignments
labels=list(model3.labels_)
combine index variable list with cluster assignment list into a dictionary
newlist=dict(zip(cluslist, labels)) newlist
convert newlist dictionary to a dataframe
newclus=DataFrame.from_dict(newlist, orient='index') newclus
rename the cluster assignment column
newclus.columns = ['cluster']
now do the same for the cluster assignment variable
create a unique identifier variable from the index for the
cluster assignment dataframe
to merge with cluster training data
newclus.reset_index(level=0, inplace=True)
merge the cluster assignment dataframe with the cluster training variable dataframe
by the index variable
merged_train=pd.merge(clus_train, newclus, on='index') merged_train.head(n=100)
cluster frequencies
merged_train.cluster.value_counts()
""" END multiple steps to merge cluster assignment with clustering variables to examine cluster variable means by cluster """
FINALLY calculate clustering variable means by cluster
clustergrp = merged_train.groupby('cluster').mean() print ("Clustering variable means by cluster") print(clustergrp)
validate clusters in training data by examining cluster differences in GPA using ANOVA
first have to merge GPA with clustering variables and cluster assignment data
gpa_data=data_clean['GPA1']
split GPA data into train and test sets
gpa_train, gpa_test = train_test_split(gpa_data, test_size=.3, random_state=123) gpa_train1=pd.DataFrame(gpa_train) gpa_train1.reset_index(level=0, inplace=True) merged_train_all=pd.merge(gpa_train1, merged_train, on='index') sub1 = merged_train_all[['GPA1', 'cluster']].dropna()
import statsmodels.formula.api as smf import statsmodels.stats.multicomp as multi
gpamod = smf.ols(formula='GPA1 ~ C(cluster)', data=sub1).fit() print (gpamod.summary())
print ('means for GPA by cluster') m1= sub1.groupby('cluster').mean() print (m1)
print ('standard deviations for GPA by cluster') m2= sub1.groupby('cluster').std() print (m2)
mc1 = multi.MultiComparison(sub1['GPA1'], sub1['cluster']) res1 = mc1.tukeyhsd() print(res1.summary())
------------------------------------------------------------------------------
PLOTS:

------------------------------------------------------------------------------ANALYSING:
The K-mean cluster analysis is trying to identify subgroups of adolescents based on their similarity using the following 11 variables:
(Binary variables)
ALCEVR1 = ever used alcohol
MAREVER1 = ever used marijuana
(Quantitative variables)
ALCPROBS1 = Alcohol problem
DEVIANT1 = behaviors scale
VIOL1 = Violence scale
DEP1 = depression scale
ESTEEM1 = Self-esteem
SCHCONN1= School connectiveness
PARACTV = parent activities
PARPRES = parent presence
FAMCONCT = family connectiveness
The test was split with 70% for the training set and 30% for the test set. 9 clusters were conducted and the results are shown the plot 1. The plot suggest 2,4 , 5 and 6 solutions might be interpreted.
The second plot shows the canonical discriminant analyses of the 4 cluster solutions. Clusters 0 and 3 are very densely packed together with relatively low within-cluster variance whereas clusters 1 and 2 were spread out more than the other clusters, especially cluster 1 which means there is higher variance within the cluster. The number of clusters we would need to use is less the 3.


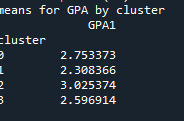
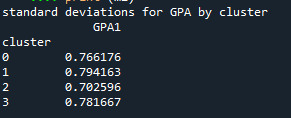

Students in cluster 2 had higher GPA values with an SD of 0.70 and cluster 1 had lower GPA values with an SD of 0.79
0 notes
Text

🚀 Crack Your Next Python Pandas Interview! 🐼💡 Are you preparing for a data science or Python developer interview? 📊 Get ahead with these essential Pandas interview questions covering: ✅ DataFrames & Series Basics ✅ Indexing & Slicing ✅ Data Cleaning & Manipulation ✅ GroupBy & Aggregations ✅ Merging & Joins ✅ Performance Optimization Master these concepts and boost your confidence! 💪 👉 https://bit.ly/41KQ1DR 💬 What’s the toughest Pandas question you’ve faced? Drop it in the comments! ⬇️
1 note
·
View note
Text
Data Merging Guide: Master Pandas DataFrame Combinations
Enhance your data analysis skills with our guide to data merging techniques. Learn how to effectively combine datasets using pandas, handle merge conflicts, and implement best practices for DataFrame operations in Python
Data merging techniques, pandas DataFrame combinations, and efficient data joining methods form the cornerstone of advanced data analysis. In this comprehensive guide, we’ll explore how to combine multiple datasets effectively using Python’s pandas library. Furthermore, we’ll demonstrate practical approaches to handle various merging scenarios. Understanding Data Merging Fundamentals First,…
0 notes
Text
Introduction to data manipulation using Pandas

Introduction to Data Manipulation Using Pandas Data manipulation is a crucial step in the data analysis process, enabling you to prepare, clean, and transform raw data into a structured format ready for analysis.
Pandas, a popular Python library, simplifies these tasks with its intuitive and powerful tools for handling data efficiently.
At its core, Pandas introduces two primary data structures:
Series and DataFrame.
A Series represents a one-dimensional labeled array, ideal for handling a single column of data.
A DataFrame, on the other hand, is a two-dimensional labeled data structure resembling a table, making it perfect for working with tabular datasets.
These structures allow seamless operations like filtering rows, adding columns, reshaping data, and more.
Pandas excels in data cleaning, aggregation, and transformation.
Whether you’re dealing with missing values, merging datasets, or performing group-based computations, Pandas offers a comprehensive suite of methods to streamline your workflow.
Additionally, its compatibility with other libraries like NumPy and Matplotlib makes it a cornerstone of the Python data science ecosystem. In this blog, we’ll explore the essential concepts of data manipulation using Pandas, providing practical examples and insights to help you handle data effectively.
Whether you’re a beginner or looking to refine your skills, this guide will set the foundation for your data manipulation journey.
WEBSITE: https://www.ficusoft.in/python-training-in-chennai/
0 notes
Text
Mastering Data Science Using Python
Data Science is not just a buzzword; it's the backbone of modern decision-making and innovation. If you're looking to step into this exciting field, Data Science using Python is a fantastic place to start. Python, with its simplicity and vast libraries, has become the go-to programming language for aspiring data scientists. Let’s explore everything you need to know to get started with Data Science using Python and take your skills to the next level.
What is Data Science?
In simple terms, Data Science is all about extracting meaningful insights from data. These insights help businesses make smarter decisions, predict trends, and even shape new innovations. Data Science involves various stages, including:
Data Collection
Data Cleaning
Data Analysis
Data Visualization
Machine Learning
Why Choose Python for Data Science?
Python is the heart of Data Science for several compelling reasons:
Ease of Learning: Python’s syntax is intuitive and beginner-friendly, making it ideal for those new to programming.
Versatile Libraries: Libraries like Pandas, NumPy, Matplotlib, and Scikit-learn make Python a powerhouse for data manipulation, analysis, and machine learning.
Community Support: With a vast and active community, you’ll always find solutions to challenges you face.
Integration: Python integrates seamlessly with other technologies, enabling smooth workflows.
Getting Started with Data Science Using Python
1. Set Up Your Python Environment
To begin, install Python on your system. Use tools like Anaconda, which comes preloaded with essential libraries for Data Science.
Once installed, launch Jupyter Notebook, an interactive environment for coding and visualizing data.
2. Learn the Basics of Python
Before diving into Data Science, get comfortable with Python basics:
Variables and Data Types
Control Structures (loops and conditionals)
Functions and Modules
File Handling
You can explore free resources or take a Python for Beginners course to grasp these fundamentals.
3. Libraries Essential for Data Science
Python’s true power lies in its libraries. Here are the must-know ones:
a) NumPy
NumPy is your go-to for numerical computations. It handles large datasets and supports multi-dimensional arrays.
Common Use Cases: Mathematical operations, linear algebra, random sampling.
Keywords to Highlight: NumPy for Data Science, NumPy Arrays, Data Manipulation in Python.
b) Pandas
Pandas simplifies working with structured data like tables. It’s perfect for data manipulation and analysis.
Key Features: DataFrames, filtering, and merging datasets.
Top Keywords: Pandas for Beginners, DataFrame Operations, Pandas Tutorial.
c) Matplotlib and Seaborn
For data visualization, Matplotlib and Seaborn are unbeatable.
Matplotlib: For creating static, animated, or interactive visualizations.
Seaborn: For aesthetically pleasing statistical plots.
Keywords to Use: Data Visualization with Python, Seaborn vs. Matplotlib, Python Graphs.
d) Scikit-learn
Scikit-learn is the go-to library for machine learning, offering tools for classification, regression, and clustering.
Steps to Implement Data Science Projects
Step 1: Data Collection
You can collect data from sources like web APIs, web scraping, or public datasets available on platforms like Kaggle.
Step 2: Data Cleaning
Raw data is often messy. Use Python to clean and preprocess it.
Remove duplicates and missing values using Pandas.
Normalize or scale data for analysis.
Step 3: Exploratory Data Analysis (EDA)
EDA involves understanding the dataset and finding patterns.
Use Pandas for descriptive statistics.
Visualize data using Matplotlib or Seaborn.
Step 4: Build Machine Learning Models
With Scikit-learn, you can train machine learning models to make predictions. Start with simple algorithms like:
Linear Regression
Logistic Regression
Decision Trees
Step 5: Data Visualization
Communicating results is critical in Data Science. Create impactful visuals that tell a story.
Use Case: Visualizing sales trends over time.
Best Practices for Data Science Using Python
1. Document Your Code
Always write comments and document your work to ensure your code is understandable.
2. Practice Regularly
Consistent practice on platforms like Kaggle or HackerRank helps sharpen your skills.
3. Stay Updated
Follow Python communities and blogs to stay updated on the latest tools and trends.
Top Resources to Learn Data Science Using Python
1. Online Courses
Platforms like Udemy, Coursera, and edX offer excellent Data Science courses.
Recommended Course: "Data Science with Python - Beginner to Pro" on Udemy.
2. Books
Books like "Python for Data Analysis" by Wes McKinney are excellent resources.
Keywords: Best Books for Data Science, Python Analysis Books, Data Science Guides.
3. Practice Platforms
Kaggle for hands-on projects.
HackerRank for Python coding challenges.
Career Opportunities in Data Science
Data Science offers lucrative career options, including roles like:
Data Analyst
Machine Learning Engineer
Business Intelligence Analyst
Data Scientist
How to Stand Out in Data Science
1. Build a Portfolio
Showcase projects on platforms like GitHub to demonstrate your skills.
2. Earn Certifications
Certifications like Google Data Analytics Professional Certificate or IBM Data Science Professional Certificate add credibility to your resume.
Conclusion
Learning Data Science using Python can open doors to exciting opportunities and career growth. Python's simplicity and powerful libraries make it an ideal choice for beginners and professionals alike. With consistent effort and the right resources, you can master this skill and stand out in the competitive field of Data Science.
0 notes
Text
What are key Python tools for data analytics and their uses?
Python has become a go-to language for data analytics due to its simplicity and the powerful libraries it offers. Here are some key Python tools used in data analytics:
Pandas: This library is essential for data manipulation and analysis. It provides data structures like DataFrames that allow for efficient handling of large datasets, enabling users to perform operations like filtering, grouping, and merging data easily.
NumPy: Known for its numerical computing capabilities, NumPy offers support for large, multi-dimensional arrays and matrices. It includes mathematical functions that facilitate complex calculations and data analysis.
Matplotlib: This plotting library is used for data visualization. It helps create static, interactive, and animated visualizations in Python, making it easier to understand data patterns and insights.
Seaborn: Built on Matplotlib, Seaborn simplifies the process of creating attractive and informative statistical graphics. It integrates with Pandas, allowing users to visualize data directly from DataFrames.
SciPy: This library builds on NumPy and provides additional functionality for scientific and technical computing, including optimization, integration, and statistical analysis.
For anyone looking to deepen their knowledge in these tools, pursuing an online data analytics certificate can be highly beneficial.
0 notes
Text
0 notes
Text

🚀 Crack Your Next Python Pandas Interview! 🐼💡 Are you preparing for a data science or Python developer interview? 📊 Get ahead with these essential Pandas interview questions covering: ✅ DataFrames & Series Basics ✅ Indexing & Slicing ✅ Data Cleaning & Manipulation ✅ GroupBy & Aggregations ✅ Merging & Joins ✅ Performance Optimization Master these concepts and boost your confidence! 💪 👉 https://bit.ly/41KQ1DR 💬 What’s the toughest Pandas question you’ve faced? Drop it in the comments! ⬇️
1 note
·
View note
Text
Want to seamlessly combine your data? Learn the top 3 ways to merge Pandas DataFrames. Whether it's concatenation, merging on columns, or joining on index labels, these techniques will streamline your data analysis. https://bit.ly/3Y1GWG0
0 notes
Text
A Beginner’s Guide to Pandas: Data Manipulation Made Easy
A Beginner’s Guide to Pandas:
Data Manipulation Made Easy Pandas is one of the most powerful and widely used Python libraries for data manipulation and analysis.
It simplifies working with structured data, making it an essential tool for anyone in data science, machine learning, or data analysis.
What is Pandas?
Pandas is an open-source library that provides data structures and data analysis tools for Python. The core data structures in Pandas are:
Series: A one-dimensional array-like object that can hold any data type.
DataFrame:
A two-dimensional, size-mutable, and potentially heterogeneous tabular data structure with labeled axes (rows and columns).
Key Features of Pandas:
Data Cleaning:
Pandas makes it easy to clean and preprocess data, such as handling missing values, filtering, and transforming data.
Data Exploration:
With simple commands, you can explore datasets by calculating statistics, summarizing data, and visualizing distributions.
Data Manipulation:
Pandas excels in reshaping, merging, and joining datasets, allowing for complex transformations with minimal code.
Commonly Used Pandas Functions:
read_csv(): Loads data from a CSV file into a DataFrame.
dropna(): Removes missing values from the dataset.
groupby(): Groups data by a specific column and performs aggregate functions.
merge(): Combines two DataFrames based on common columns or indices.
Why Learn Pandas?
Efficiency:
Pandas is highly optimized for performance and handles large datasets with ease.
Versatility:
It integrates well with other libraries like NumPy, Matplotlib, and Scikit-learn, providing a seamless workflow for data analysis and machine learning projects.
Ease of Use:
The syntax is intuitive, and the library is well-documented, making it easy for beginners to get started.
conclusion
mastering Pandas opens the door to efficient data manipulation and analysis, making it an essential tool for anyone working with data in Python.
Whether you are cleaning data, analyzing trends, or preparing datasets for machine learning, Pandas will simplify the process.
0 notes
Text
Python for Data Analytics: Harnessing the Power of Pandas, Numpy, and Scipy
In today's data-driven world, the ability to effectively analyze and interpret data is invaluable. Python, a versatile and powerful programming language, has become the go-to tool for data analytics, particularly through its libraries: Pandas, Numpy, and Scipy. These libraries provide a robust foundation for data analysis, offering diverse functionalities that cater to various analytical needs. This article delves into how these libraries contribute to effective data analytics and how one can leverage them to gain insights from data.
Understanding Pandas: The Data Manipulation Powerhouse
Pandas is an essential library in Python that simplifies the process of data manipulation and analysis. It provides data structures such as Series and DataFrame that are both flexible and efficient for handling large datasets. With Pandas, users can easily perform operations like merging datasets, reshaping data, and aggregating information, which are critical for any data analysis task.
For those considering a Data Analytics online course or looking for an offline data analytics certification course, mastering Pandas is a crucial step. This library enables users to preprocess data, clean it, and transform it into a format suitable for analysis. The ability to handle missing data, filter datasets, and apply functions across dataframes makes Pandas a fundamental tool for anyone pursuing a data analyst certification course.
The Role of Numpy in Numerical Computations
Numpy is another cornerstone of Python's data analytics ecosystem. It provides support for large, multi-dimensional arrays and matrices, along with a collection of mathematical functions to operate on these arrays. Numpy’s array object is more efficient for numerical computations compared to Python's built-in lists, making it indispensable for performing complex mathematical operations and analyses.
In the context of a data analytics online training program or data analyst offline training, understanding Numpy is critical. This library’s array operations are integral for tasks such as linear algebra, statistical analysis, and Fourier transformations. Numpy’s performance and efficiency in handling numerical data underscore its importance in the best data analytics courses and certification programs.
Scipy: Expanding Analytical Capabilities
Scipy builds upon Numpy, offering a broader range of functionalities for scientific and technical computing. It provides modules for optimization, integration, interpolation, eigenvalue problems, and other advanced mathematical operations. Scipy’s integration with Numpy ensures that it is well-suited for complex data analysis and scientific research.
For individuals pursuing a data analytics course or those engaged in data analyst certification, mastering Scipy can significantly enhance their analytical capabilities. The library’s extensive functions are vital for tasks requiring advanced statistical analysis, signal processing, and other scientific computations. Engaging in a top data analytics institute or program often includes an in-depth exploration of Scipy’s offerings to equip learners with a comprehensive set of tools for data analysis.
Practical Applications of Pandas, Numpy, and Scipy
In practice, combining Pandas, Numpy, and Scipy can greatly enhance the analytical process. Pandas can be used for data cleaning and manipulation, while Numpy handles numerical data and operations, and Scipy provides additional scientific computations. This synergy allows analysts to perform complex analyses, from basic statistical operations to advanced modeling and simulations.
When enrolling in a data analytics online course or offline data analytics certification course, students often experience hands-on training with these libraries. A well-rounded data analyst training program will include practical exercises that illustrate how to apply Pandas, Numpy, and Scipy to real-world data problems. Such training ensures that learners can effectively use these tools to extract insights and make data-driven decisions.
The Importance of Choosing the Right Training Program
Whether opting for data analytics online training or a traditional offline course, the quality of the training program significantly impacts one’s ability to utilize Pandas, Numpy, and Scipy effectively. The best data analytics courses are those that offer comprehensive instruction, practical examples, and real-world applications of these libraries.
A top data analyst training program will not only cover the theoretical aspects of Pandas, Numpy, and Scipy but also provide opportunities for hands-on practice. This practical experience is crucial for mastering the libraries and applying them in various analytical scenarios.
Python's libraries, Pandas, Numpy, and Scipy, are indispensable tools for anyone involved in data analytics. Their capabilities extend from basic data manipulation to complex scientific computations, making them essential for effective data analysis. Whether pursuing a data analytics certification, engaging in data analytics online training, or undertaking offline data analytics certification courses, gaining proficiency in these libraries is key to becoming a successful data analyst.
A well-structured data analytics course or training program will equip learners with the skills needed to harness the full potential of Pandas, Numpy, and Scipy. By integrating these tools into their analytical toolkit, data professionals can enhance their ability to uncover insights and drive informed decision-making.
0 notes
Text
What is Pandas in Data analysis
Pandas in data analysis is a popular Python library specifically designed for data manipulation and analysis. It provides high-performance, easy-to-use data structures and tools, making it essential for handling structured data in pandas data analysis. Pandas is built on top of NumPy, offering a more flexible and powerful framework for working with datasets.
Pandas revolves around two primary structures, Series (a single line of data) and DataFrame (a grid of data). Imagine a DataFrame as a table or a spreadsheet. It offers a place to hold and tweak table-like data, with rows acting as individual entries and columns standing for characteristics.
The Pandas library simplifies the process of reading, cleaning, and modifying data from different formats like CSV, Excel, JSON, and SQL databases. It provides numerous built-in functions for handling missing data, merging datasets, and reshaping data, which are essential tasks in data preprocessing.
Additionally, Pandas supports filtering, selecting, and sorting data efficiently, helping analysts perform complex operations with just a few lines of code. Its ability to group, aggregate, and summarize data makes it easy to calculate key statistics or extract meaningful insights.
Pandas also integrates with data visualization libraries like Matplotlib, making it a comprehensive tool for data analysis, data wrangling, and visualization, used by data scientists, analysts, and engineers.
0 notes