#filtering data in pandas
Explore tagged Tumblr posts
Visit Tumblr Blog
Explore Tumblr blogs with no restrictions, modern design and the best experience.
Last Seen Tumblr Blogs


Fun Fact
Tumblr has a low social media market share in South America.
Text
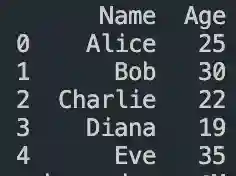
DataFrame in Pandas: Guide to Creating Awesome DataFrames
Explore how to create a dataframe in Pandas, including data input methods, customization options, and practical examples.
Data analysis used to be a daunting task, reserved for statisticians and mathematicians. But with the rise of powerful tools like Python and its fantastic library, Pandas, anyone can become a data whiz! Pandas, in particular, shines with its DataFrames, these nifty tables that organize and manipulate data like magic. But where do you start? Fear not, fellow data enthusiast, for this guide will…
View On WordPress
#advanced dataframe features#aggregating data in pandas#create dataframe from dictionary in pandas#create dataframe from list in pandas#create dataframe in pandas#data manipulation in pandas#dataframe indexing#filter dataframe by condition#filter dataframe by multiple conditions#filtering data in pandas#grouping data in pandas#how to make a dataframe in pandas#manipulating data in pandas#merging dataframes#pandas data structures#pandas dataframe tutorial#python dataframe basics#rename columns in pandas dataframe#replace values in pandas dataframe#select columns in pandas dataframe#select rows in pandas dataframe#set column names in pandas dataframe#set row names in pandas dataframe
0 notes
Note
ik im probably so late to the daves pc thing but i made logs. woe stuff be upon ye. wish i could put something under a cut here cause its massive spoilers to original d&b lore but whatever


BOO PRETEND THERE IS A CUT HERE. UM. DO NOT LOOK AT IMAGES BELOW IF YOU HAVENT DEEP DIVED INTO D&B LORE YET !!!!


LOL okay Im a nerd so I can explain this one, these do actually mean something
TF-IDF is an acronym for term frequency-inverse document frequency, it's a specific formula within information retrieval that essentially evaluates the "aboutness" of a document relative to other documents in a provided group by ranking how often a word is used in one doc versus the group.
basically what that means: say you have three documents, and only one of them contains the word "fire". that word would be ranked as being very descriptive of that one document. whereas if "and" shows up in all three, it would be ranked as not very descriptive, since they all share it in common. this essentially filters out stopwords (articles, conjunctions and other common words that don't have semantic meaning on their own, like "and", "he", "but", "is", "there") from most kinds of text, with some exceptions.
pandas, on the other hand, is a type of Python module that allows you to analyze and represent data in various ways, such as for TF-IDF!
it's funny you bring up Ren'py because I've actually used that before and it's how I got my start into programming by making little games for myself
#devius ex machina#ask#this is stuff i learned about in college studying information science as my major so i didnt expect anyone to casually know what tf idf is#but ur the first person to ask about it#also that madden log is so cool genuinely#i love seeing people use the machina terminal to make their own stuff
13 notes
·
View notes
Text
Python Libraries to Learn Before Tackling Data Analysis
To tackle data analysis effectively in Python, it's crucial to become familiar with several libraries that streamline the process of data manipulation, exploration, and visualization. Here's a breakdown of the essential libraries:
1. NumPy
- Purpose: Numerical computing.
- Why Learn It: NumPy provides support for large multi-dimensional arrays and matrices, along with a collection of mathematical functions to operate on these arrays efficiently.
- Key Features:
- Fast array processing.
- Mathematical operations on arrays (e.g., sum, mean, standard deviation).
- Linear algebra operations.
2. Pandas
- Purpose: Data manipulation and analysis.
- Why Learn It: Pandas offers data structures like DataFrames, making it easier to handle and analyze structured data.
- Key Features:
- Reading/writing data from CSV, Excel, SQL databases, and more.
- Handling missing data.
- Powerful group-by operations.
- Data filtering and transformation.
3. Matplotlib
- Purpose: Data visualization.
- Why Learn It: Matplotlib is one of the most widely used plotting libraries in Python, allowing for a wide range of static, animated, and interactive plots.
- Key Features:
- Line plots, bar charts, histograms, scatter plots.
- Customizable charts (labels, colors, legends).
- Integration with Pandas for quick plotting.
4. Seaborn
- Purpose: Statistical data visualization.
- Why Learn It: Built on top of Matplotlib, Seaborn simplifies the creation of attractive and informative statistical graphics.
- Key Features:
- High-level interface for drawing attractive statistical graphics.
- Easier to use for complex visualizations like heatmaps, pair plots, etc.
- Visualizations based on categorical data.
5. SciPy
- Purpose: Scientific and technical computing.
- Why Learn It: SciPy builds on NumPy and provides additional functionality for complex mathematical operations and scientific computing.
- Key Features:
- Optimized algorithms for numerical integration, optimization, and more.
- Statistics, signal processing, and linear algebra modules.
6. Scikit-learn
- Purpose: Machine learning and statistical modeling.
- Why Learn It: Scikit-learn provides simple and efficient tools for data mining, analysis, and machine learning.
- Key Features:
- Classification, regression, and clustering algorithms.
- Dimensionality reduction, model selection, and preprocessing utilities.
7. Statsmodels
- Purpose: Statistical analysis.
- Why Learn It: Statsmodels allows users to explore data, estimate statistical models, and perform tests.
- Key Features:
- Linear regression, logistic regression, time series analysis.
- Statistical tests and models for descriptive statistics.
8. Plotly
- Purpose: Interactive data visualization.
- Why Learn It: Plotly allows for the creation of interactive and web-based visualizations, making it ideal for dashboards and presentations.
- Key Features:
- Interactive plots like scatter, line, bar, and 3D plots.
- Easy integration with web frameworks.
- Dashboards and web applications with Dash.
9. TensorFlow/PyTorch (Optional)
- Purpose: Machine learning and deep learning.
- Why Learn It: If your data analysis involves machine learning, these libraries will help in building, training, and deploying deep learning models.
- Key Features:
- Tensor processing and automatic differentiation.
- Building neural networks.
10. Dask (Optional)
- Purpose: Parallel computing for data analysis.
- Why Learn It: Dask enables scalable data manipulation by parallelizing Pandas operations, making it ideal for big datasets.
- Key Features:
- Works with NumPy, Pandas, and Scikit-learn.
- Handles large data and parallel computations easily.
Focusing on NumPy, Pandas, Matplotlib, and Seaborn will set a strong foundation for basic data analysis.
6 notes
·
View notes
Text
Understanding Outliers in Machine Learning and Data Science

In machine learning and data science, an outlier is like a misfit in a dataset. It's a data point that stands out significantly from the rest of the data. Sometimes, these outliers are errors, while other times, they reveal something truly interesting about the data. Either way, handling outliers is a crucial step in the data preprocessing stage. If left unchecked, they can skew your analysis and even mess up your machine learning models.
In this article, we will dive into:
1. What outliers are and why they matter.
2. How to detect and remove outliers using the Interquartile Range (IQR) method.
3. Using the Z-score method for outlier detection and removal.
4. How the Percentile Method and Winsorization techniques can help handle outliers.
This guide will explain each method in simple terms with Python code examples so that even beginners can follow along.
1. What Are Outliers?
An outlier is a data point that lies far outside the range of most other values in your dataset. For example, in a list of incomes, most people might earn between $30,000 and $70,000, but someone earning $5,000,000 would be an outlier.
Why Are Outliers Important?
Outliers can be problematic or insightful:
Problematic Outliers: Errors in data entry, sensor faults, or sampling issues.
Insightful Outliers: They might indicate fraud, unusual trends, or new patterns.
Types of Outliers
1. Univariate Outliers: These are extreme values in a single variable.
Example: A temperature of 300°F in a dataset about room temperatures.
2. Multivariate Outliers: These involve unusual combinations of values in multiple variables.
Example: A person with an unusually high income but a very low age.
3. Contextual Outliers: These depend on the context.
Example: A high temperature in winter might be an outlier, but not in summer.
2. Outlier Detection and Removal Using the IQR Method
The Interquartile Range (IQR) method is one of the simplest ways to detect outliers. It works by identifying the middle 50% of your data and marking anything that falls far outside this range as an outlier.
Steps:
1. Calculate the 25th percentile (Q1) and 75th percentile (Q3) of your data.
2. Compute the IQR:
{IQR} = Q3 - Q1
Q1 - 1.5 \times \text{IQR}
Q3 + 1.5 \times \text{IQR} ] 4. Anything below the lower bound or above the upper bound is an outlier.
Python Example:
import pandas as pd
# Sample dataset
data = {'Values': [12, 14, 18, 22, 25, 28, 32, 95, 100]}
df = pd.DataFrame(data)
# Calculate Q1, Q3, and IQR
Q1 = df['Values'].quantile(0.25)
Q3 = df['Values'].quantile(0.75)
IQR = Q3 - Q1
# Define the bounds
lower_bound = Q1 - 1.5 * IQR
upper_bound = Q3 + 1.5 * IQR
# Identify and remove outliers
outliers = df[(df['Values'] < lower_bound) | (df['Values'] > upper_bound)]
print("Outliers:\n", outliers)
filtered_data = df[(df['Values'] >= lower_bound) & (df['Values'] <= upper_bound)]
print("Filtered Data:\n", filtered_data)
Key Points:
The IQR method is great for univariate datasets.
It works well when the data isn’t skewed or heavily distributed.
3. Outlier Detection and Removal Using the Z-Score Method
The Z-score method measures how far a data point is from the mean, in terms of standard deviations. If a Z-score is greater than a certain threshold (commonly 3 or -3), it is considered an outlier.
Formula:
Z = \frac{(X - \mu)}{\sigma}
is the data point,
is the mean of the dataset,
is the standard deviation.
Python Example:
import numpy as np
# Sample dataset
data = {'Values': [12, 14, 18, 22, 25, 28, 32, 95, 100]}
df = pd.DataFrame(data)
# Calculate mean and standard deviation
mean = df['Values'].mean()
std_dev = df['Values'].std()
# Compute Z-scores
df['Z-Score'] = (df['Values'] - mean) / std_dev
# Identify and remove outliers
threshold = 3
outliers = df[(df['Z-Score'] > threshold) | (df['Z-Score'] < -threshold)]
print("Outliers:\n", outliers)
filtered_data = df[(df['Z-Score'] <= threshold) & (df['Z-Score'] >= -threshold)]
print("Filtered Data:\n", filtered_data)
Key Points:
The Z-score method assumes the data follows a normal distribution.
It may not work well with skewed datasets.
4. Outlier Detection Using the Percentile Method and Winsorization
Percentile Method:
In the percentile method, we define a lower percentile (e.g., 1st percentile) and an upper percentile (e.g., 99th percentile). Any value outside this range is treated as an outlier.
Winsorization:
Winsorization is a technique where outliers are not removed but replaced with the nearest acceptable value.
Python Example:
from scipy.stats.mstats import winsorize
import numpy as np
Sample data
data = [12, 14, 18, 22, 25, 28, 32, 95, 100]
Calculate percentiles
lower_percentile = np.percentile(data, 1)
upper_percentile = np.percentile(data, 99)
Identify outliers
outliers = [x for x in data if x < lower_percentile or x > upper_percentile]
print("Outliers:", outliers)
# Apply Winsorization
winsorized_data = winsorize(data, limits=[0.01, 0.01])
print("Winsorized Data:", list(winsorized_data))
Key Points:
Percentile and Winsorization methods are useful for skewed data.
Winsorization is preferred when data integrity must be preserved.
Final Thoughts
Outliers can be tricky, but understanding how to detect and handle them is a key skill in machine learning and data science. Whether you use the IQR method, Z-score, or Wins
orization, always tailor your approach to the specific dataset you’re working with.
By mastering these techniques, you’ll be able to clean your data effectively and improve the accuracy of your models.
#science#skills#programming#bigdata#books#machinelearning#artificial intelligence#python#machine learning#data centers#outliers#big data#data analysis#data analytics#data scientist#database#datascience#data
3 notes
·
View notes
Text
Unlocking the Power of Data: Essential Skills to Become a Data Scientist

In today's data-driven world, the demand for skilled data scientists is skyrocketing. These professionals are the key to transforming raw information into actionable insights, driving innovation and shaping business strategies. But what exactly does it take to become a data scientist? It's a multidisciplinary field, requiring a unique blend of technical prowess and analytical thinking. Let's break down the essential skills you'll need to embark on this exciting career path.
1. Strong Mathematical and Statistical Foundation:
At the heart of data science lies a deep understanding of mathematics and statistics. You'll need to grasp concepts like:
Linear Algebra and Calculus: Essential for understanding machine learning algorithms and optimizing models.
Probability and Statistics: Crucial for data analysis, hypothesis testing, and drawing meaningful conclusions from data.
2. Programming Proficiency (Python and/or R):
Data scientists are fluent in at least one, if not both, of the dominant programming languages in the field:
Python: Known for its readability and extensive libraries like Pandas, NumPy, Scikit-learn, and TensorFlow, making it ideal for data manipulation, analysis, and machine learning.
R: Specifically designed for statistical computing and graphics, R offers a rich ecosystem of packages for statistical modeling and visualization.
3. Data Wrangling and Preprocessing Skills:
Raw data is rarely clean and ready for analysis. A significant portion of a data scientist's time is spent on:
Data Cleaning: Handling missing values, outliers, and inconsistencies.
Data Transformation: Reshaping, merging, and aggregating data.
Feature Engineering: Creating new features from existing data to improve model performance.
4. Expertise in Databases and SQL:
Data often resides in databases. Proficiency in SQL (Structured Query Language) is essential for:
Extracting Data: Querying and retrieving data from various database systems.
Data Manipulation: Filtering, joining, and aggregating data within databases.
5. Machine Learning Mastery:
Machine learning is a core component of data science, enabling you to build models that learn from data and make predictions or classifications. Key areas include:
Supervised Learning: Regression, classification algorithms.
Unsupervised Learning: Clustering, dimensionality reduction.
Model Selection and Evaluation: Choosing the right algorithms and assessing their performance.
6. Data Visualization and Communication Skills:
Being able to effectively communicate your findings is just as important as the analysis itself. You'll need to:
Visualize Data: Create compelling charts and graphs to explore patterns and insights using libraries like Matplotlib, Seaborn (Python), or ggplot2 (R).
Tell Data Stories: Present your findings in a clear and concise manner that resonates with both technical and non-technical audiences.
7. Critical Thinking and Problem-Solving Abilities:
Data scientists are essentially problem solvers. You need to be able to:
Define Business Problems: Translate business challenges into data science questions.
Develop Analytical Frameworks: Structure your approach to solve complex problems.
Interpret Results: Draw meaningful conclusions and translate them into actionable recommendations.
8. Domain Knowledge (Optional but Highly Beneficial):
Having expertise in the specific industry or domain you're working in can give you a significant advantage. It helps you understand the context of the data and formulate more relevant questions.
9. Curiosity and a Growth Mindset:
The field of data science is constantly evolving. A genuine curiosity and a willingness to learn new technologies and techniques are crucial for long-term success.
10. Strong Communication and Collaboration Skills:
Data scientists often work in teams and need to collaborate effectively with engineers, business stakeholders, and other experts.
Kickstart Your Data Science Journey with Xaltius Academy's Data Science and AI Program:
Acquiring these skills can seem like a daunting task, but structured learning programs can provide a clear and effective path. Xaltius Academy's Data Science and AI Program is designed to equip you with the essential knowledge and practical experience to become a successful data scientist.
Key benefits of the program:
Comprehensive Curriculum: Covers all the core skills mentioned above, from foundational mathematics to advanced machine learning techniques.
Hands-on Projects: Provides practical experience working with real-world datasets and building a strong portfolio.
Expert Instructors: Learn from industry professionals with years of experience in data science and AI.
Career Support: Offers guidance and resources to help you launch your data science career.
Becoming a data scientist is a rewarding journey that blends technical expertise with analytical thinking. By focusing on developing these key skills and leveraging resources like Xaltius Academy's program, you can position yourself for a successful and impactful career in this in-demand field. The power of data is waiting to be unlocked – are you ready to take the challenge?
2 notes
·
View notes
Text
AvatoAI Review: Unleashing the Power of AI in One Dashboard

Here's what Avato Ai can do for you
Data Analysis:
Analyze CV, Excel, or JSON files using Python and libraries like pandas or matplotlib.
Clean data, calculate statistical information and visualize data through charts or plots.
Document Processing:
Extract and manipulate text from text files or PDFs.
Perform tasks such as searching for specific strings, replacing content, and converting text to different formats.
Image Processing:
Upload image files for manipulation using libraries like OpenCV.
Perform operations like converting images to grayscale, resizing, and detecting shapes or
Machine Learning:
Utilize Python's machine learning libraries for predictions, clustering, natural language processing, and image recognition by uploading
Versatile & Broad Use Cases:
An incredibly diverse range of applications. From creating inspirational art to modeling scientific scenarios, to designing novel game elements, and more.
User-Friendly API Interface:
Access and control the power of this advanced Al technology through a user-friendly API.
Even if you're not a machine learning expert, using the API is easy and quick.
Customizable Outputs:
Lets you create custom visual content by inputting a simple text prompt.
The Al will generate an image based on your provided description, enhancing the creativity and efficiency of your work.
Stable Diffusion API:
Enrich Your Image Generation to Unprecedented Heights.
Stable diffusion API provides a fine balance of quality and speed for the diffusion process, ensuring faster and more reliable results.
Multi-Lingual Support:
Generate captivating visuals based on prompts in multiple languages.
Set the panorama parameter to 'yes' and watch as our API stitches together images to create breathtaking wide-angle views.
Variation for Creative Freedom:
Embrace creative diversity with the Variation parameter. Introduce controlled randomness to your generated images, allowing for a spectrum of unique outputs.
Efficient Image Analysis:
Save time and resources with automated image analysis. The feature allows the Al to sift through bulk volumes of images and sort out vital details or tags that are valuable to your context.
Advance Recognition:
The Vision API integration recognizes prominent elements in images - objects, faces, text, and even emotions or actions.
Interactive "Image within Chat' Feature:
Say goodbye to going back and forth between screens and focus only on productive tasks.
Here's what you can do with it:
Visualize Data:
Create colorful, informative, and accessible graphs and charts from your data right within the chat.
Interpret complex data with visual aids, making data analysis a breeze!
Manipulate Images:
Want to demonstrate the raw power of image manipulation? Upload an image, and watch as our Al performs transformations, like resizing, filtering, rotating, and much more, live in the chat.
Generate Visual Content:
Creating and viewing visual content has never been easier. Generate images, simple or complex, right within your conversation
Preview Data Transformation:
If you're working with image data, you can demonstrate live how certain transformations or operations will change your images.
This can be particularly useful for fields like data augmentation in machine learning or image editing in digital graphics.
Effortless Communication:
Say goodbye to static text as our innovative technology crafts natural-sounding voices. Choose from a variety of male and female voice types to tailor the auditory experience, adding a dynamic layer to your content and making communication more effortless and enjoyable.
Enhanced Accessibility:
Break barriers and reach a wider audience. Our Text-to-Speech feature enhances accessibility by converting written content into audio, ensuring inclusivity and understanding for all users.
Customization Options:
Tailor the audio output to suit your brand or project needs.
From tone and pitch to language preferences, our Text-to-Speech feature offers customizable options for the truest personalized experience.
>>>Get More Info<<<
#digital marketing#Avato AI Review#Avato AI#AvatoAI#ChatGPT#Bing AI#AI Video Creation#Make Money Online#Affiliate Marketing
3 notes
·
View notes
Text

Summer Training for Engineering Students Program: Unlock Your Potential with Li-Mat Soft Solutions
What real-world machine learning projects can I showcase for internship applications?
To impress internship recruiters, showcase projects that demonstrate your understanding of real-world applications. Some good examples include:
Predictive Analytics: Build a model to predict sales, stock prices, or customer churn.
Image Recognition: Work on a project that uses deep learning for facial recognition or object detection.
Recommendation Systems: Create a movie, music, or product recommendation system using collaborative filtering.
Natural Language Processing (NLP): Build a chatbot or sentiment analysis tool.
These projects will showcase your ability to handle data, train models, and apply machine learning concepts.
How can a beginner prepare for a machine learning internship in just 1-2 months?
As a beginner, here’s a focused approach to prepare in 1-2 months:
Learn Python: It’s the foundation of machine learning, so mastering Python basics and libraries like Pandas, NumPy, and Matplotlib is essential.
Understand Core Concepts: Study key machine learning algorithms like Linear Regression, Logistic Regression, and Decision Trees.
Hands-On Practice: Implement small projects such as data analysis or simple predictive models using open datasets (Kaggle is a great resource).
Learn Libraries: Dive into Scikit-learn for building models and TensorFlow or Keras for deep learning.
By the end of the 1-2 months, you’ll have a solid foundation and a few practical projects to showcase.
Looking for the best Summer Training for Engineering Students program? Li-Mat Soft Solutions is the perfect provider! They offer industry-recognized training programs that blend theory with practical experience, ensuring you’re job-ready.
At Li-Mat Soft Solutions, students can enroll in courses like:
Machine Learning: From the basics to advanced algorithms, learn how to build predictive models and data analysis solutions.
Java Development: Master Java, from object-oriented principles to frameworks like Spring Boot and Hibernate.
Cyber Security: Understand the world of ethical hacking, network security, and digital forensics.
Web Development: Gain expertise in front-end and back-end technologies like HTML, CSS, JavaScript, React, Node.js, and more.
Their Summer Training for Engineering Students program is designed to provide hands-on learning, live project experience, and certifications that will give you a competitive edge in your career. Whether you're pursuing internships or job opportunities, this training will help you stand out in the competitive tech field.
Choose Li-Mat Soft Solutions and get the skills, knowledge, and experience needed to succeed in your future career.
0 notes
Text
Best Online Courses for Learning Data Science in 2025
Why Learn Data Science in 2025?

In 2025, mastering data science remains one of the most valuable career moves you can make. According to the World Economic Forum’s Future of Jobs Report 2023, data analysts and scientists are among the top 10 fastest-growing job roles. Similarly, LinkedIn’s Jobs on the Rise 2024 highlights data science roles as some of the most sought-after positions across industries.
From driving AI advancements and ensuring the accuracy of financial forecasts to supporting healthcare decisions and personalizing e-commerce experiences, data science is at the core of today’s innovations. Every industry is becoming increasingly data-driven, making data science expertise crucial for career growth.
Pursuing an online certificate course in data science not only opens doors to high-paying opportunities but also future-proofs your career against automation. Whether you're a student, a working professional seeking to upgrade your skills, or someone aiming for a career transition, gaining expertise in data science by 2025 is essential for staying competitive in the global job market.
Top Data Science Courses to Take in 2025
Data Science: Machine Learning – Harvard/edX
Offered by Harvard through edX, this intermediate-level course dives deep into machine learning concepts such as model training, principal component analysis (PCA), and various algorithms. It is part of Harvard’s prestigious Data Science Professional Certificate series. Focused on both theoretical knowledge and real-world applications, this course uses R for implementation. It's ideal for learners comfortable with basic statistics and programming who want to strengthen their understanding of supervised and unsupervised learning.
Data Science: Inference and Modeling – Harvard/edX
Another strong offering from Harvard via edX, this course covers key topics like statistical inference, probability theory, and predictive modeling. Perfect for those with some experience in data analysis, it sharpens your statistical thinking and teaches you how to estimate unknown values and make predictions—essential skills for any aspiring data scientist.
Introduction to Data Science with Python – edX
This beginner-friendly course provides a strong foundation in data science using Python. It covers Python programming essentials, data manipulation using pandas, and basic regression models. Whether you're aiming to land an analyst role, strengthen your analytical toolkit, or pivot to a data-related career, this course offers a great starting point.
Final Thoughts: How to Choose the Right Data Science Course
With so many excellent data science courses available in 2025, selecting the right one depends on your personal and career aspirations. Are you looking to become a data analyst, transition into AI/ML, or simply build data literacy for your current role? First, define your career goals clearly. Then, choose a course aligned with your vision. Also, consider how much time you can realistically commit to learning. Filters like course price, difficulty level, and certification availability can help narrow down your options.
Explore the best data science courses tailored to your needs on Class Bazaar today!
0 notes
Text
Data Manipulation: A Beginner's Guide to Pandas Dataframe Operations
Outline: What’s a Pandas Dataframe? (Think Spreadsheet on Steroids!) Say Goodbye to Messy Data: Pandas Tames the Beast Rows, Columns, and More: Navigating the Dataframe Landscape Mastering the Magic: Essential Dataframe Operations Selection Superpower: Picking the Data You Need Grab Specific Columns: Like Picking Out Your Favorite Colors Filter Rows with Precision: Finding Just the Right…
View On WordPress
#data manipulation#grouping data#how to manipulate data in pandas#pandas dataframe operations explained#pandas filtering#pandas operations#pandas sorting
0 notes
Text
Price: [price_with_discount] (as of [price_update_date] - Details) [ad_1] ⚡Master Python Automation Like a Pro – Save time, Eliminate Repetitive Tasks & Supercharge Productivity - (2025 Edition)⚡❌ Tired of wasting time on repetitive tasks? ❌ Struggling to streamline workflows with Python? ❌ Want to automate everything from file management to web scraping and APIs?If yes, then, keep reading. This book is for you.In today’s digital world, automation isn’t a luxury, it’s a necessity. Whether you're a developer, data analyst, or business professional, automating repetitive tasks saves time, reduces errors and boosts productivity. Python’s simplicity and vast libraries make it the perfect tool; but knowing where to start can be overwhelming.This step-by-step crash course takes you from automation fundamentals to real-world applications. You’ll write efficient Python scripts, automate files, emails, databases, and web APIs, and even build web automation bots with Selenium. Through hands-on projects, you’ll apply automation in real-world scenarios, helping you streamline workflows, optimize processes, and master Python automation with confidence. Master Python Automation like a pro With:Python Fundamentals & Setup: Quickly install Python, configure IDEs, and write your first automation script with ease. File & Folder Automation: Say goodbye to digital clutter! Automate file renaming, organization, and sorting. Web Scraping Mastery: Extract real-time data from websites using BeautifulSoup and Selenium. Advanced Web Scraping: Tackle CAPTCHAs, AJAX-heavy websites, and JavaScript-based content like a pro. API Integration & Automation: Automate data retrieval from REST APIs, parse JSON, and interact with online services. Email Automation: Schedule and send emails, handle attachments, and integrate with Gmail or Outlook. Task Scheduling: Automate repetitive tasks with Cron jobs (Linux/macOS) and Task Scheduler (Windows).Data Processing with Pandas: Clean, filter, and analyze large datasets to streamline automation workflows. Excel & Spreadsheet Automation: Generate reports, format data, and create automated templates for efficiency. Building Interactive Dashboards: Use Flask and AJAX to create real-time web apps with dynamic charts. Cloud-Based Automation: Sync data, automate backups, and work with AWS S3 and cloud storage. Real-World Automation Projects: Work on hands-on projects like auto-organizing files, scraping news, and sending automated alerts.and so much, much more.... Whether you're a beginner automating daily tasks, a data analyst optimizing workflows, or a developer scaling systems, this book is your step-by-step guide to Python automation. Imagine saving hours by automating data processing, web scraping, emails, and system tasks with just a few lines of code. You'll build practical scripts, streamline workflows, and master time-saving techniques used by professionals.With clear guidance, expert insights, and best practices, you'll gain the confidence to apply automation immediately in your work or personal projects..Why Wait? Take control of your workflow with Python automation.📈Scroll up,'Click "Buy Now" and start mastering Python automation today!🚀 ASIN : B0DR38KB47 Language : English File size : 2.5 MB Simultaneous device usage : Unlimited Text-to-Speech : Enabled
Screen Reader : Supported Enhanced typesetting : Enabled X-Ray : Not Enabled Word Wise : Not Enabled Print length : 362 pages [ad_2]
0 notes
Text
Essential Technical Skills for a Successful Career in Business Analytics

If you're fascinated by the idea of bridging the gap between business acumen and analytical prowess, then a career in Business Analytics might be your perfect fit. But what specific technical skills are essential to thrive in this field?
Building Your Technical Arsenal
Data Retrieval and Manipulation: SQL proficiency is non-negotiable. Think of SQL as your scuba gear, allowing you to dive deep into relational databases and retrieve the specific data sets you need for analysis. Mastering queries, filters, joins, and aggregations will be your bread and butter.
Statistical Software: Unleash the analytical might of R and Python. These powerful languages go far beyond basic calculations. With R, you can create complex statistical models, perform hypothesis testing, and unearth hidden patterns in your data. Python offers similar functionalities and boasts a vast library of data science packages like NumPy, Pandas, and Scikit-learn, empowering you to automate tasks, build machine learning models, and create sophisticated data visualizations.
Data Visualization: Craft compelling data stories with Tableau, Power BI, and QlikView. These visualization tools are your paintbrushes, transforming raw data into clear, impactful charts, graphs, and dashboards. Master the art of storytelling with data, ensuring your insights resonate with both technical and non-technical audiences. Learn to create interactive dashboards that allow users to explore the data themselves, fostering a data-driven culture within the organization.
Business Intelligence (BI) Expertise: Become a BI whiz. BI software suites are the command centers of data management. Tools like Microsoft Power BI, Tableau Server, and Qlik Sense act as a central hub, integrating data from various sources (databases, spreadsheets, social media) and presenting it in a cohesive manner. Learn to navigate these platforms to create performance dashboards, track key metrics, and identify trends that inform strategic decision-making.
Beyond the Basics: Stay ahead of the curve. The technical landscape is ever-evolving. Consider exploring cloud computing platforms like Amazon Web Services (AWS), Microsoft Azure, and Google Cloud Platform (GCP) for data storage, management, and scalability. Familiarize yourself with data warehousing concepts and tools like Apache Spark for handling massive datasets efficiently.
.
Organizations Hiring Business Analytics and Data Analytics Professionals:
Information Technology (IT) and IT-enabled Services (ITES):
TCS, Infosys, Wipro, HCL, Accenture, Cognizant, Tech Mahindra (Business Analyst: Rs.400,000 - Rs.1,200,000, Data Analyst: Rs.500,000 - Rs.1,400,000)
Multinational Corporations with Indian operations:
IBM, Dell, HP, Google, Amazon, Microsoft (Business Analyst: Rs.500,000 - Rs.1,500,000, Data Analyst: Rs.600,000 - Rs.1,600,000)
Banking, Financial Services and Insurance (BFSI):
HDFC Bank, ICICI Bank, SBI, Kotak Mahindra Bank, Reliance Life Insurance, LIC (Business Analyst: Rs.550,000 - Rs.1,300,000, Data Analyst: Rs.650,000 - Rs.1,500,000)
E-commerce and Retail:
Flipkart, Amazon India, Myntra, Snapdeal, Big basket (Business Analyst: Rs. 450,000 - Rs. 1,000,000, Data Analyst: Rs. 550,000 - Rs. 1,200,000)
Management Consulting Firms:
McKinsey & Company, Bain & Company, Boston Consulting Group (BCG) (Business Analyst: Rs.700,000 - Rs.1,800,000, Data Scientist: Rs.800,000 - Rs.2,000,000)
By mastering this technical arsenal, you'll be well-equipped to transform from data novice to data maestro. Consider pursuing an MBA in Business Analytics, like the one offered by Poddar Management and Technical Campus, Jaipur. These programs often integrate industry projects and internships, providing valuable hands-on experience with the latest tools and technologies.
0 notes
Text
Python for YouTube: Backend, Scripting & Deployment
YouTube, the world’s largest video-sharing platform, relies on powerful programming languages to ensure smooth functionality, scalability, and efficiency. Python plays a critical role in YouTube’s backend development, scripting, and deployment. Given its simplicity, readability, and extensive libraries, Python helps YouTube manage vast amounts of data, optimize video processing, and enhance user experience.
Python's widespread adoption by tech giants like YouTube proves its importance in modern web applications. If you are looking to understand how Python is used by YouTube, this blog will provide in-depth insights into its role in backend development, automation, and scaling operations efficiently.
Why YouTube Uses Python
Python is a preferred language at YouTube due to its ease of use, robust libraries, and scalability. Here are some key reasons why YouTube incorporates Python in its ecosystem:
1. Code Readability and Simplicity – Python’s clean and structured syntax makes it easy to maintain and scale.
2. Extensive Libraries and Frameworks – Python provides powerful frameworks like Django and Flask for web development.
3. High Scalability – YouTube’s infrastructure demands scalability, which Python efficiently provides.
4. Fast Development and Deployment – Python speeds up development cycles, making it ideal for scripting and automation.
5. Data Handling and Processing – Python supports large-scale data processing required for recommendations and video analytics.
Role of Python in YouTube’s Backend Development
YouTube’s backend is designed to manage billions of users and videos while maintaining fast load times and minimal downtime. Python contributes significantly to this process by handling:
1. Server-Side Scripting
Python scripts play a crucial role in YouTube’s backend by automating various tasks such as:
Managing video uploads
Processing metadata
Handling user authentication
Generating video recommendations
2. Data Processing and Analytics
Python is used for analyzing massive amounts of user data to enhance YouTube’s recommendation algorithm. Libraries like Pandas, NumPy, and Scikit-learn help process this data efficiently, ensuring personalized video suggestions.
3. Content Delivery Optimization
Python helps optimize YouTube’s content delivery network (CDN) by automating caching strategies and load balancing to deliver videos quickly and efficiently to users worldwide.
4. Handling API Requests
YouTube’s API, which allows third-party applications to interact with the platform, relies on Python to manage requests, retrieve video data, and facilitate integrations seamlessly.
5. Security and User Authentication
Python contributes to YouTube’s robust security framework by managing OAuth authentication, data encryption, and access controls to prevent unauthorized access.
Python’s Role in YouTube’s Automation & Scripting
Automation is a key component of YouTube’s workflow. Python scripts are used extensively for:
Video Processing Automation – Python automates video transcoding and compression, ensuring compatibility across devices.
Spam Detection and Filtering – AI-powered Python scripts detect spam comments and fake user interactions.
Content Moderation – Machine learning models powered by Python assist in identifying inappropriate content.
Automated Testing and Debugging – Python is used to automate unit testing and debugging processes, improving system efficiency.
Python's automation capabilities significantly reduce manual intervention, enhancing operational efficiency at YouTube.
Python for YouTube’s Deployment and Scaling
YouTube must handle an enormous amount of data and traffic efficiently. Python contributes to its deployment strategy through:
1. Cloud Integration – YouTube leverages Python’s cloud-based libraries to manage video storage and streaming services seamlessly.
2. Microservices Architecture – Python enables YouTube to scale operations using microservices, improving efficiency.
3. Continuous Deployment – Python-based DevOps tools help in CI/CD (Continuous Integration/Continuous Deployment), ensuring regular updates without service disruptions.
4. Machine Learning & AI – Python powers YouTube’s AI-driven features, including speech recognition, video recommendations, and auto-captioning.
Softcrayons: Best Python Training Institute
If you want to master Python and build a successful career in backend development, automation, or cloud deployment, Softcrayons is the best institute to learn from.
Why Choose Softcrayons for Python Training?
Expert-Led Training – Learn from industry professionals with real-world experience.
Comprehensive Course Curriculum – Covers basic to advanced concepts, including web development, data analytics, and AI.
Hands-On Projects – Get practical experience with real-time projects.
100% Placement Assistance – Helps students secure top jobs in IT companies.
Flexible Learning Modes – Offers both online and offline courses.
Python Career Opportunities After Training
Python is in high demand across various industries. With Python training from Softcrayons, you can explore career opportunities in roles such as:
Python Developer
Backend Engineer
Data Analyst
Machine Learning Engineer
DevOps Engineer
Conclusion
Python plays a crucial role in YouTube’s backend development, automation, and deployment strategies. It enables efficient video processing, data analytics, and content delivery, ensuring seamless user experience for billions of users. With its scalability, ease of use, and extensive libraries, Python remains a top choice for tech giants like YouTube.
If you are looking to build a career in Python development, enrolling in a professional Python training course at Softcrayons will give you the necessary skills to excel in the industry. Master Python today and begin your journey of endless career opportunities in web development, automation, data analytics, and AI.
1 note
·
View note
Text
Top 8 Data Science Tools Everyone Should Know

In the dynamic world of data science, having the right tools at your disposal is crucial for success. From handling massive datasets to building sophisticated AI models, the data science ecosystem offers a plethora of powerful software and platforms. Whether you're a budding enthusiast or an experienced professional, mastering these top 8 data science tools will significantly enhance your capabilities.
1. Python: The Versatile Workhorse
Category: Exploratory Data Analysis, Data Modelling, Scripting, Automation
Why it's essential: Python's simplicity, extensive libraries (NumPy, Pandas, Scikit-learn, TensorFlow, PyTorch), and strong community support make it the go-to language for most data science tasks. From data manipulation and statistical analysis to building complex machine learning models, Python's versatility is unmatched.
2. R: The Statistical Maestro
Category: Exploratory Data Analysis, Data Modelling, Statistical Computing, Data Visualization
Why it's essential: R's strength lies in its rich collection of packages specifically designed for statistical analysis, econometric modelling, and creating publication-quality visualizations. It's a favorite among researchers and analysts in academic and industry settings.
3. SQL: The Data Whisperer (Data Storage & EDA)
Category: Data Storage, Exploratory Data Analysis
Why it's essential: SQL (Structured Query Language) is the fundamental language for interacting with relational databases, where a significant portion of business data resides. Mastering SQL allows you to efficiently extract, filter, and manipulate data for analysis and model building.
4. Apache Spark: Big Data Powerhouse (Data Storage & Modelling)
Category: Data Storage (for large datasets), Data Modelling (scalable machine learning)
Why it's essential: With the exponential growth of data, Spark has become indispensable for processing and analyzing large, distributed datasets. Its in-memory processing capabilities significantly speed up ETL (Extract, Transform, Load) operations and enable scalable machine learning.
5. Pandas (Python Library): Your Data Manipulation Hub (EDA)
Category: Exploratory Data Analysis
Why it's essential: Built on top of Python, Pandas provides powerful and easy-to-use data structures (DataFrames) for data manipulation, cleaning, and analysis. It's a cornerstone for any data scientist working with tabular data.
6. Scikit-learn (Python Library): The Machine Learning Toolkit (Data Modelling)
Category: Data Modelling
Why it's essential: Scikit-learn offers a comprehensive set of efficient tools for machine learning tasks, including classification, regression, clustering, dimensionality reduction, and model selection. Its user-friendly 1 API makes it a popular choice for both beginners and experienced practitioners.
7. Tableau/Power BI: Visualizing Insights (Data Visualization)
Category: Data Visualization
Why it's essential: Transforming raw data into compelling and understandable visualizations is crucial for communicating insights effectively. Tableau and Power BI are leading business intelligence tools widely used by organizations to create interactive dashboards and reports.
8. Matplotlib & Seaborn (Python Libraries): The Art of Data Representation (Data Visualization)
Category: Data Visualization
Why it's essential: For more granular control over visualizations within the Python ecosystem, Matplotlib and Seaborn are essential libraries. They allow data scientists to create customized charts and plots for exploratory analysis and presentations.
Level Up Your Data Science Prowess with Xaltius Academy's Data Science and AI Program:
To truly master these essential data science tools and thrive in the data-driven landscape, consider enrolling in Xaltius Academy's Data Science and AI program. Our comprehensive curriculum is designed to equip you with the practical skills and theoretical knowledge needed to excel.
Here's how our program empowers you:
Hands-on Training: Gain practical experience using Python, R, SQL, and visualization tools through real-world case studies and projects.
In-depth Coverage: Develop a strong understanding of data storage solutions, exploratory data analysis techniques, and various data modeling algorithms.
Focus on Industry Best Practices: Learn to leverage these tools effectively to solve real business challenges.
Expert Guidance: Benefit from instruction by experienced data scientists and AI professionals.
Career Support: Receive dedicated support to help you launch or advance your data science career.
Conclusion:
Mastering these top 8 data science tools will significantly enhance your ability to extract meaningful insights from data and drive impactful decisions in today's rapidly evolving technological landscape. Embrace these tools, continuously learn, and consider the comprehensive training offered by Xaltius Academy's Data Science and AI program to arm yourself for a successful data science journey.
0 notes
Text
Essential Tools Every Beginner Data Analyst Should Master
Starting a career in data analytics is exciting—but also challenging if you’re unsure where to begin. One of the most important steps is getting comfortable with the essential tools used in the field. These tools help data analysts gather, clean, analyze, visualize, and present data in ways that support decision-making. From spreadsheet basics to advanced coding languages and visualization platforms, mastering the right tools is what transforms a beginner into a confident, job-ready data professional. In this blog, we’ll walk through the key tools every aspiring data analyst should learn and explain how each one fits into the data analysis workflow from the best Data Analytics Online Training.

Excel: The Foundation of Data Analysis
Excel remains one of the most widely used tools in data analysis, especially in small to mid-sized companies. It’s perfect for managing structured data, performing quick calculations, and building simple charts and dashboards. Beginners can start by mastering basic functions like VLOOKUP, IF statements, pivot tables, and conditional formatting. As you progress, learning Excel’s data analysis toolpak and advanced formulas will give you an edge when working with spreadsheets. Excel is often the first tool hiring managers expect you to know, so it’s a crucial starting point.
SQL: Language of Databases
Structured Query Language (SQL) is a must-have skill for any data analyst. It allows you to retrieve and manipulate data from relational databases, which are the backbone of most business systems. Understanding how to write queries, filter data, join tables, and perform aggregations is essential. SQL is used in nearly every industry—from finance to healthcare—and forms the basis of most analytics workflows. Once you’re comfortable with basic SQL commands, learning window functions and subqueries will help you handle more complex tasks with ease. If you want to learn more about Data Analytics, consider enrolling in an Best Online Training & Placement programs . They often offer certifications, mentorship, and job placement opportunities to support your learning journey.

Python: Power for Data Processing
While SQL handles querying, Python gives you the power to perform deeper data analysis and automation. Python is versatile, beginner-friendly, and widely used in data science and analytics. Libraries like Pandas, NumPy, and Matplotlib make it easy to clean, analyze, and visualize data. Python is especially useful when working with large datasets, web scraping, or building predictive models. Learning Python opens up many opportunities for growth, and its flexibility makes it a long-term asset in your analytics toolkit.
Tableau and Power BI: Data Visualization Tools
Data is most effective when it tells a story. That’s where tools like Tableau and Power BI come in. These platforms help data analysts create interactive dashboards and compelling visual reports that make insights easy to understand. Tableau is known for its powerful drag-and-drop interface, while Power BI integrates seamlessly with other Microsoft tools. Mastering one or both will allow you to communicate your findings clearly and help stakeholders make data-driven decisions. Visualization skills are increasingly in demand, and they can often set you apart from other candidates.
Google Sheets and Google Data Studio
For those working in collaborative or cloud-based environments, Google Sheets is an excellent alternative to Excel. It offers real-time editing and built-in functions for quick analysis. Paired with Google Data Studio, you can create free, interactive dashboards directly from your data. These tools are especially popular in startups and digital marketing roles. Familiarity with Google’s data ecosystem will expand your versatility as an analyst.
Jupyter Notebook: Interactive Coding Environment
Jupyter Notebook is an essential tool for working with Python in a clear, documented way. It allows you to write and execute code in chunks, making it ideal for step-by-step analysis and sharing your work with others. Many online tutorials and learning platforms use Jupyter to teach Python, and it’s widely used in professional settings for everything from data cleaning to exploratory analysis. For beginners, it offers a friendly and intuitive coding environment.
Git and GitHub: Version Control and Collaboration
As you begin building projects and working on teams, understanding version control becomes important. Git is a system that tracks changes in your code, and GitHub is a platform for sharing and collaborating on code repositories. While it may not seem essential at first, Git becomes increasingly valuable as you take on larger projects or contribute to collaborative work. Learning the basics—like cloning, committing, and pushing code—will prepare you for real-world analytics roles.
R: Another Option for Statistical Analysis
While Python is more common, R is another popular language for statistical computing and data visualization. It’s widely used in academic and research settings and is especially strong in advanced statistical modeling. Tools like RStudio provide an integrated environment for coding and reporting. If your career path involves research, academia, or specialized statistical work, learning R might be the right choice for you.
Cloud Platforms: BigQuery, AWS, and Azure
As data grows in size and complexity, cloud platforms like Google BigQuery, Amazon Web Services (AWS), and Microsoft Azure are becoming essential. These platforms allow data analysts to work with large datasets without worrying about local storage limits. While beginners don’t need to master cloud platforms immediately, getting familiar with the basics can give you an edge, especially if you’re aiming to work in larger organizations or tech-driven companies.
Choosing the Right Tools for You
It’s not necessary to learn every tool at once. Start with Excel and SQL, then gradually add Python and a visualization tool like Tableau or Power BI. Choose tools based on the job roles you’re targeting and the industries you’re interested in. As you grow more confident, expand your skill set with cloud platforms, Git, and more advanced analytics tools.
Conclusion
Mastering the essential tools of data analytics is the key to becoming job-ready and confident in your abilities. Each tool—whether it’s Excel, SQL, Python, or Tableau—plays a specific role in the data analysis process. By learning these tools step by step and applying them to real projects, you build a strong foundation that will support your career growth. With dedication and the right resources, you can go from a complete beginner to a skilled analyst capable of turning raw data into powerful business insights.
0 notes
Text
What is PySpark? A Beginner’s Guide
Introduction
The digital era gives rise to continuous expansion in data production activities. Organizations and businesses need processing systems with enhanced capabilities to process large data amounts efficiently. Large datasets receive poor scalability together with slow processing speed and limited adaptability from conventional data processing tools. PySpark functions as the data processing solution that brings transformation to operations.
The Python Application Programming Interface called PySpark serves as the distributed computing framework of Apache Spark for fast processing of large data volumes. The platform offers a pleasant interface for users to operate analytics on big data together with real-time search and machine learning operations. Data engineering professionals along with analysts and scientists prefer PySpark because the platform combines Python's flexibility with Apache Spark's processing functions.
The guide introduces the essential aspects of PySpark while discussing its fundamental elements as well as explaining operational guidelines and hands-on usage. The article illustrates the operation of PySpark through concrete examples and predicted outputs to help viewers understand its functionality better.
What is PySpark?
PySpark is an interface that allows users to work with Apache Spark using Python. Apache Spark is a distributed computing framework that processes large datasets in parallel across multiple machines, making it extremely efficient for handling big data. PySpark enables users to leverage Spark’s capabilities while using Python’s simple and intuitive syntax.
There are several reasons why PySpark is widely used in the industry. First, it is highly scalable, meaning it can handle massive amounts of data efficiently by distributing the workload across multiple nodes in a cluster. Second, it is incredibly fast, as it performs in-memory computation, making it significantly faster than traditional Hadoop-based systems. Third, PySpark supports Python libraries such as Pandas, NumPy, and Scikit-learn, making it an excellent choice for machine learning and data analysis. Additionally, it is flexible, as it can run on Hadoop, Kubernetes, cloud platforms, or even as a standalone cluster.
Core Components of PySpark
PySpark consists of several core components that provide different functionalities for working with big data:
RDD (Resilient Distributed Dataset) – The fundamental unit of PySpark that enables distributed data processing. It is fault-tolerant and can be partitioned across multiple nodes for parallel execution.
DataFrame API – A more optimized and user-friendly way to work with structured data, similar to Pandas DataFrames.
Spark SQL – Allows users to query structured data using SQL syntax, making data analysis more intuitive.
Spark MLlib – A machine learning library that provides various ML algorithms for large-scale data processing.
Spark Streaming – Enables real-time data processing from sources like Kafka, Flume, and socket streams.
How PySpark Works
1. Creating a Spark Session
To interact with Spark, you need to start a Spark session.

Output:

2. Loading Data in PySpark
PySpark can read data from multiple formats, such as CSV, JSON, and Parquet.

Expected Output (Sample Data from CSV):

3. Performing Transformations
PySpark supports various transformations, such as filtering, grouping, and aggregating data. Here’s an example of filtering data based on a condition.

Output:

4. Running SQL Queries in PySpark
PySpark provides Spark SQL, which allows you to run SQL-like queries on DataFrames.

Output:
5. Creating a DataFrame Manually
You can also create a PySpark DataFrame manually using Python lists.

Output:

Use Cases of PySpark
PySpark is widely used in various domains due to its scalability and speed. Some of the most common applications include:
Big Data Analytics – Used in finance, healthcare, and e-commerce for analyzing massive datasets.
ETL Pipelines – Cleans and processes raw data before storing it in a data warehouse.
Machine Learning at Scale – Uses MLlib for training and deploying machine learning models on large datasets.
Real-Time Data Processing – Used in log monitoring, fraud detection, and predictive analytics.
Recommendation Systems – Helps platforms like Netflix and Amazon offer personalized recommendations to users.
Advantages of PySpark
There are several reasons why PySpark is a preferred tool for big data processing. First, it is easy to learn, as it uses Python’s simple and intuitive syntax. Second, it processes data faster due to its in-memory computation. Third, PySpark is fault-tolerant, meaning it can automatically recover from failures. Lastly, it is interoperable and can work with multiple big data platforms, cloud services, and databases.
Getting Started with PySpark
Installing PySpark
You can install PySpark using pip with the following command:

To use PySpark in a Jupyter Notebook, install Jupyter as well:

To start PySpark in a Jupyter Notebook, create a Spark session:

Conclusion
PySpark is an incredibly powerful tool for handling big data analytics, machine learning, and real-time processing. It offers scalability, speed, and flexibility, making it a top choice for data engineers and data scientists. Whether you're working with structured data, large-scale machine learning models, or real-time data streams, PySpark provides an efficient solution.
With its integration with Python libraries and support for distributed computing, PySpark is widely used in modern big data applications. If you’re looking to process massive datasets efficiently, learning PySpark is a great step forward.
youtube
#pyspark training#pyspark coutse#apache spark training#apahe spark certification#spark course#learn apache spark#apache spark course#pyspark certification#hadoop spark certification .#Youtube
0 notes
Text
How to Build Interactive Dashboards with Pandas, Matplotlib, and Dash
Building Interactive Dashboards with Pandas, Matplotlib, and Dash for Data Insights 1. Introduction Interactive dashboards are powerful tools for data visualization and analysis, enabling users to explore data dynamically. They are crucial for business decision-making, offering insights through interactive elements like filters and real-time updates. This tutorial will guide you in creating…
0 notes