#pandas dataframe tutorial
Explore tagged Tumblr posts
Visit Tumblr Blog
Explore Tumblr blogs with no restrictions, modern design and the best experience.
Last Seen Tumblr Blogs


Fun Fact
China blocked Tumblr because of pornography and censorship problems in 2013.
Text
DataFrame in Pandas: Guide to Creating Awesome DataFrames
Explore how to create a dataframe in Pandas, including data input methods, customization options, and practical examples.
Data analysis used to be a daunting task, reserved for statisticians and mathematicians. But with the rise of powerful tools like Python and its fantastic library, Pandas, anyone can become a data whiz! Pandas, in particular, shines with its DataFrames, these nifty tables that organize and manipulate data like magic. But where do you start? Fear not, fellow data enthusiast, for this guide will…
View On WordPress
#advanced dataframe features#aggregating data in pandas#create dataframe from dictionary in pandas#create dataframe from list in pandas#create dataframe in pandas#data manipulation in pandas#dataframe indexing#filter dataframe by condition#filter dataframe by multiple conditions#filtering data in pandas#grouping data in pandas#how to make a dataframe in pandas#manipulating data in pandas#merging dataframes#pandas data structures#pandas dataframe tutorial#python dataframe basics#rename columns in pandas dataframe#replace values in pandas dataframe#select columns in pandas dataframe#select rows in pandas dataframe#set column names in pandas dataframe#set row names in pandas dataframe
0 notes
Text
Python for Data Science: The Only Guide You Need to Get Started in 2025
Data is the lifeblood of modern business, powering decisions in healthcare, finance, marketing, sports, and more. And at the core of it all lies a powerful and beginner-friendly programming language — Python.
Whether you’re an aspiring data scientist, analyst, or tech enthusiast, learning Python for data science is one of the smartest career moves you can make in 2025.
In this guide, you’ll learn:
Why Python is the preferred language for data science
The libraries and tools you must master
A beginner-friendly roadmap
How to get started with a free full course on YouTube
Why Python is the #1 Language for Data Science
Python has earned its reputation as the go-to language for data science and here's why:
1. Easy to Learn, Easy to Use
Python’s syntax is clean, simple, and intuitive. You can focus on solving problems rather than struggling with the language itself.
2. Rich Ecosystem of Libraries
Python offers thousands of specialized libraries for data analysis, machine learning, and visualization.
3. Community and Resources
With a vibrant global community, you’ll never run out of tutorials, forums, or project ideas to help you grow.
4. Integration with Tools & Platforms
From Jupyter notebooks to cloud platforms like AWS and Google Colab, Python works seamlessly everywhere.
What You Can Do with Python in Data Science
Let’s look at real tasks you can perform using Python: TaskPython ToolsData cleaning & manipulationPandas, NumPyData visualizationMatplotlib, Seaborn, PlotlyMachine learningScikit-learn, XGBoostDeep learningTensorFlow, PyTorchStatistical analysisStatsmodels, SciPyBig data integrationPySpark, Dask
Python lets you go from raw data to actionable insight — all within a single ecosystem.
A Beginner's Roadmap to Learn Python for Data Science
If you're starting from scratch, follow this step-by-step learning path:
✅ Step 1: Learn Python Basics
Variables, data types, loops, conditionals
Functions, file handling, error handling
✅ Step 2: Explore NumPy
Arrays, broadcasting, numerical computations
✅ Step 3: Master Pandas
DataFrames, filtering, grouping, merging datasets
✅ Step 4: Visualize with Matplotlib & Seaborn
Create charts, plots, and visual dashboards
✅ Step 5: Intro to Machine Learning
Use Scikit-learn for classification, regression, clustering
✅ Step 6: Work on Real Projects
Apply your knowledge to real-world datasets (Kaggle, UCI, etc.)
Who Should Learn Python for Data Science?
Python is incredibly beginner-friendly and widely used, making it ideal for:
Students looking to future-proof their careers
Working professionals planning a transition to data
Analysts who want to automate and scale insights
Researchers working with data-driven models
Developers diving into AI, ML, or automation
How Long Does It Take to Learn?
You can grasp Python fundamentals in 2–3 weeks with consistent daily practice. To become proficient in data science using Python, expect to spend 3–6 months, depending on your pace and project experience.
The good news? You don’t need to do it alone.
🎓 Learn Python for Data Science ��� Full Free Course on YouTube
We’ve put together a FREE, beginner-friendly YouTube course that covers everything you need to start your data science journey using Python.
📘 What You’ll Learn:
Python programming basics
NumPy and Pandas for data handling
Matplotlib for visualization
Scikit-learn for machine learning
Real-life datasets and projects
Step-by-step explanations
📺 Watch the full course now → 👉 Python for Data Science Full Course
You’ll walk away with job-ready skills and project experience — at zero cost.
🧭 Final Thoughts
Python isn’t just a programming language — it’s your gateway to the future.
By learning Python for data science, you unlock opportunities across industries, roles, and technologies. The demand is high, the tools are ready, and the learning path is clearer than ever.
Don’t let analysis paralysis hold you back.
Click here to start learning now → https://youtu.be/6rYVt_2q_BM
#PythonForDataScience #LearnPython #FreeCourse #DataScience2025 #MachineLearning #NumPy #Pandas #DataAnalysis #AI #ScikitLearn #UpskillNow
1 note
·
View note
Text
Top 10 Python libraries for 2025

Top 10 Python Libraries You Should Master in 2025
Python has remained one of the top programming languages over the years because of its ease, adaptability, and large community. In 2025, Python is still the leading language across different fields, ranging from web design to data science and machine learning. To be competitive and productive in your Python projects, mastering the correct libraries is critical. Here's a list of the top 10 Python libraries you should learn in 2025 to level up your coding game. 1. TensorFlow Use Case: Machine Learning & Deep Learning Overview: TensorFlow, created by Google, is one of the leading machine learning and deep learning libraries. It's utilized for creating and training deep neural networks and is extensively used in many applications like image recognition, natural language processing, and autonomous systems. Why Master It? With the advent of AI and deep learning in 2025, TensorFlow is a library that must be mastered. It's extremely flexible, accommodates scalable machine learning tasks, and enjoys strong community support and tutorials. 2. Pandas Use Case: Data Manipulation & Analysis Overview: Pandas is a must-have library for data manipulation and analysis. It offers robust tools for data cleaning, analysis, and visualization through its DataFrame and Series data structures. It integrates perfectly with data from various sources such as CSV, Excel, SQL databases, and others. Why Master It? Data analytics and science remain key areas in 2025. Pandas is central to data wrangling and analysis and, thus, a must-have tool for anyone handling data. 3. Flask Use Case: Web Development (Micro-Framework) Overview: Flask is a simple, lightweight web framework in Python used for quick and efficient development of web applications. It's bare-bones, having flexibility for developers who desire greater control over their applications. Why Master It? Flask will still be a favorite for microservices and APIs in 2025. It's ideal for those who like the modular way of developing applications, so it's great for fast and scalable web development. 4. NumPy Use Case: Scientific Computing & Numerical Analysis Overview: NumPy is the backbone of numerical computing in Python. It supports large multi-dimensional arrays and matrices and has an enormous library of high-level mathematical functions to work on these arrays. Why Master It? In 2025, numerical computing will still be critical to data science, finance, machine learning, and engineering tasks. NumPy mastering is vital to efficient mathematical operations and data manipulation in scientific computing. 5. PyTorch Use Case: Machine Learning & Deep Learning Overview: PyTorch is a deep learning framework created by Facebook's AI Research lab and has quickly become popular because it is flexible, easy to use, and has a large community of developers. It's utilized for creating sophisticated neural networks and is also famous for having a dynamic computation graph. Why Master It? PyTorch is a top pick for machine learning practitioners in 2025, particularly for research and experimentation. It's simple yet powerful, and that makes it a great fit for leading-edge AI development. 6. Matplotlib Use Case: Data Visualization Overview: Matplotlib is the first choice library to create static, animated, and interactive visualizations in Python. It's applied for plotting data, graph creation, and chart construction that facilitates making sense of big datasets. Why Master It? Data visualization is crucial to the interpretation and representation of insights. Learning Matplotlib will enable you to effectively communicate your data discoveries, making it an essential for data analysts, scientists, and anyone who works with data in 2025. 7. Scikit-learn Use Case: Machine Learning Overview: Scikit-learn is among the most widely used machine learning libraries, providing simple-to-use tools for classification, regression, clustering, and dimensionality reduction. It can handle both supervised and unsupervised learning and is compatible with other scientific libraries such as NumPy and SciPy. Why Master It? In 2025, Scikit-learn continues to be a robust, easy-to-use library for creating and deploying machine learning models. Its simplicity and thoroughly documented functionality make it perfect for both beginners and experts in data science and machine learning. 8. Keras Use Case: Deep Learning Overview: Keras is an open source library that is an interface for TensorFlow, enabling users to make deep learning model creation and training more convenient. Keras uses a high-level API that allows it to design neural networks and sophisticated models without complexities. Why Master It With the increased significance of deep learning, Keras will be a go-to choice in 2025. It makes designing neural networks easier and is a great tool for those who need to prototype deep learning models very quickly without delving into difficult code. 9. Django Use Case: Web Development (Full-Stack Framework) Overview: Django is a Python web framework for rapid development and clean, pragmatic design. It also has built-in features such as authentication, an admin interface, and an ORM (Object-Relational Mapping) that make it suitable for developing strong web applications. Why Master It? In 2025, Django remains a top choice among frameworks for creating scalable, secure, and easy-to-maintain web applications. To work in full-stack web development, you must be proficient in Django. 10. Seaborn Use Case: Data Visualization Overview: Seaborn is a Python data visualization library based on Matplotlib. Seaborn simplifies the development of attractive and informative statistical visualizations. Seaborn gives a high-level interface for making beautiful and informative data visualizations. Why Master It? Seaborn will still be useful in 2025 for people working on depicting sophisticated statistical data. It is ideal for data analysis due to its inclusion with Pandas and NumPy, and rich color palettes and styles will make your plots look more visually appealing. Conclusion As we enter 2025, these top 10 Python libraries—spanning from AI and machine learning libraries such as TensorFlow and PyTorch to web frameworks such as Flask and Django—will inform the future of software development, data science, AI, and web applications. Regardless of your level of expertise—beginner or experienced Python developer—becoming a master of these libraries will give you the knowledge necessary to remain competitive and effective in the modern tech world. Read the full article
#DeepLearning#Django#Flask#Keras#MachineLearning#Matplotlib#NaturalLanguageProcessing#NumPy#Pandas#PyTorch#Scikit-learn#Seaborn#TensorFlow
0 notes
Text
Pandas DataFrame Tutorial: Ways to Create and Manipulate Data in Python Are you diving into data analysis with Python? Then you're about to become best friends with pandas DataFrames. These powerful, table-like structures are the backbone of data manipulation in Python, and knowing how to create them is your first step toward becoming a data analysis expert. In this comprehensive guide, we'll explore everything you need to know about creating pandas DataFrames, from basic methods to advanced techniques. Whether you're a beginner or looking to level up your skills, this tutorial has got you covered. Getting Started with Pandas Before we dive in, let's make sure you have everything set up. First, you'll need to install pandas if you haven't already: pythonCopypip install pandas Then, import pandas in your Python script: pythonCopyimport pandas as pd 1. Creating a DataFrame from Lists The simplest way to create a DataFrame is using Python lists. Here's how: pythonCopy# Creating a basic DataFrame from lists data = 'name': ['John', 'Emma', 'Alex', 'Sarah'], 'age': [28, 24, 32, 27], 'city': ['New York', 'London', 'Paris', 'Tokyo'] df = pd.DataFrame(data) print(df) This creates a clean, organized table with your data. The keys in your dictionary become column names, and the values become the data in each column. 2. Creating a DataFrame from NumPy Arrays When working with numerical data, NumPy arrays are your friends: pythonCopyimport numpy as np # Creating a DataFrame from a NumPy array array_data = np.random.rand(4, 3) df_numpy = pd.DataFrame(array_data, columns=['A', 'B', 'C'], index=['Row1', 'Row2', 'Row3', 'Row4']) print(df_numpy) 3. Reading Data from External Sources Real-world data often comes from files. Here's how to create DataFrames from different file formats: pythonCopy# CSV files df_csv = pd.read_csv('your_file.csv') # Excel files df_excel = pd.read_excel('your_file.xlsx') # JSON files df_json = pd.read_json('your_file.json') 4. Creating a DataFrame from a List of Dictionaries Sometimes your data comes as a list of dictionaries, especially when working with APIs: pythonCopy# List of dictionaries records = [ 'name': 'John', 'age': 28, 'department': 'IT', 'name': 'Emma', 'age': 24, 'department': 'HR', 'name': 'Alex', 'age': 32, 'department': 'Finance' ] df_records = pd.DataFrame(records) print(df_records) 5. Creating an Empty DataFrame Sometimes you need to start with an empty DataFrame and fill it later: pythonCopy# Create an empty DataFrame with defined columns columns = ['Name', 'Age', 'City'] df_empty = pd.DataFrame(columns=columns) # Add data later new_row = 'Name': 'Lisa', 'Age': 29, 'City': 'Berlin' df_empty = df_empty.append(new_row, ignore_index=True) 6. Advanced DataFrame Creation Techniques Using Multi-level Indexes pythonCopy# Creating a DataFrame with multi-level index arrays = [ ['2023', '2023', '2024', '2024'], ['Q1', 'Q2', 'Q1', 'Q2'] ] data = 'Sales': [100, 120, 150, 180] df_multi = pd.DataFrame(data, index=arrays) print(df_multi) Creating Time Series DataFrames pythonCopy# Creating a time series DataFrame dates = pd.date_range('2024-01-01', periods=6, freq='D') df_time = pd.DataFrame(np.random.randn(6, 4), index=dates, columns=['A', 'B', 'C', 'D']) Best Practices and Tips Always Check Your Data Types pythonCopy# Check data types of your DataFrame print(df.dtypes) Set Column Names Appropriately Use clear, descriptive column names without spaces: pythonCopydf.columns = ['first_name', 'last_name', 'email'] Handle Missing Data pythonCopy# Check for missing values print(df.isnull().sum()) # Fill missing values df.fillna(0, inplace=True) Common Pitfalls to Avoid Memory Management: Be cautious with large datasets. Use appropriate data types to minimize memory usage:
pythonCopy# Optimize numeric columns df['integer_column'] = df['integer_column'].astype('int32') Copy vs. View: Understand when you're creating a copy or a view: pythonCopy# Create a true copy df_copy = df.copy() Conclusion Creating pandas DataFrames is a fundamental skill for any data analyst or scientist working with Python. Whether you're working with simple lists, complex APIs, or external files, pandas provides flexible and powerful ways to structure your data. Remember to: Choose the most appropriate method based on your data source Pay attention to data types and memory usage Use clear, consistent naming conventions Handle missing data appropriately With these techniques in your toolkit, you're well-equipped to handle any data manipulation task that comes your way. Practice with different methods and explore the pandas documentation for more advanced features as you continue your data analysis journey. Additional Resources Official pandas documentation Pandas cheat sheet Python for Data Science Handbook Real-world pandas examples on GitHub Now you're ready to start creating and manipulating DataFrames like a pro. Happy coding!
0 notes
Text
Getting Started with Data Analysis Using Python

Data analysis is a critical skill in today’s data-driven world. Whether you're exploring business insights or conducting academic research, Python offers powerful tools for data manipulation, visualization, and reporting. In this post, we’ll walk through the essentials of data analysis using Python, and how you can begin analyzing real-world data effectively.
Why Python for Data Analysis?
Easy to Learn: Python has a simple and readable syntax.
Rich Ecosystem: Extensive libraries like Pandas, NumPy, Matplotlib, and Seaborn.
Community Support: A large, active community providing tutorials, tools, and resources.
Scalability: Suitable for small scripts or large-scale machine learning pipelines.
Essential Python Libraries for Data Analysis
Pandas: Data manipulation and analysis using DataFrames.
NumPy: Fast numerical computing and array operations.
Matplotlib: Basic plotting and visualizations.
Seaborn: Advanced and beautiful statistical plots.
Scikit-learn: Machine learning and data preprocessing tools.
Step-by-Step: Basic Data Analysis Workflow
1. Import Libraries
import pandas as pd import numpy as np import matplotlib.pyplot as plt import seaborn as sns
2. Load Your Dataset
df = pd.read_csv('data.csv') # Replace with your file path print(df.head())
3. Clean and Prepare Data
df.dropna(inplace=True) # Remove missing values df['Category'] = df['Category'].astype('category') # Convert to category type
4. Explore Data
print(df.describe()) # Summary statistics print(df.info()) # Data types and memory usage
5. Visualize Data
sns.histplot(df['Sales']) plt.title('Sales Distribution') plt.show() sns.boxplot(x='Category', y='Sales', data=df) plt.title('Sales by Category') plt.show()
6. Analyze Trends
monthly_sales = df.groupby('Month')['Sales'].sum() monthly_sales.plot(kind='line', title='Monthly Sales Trend') plt.xlabel('Month') plt.ylabel('Sales') plt.show()
Tips for Effective Data Analysis
Understand the context and source of your data.
Always check for missing or inconsistent data.
Visualize patterns before jumping into conclusions.
Automate repetitive tasks with reusable scripts or functions.
Use Jupyter Notebooks for interactive analysis and documentation.
Advanced Topics to Explore
Time Series Analysis
Data Wrangling with Pandas
Statistical Testing and Inference
Predictive Modeling with Scikit-learn
Interactive Dashboards with Plotly or Streamlit
Conclusion
Python makes data analysis accessible and efficient for beginners and professionals alike. With the right libraries and a structured approach, you can gain valuable insights from raw data and make data-driven decisions. Start experimenting with datasets, and soon you'll be crafting insightful reports and visualizations with ease!
0 notes
Text
How to Split DataFrame into Multiple Lists Row Wise Horizontally in Python Pandas | Python Tutorials
via IFTTT
youtube
View On WordPress
#coding#computer science#india#information technology#learning#online#programming#Python#teaching#tutorial#Youtube
0 notes
Text
Python for Data Analytics: A Solution Architect’s Perspective
As a solution architect, my career has been centered on designing robust, scalable systems tailored to meet diverse business needs. Over the years, I’ve worked on projects spanning various domains—cloud computing, infrastructure optimization, and application development. However, the growing emphasis on data-driven decision-making reshaped my perspective. Organizations now rely heavily on extracting actionable insights from their data, which made me realize that understanding and leveraging data analytics is no longer optional.
This journey into the world of data analytics began with an enriching data analytics training online program. This training not only introduced me to foundational concepts but also provided a structured pathway to mastering Python for data analytics—a skill I now consider indispensable for any tech professional.
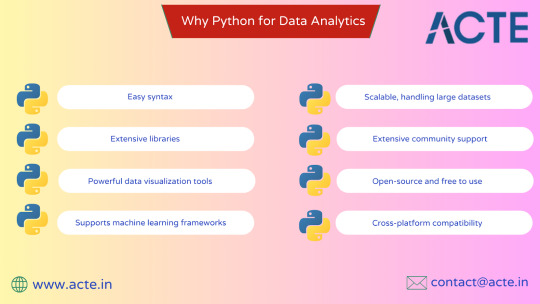
Why Python for Data Analytics?
Python has emerged as a game-changer in the data analytics space, and for good reasons:
Simplicity and Versatility: Python’s straightforward syntax makes it accessible for beginners, while its versatility allows professionals to handle complex tasks seamlessly.
Extensive Libraries: Libraries like Pandas, NumPy, Matplotlib, and Seaborn enable efficient data manipulation, visualization, and analysis. For advanced analytics, Scikit-learn and TensorFlow are the go-to tools for machine learning and predictive modeling.
Integration Capabilities: Python integrates effortlessly with other technologies and platforms, making it a preferred choice for end-to-end data solutions.
Community Support: With its vast global community, Python ensures you’ll always find support, tutorials, and updates to keep pace with the ever-evolving analytics landscape.
My First Steps with Python for Data Analytics
My initial foray into Python for data analytics was both exciting and challenging. While I was familiar with programming concepts, understanding the nuances of data manipulation required a shift in mindset. The training program I enrolled in emphasized hands-on projects, which was instrumental in solidifying my understanding.
One of my first projects involved analyzing system performance metrics. Using Python, I could process large datasets to identify patterns and anomalies in server utilization. Here’s what made Python stand out:
Data Manipulation with Pandas: I used Pandas to clean and restructure the data. Its DataFrame object made it easy to filter, sort, and aggregate information.
Visualization with Matplotlib and Seaborn: These libraries allowed me to create interactive and visually appealing graphs to present my findings to stakeholders.
Automation: By writing reusable scripts, I automated the process of monitoring and reporting, saving significant time and effort.
Diving Deeper: Advanced Applications of Python
As I delved deeper, I realized Python’s potential extended beyond basic analysis. It became a tool for solving complex business problems, such as:
Predictive Analytics: Using Scikit-learn, I developed models to forecast system downtimes based on historical data. This proactive approach helped in optimizing resources and minimizing disruptions.
Data Pipeline Development: Python’s integration capabilities allowed me to build ETL (Extract, Transform, Load) pipelines, ensuring seamless data flow between systems.
Real-Time Dashboards: By combining Flask (a lightweight web framework) with Python’s visualization libraries, I created dashboards that displayed real-time analytics, empowering teams to make informed decisions instantly.
The Role of Structured Training
While self-learning has its merits, structured training programs offer a unique edge, especially for professionals with limited time to explore on their own. My decision to undergo data analytics training in Hyderabad through ACTE Institute proved transformative.
Here’s what made this experience invaluable:
Expert Guidance: Industry professionals led the sessions, sharing insights that went beyond textbook knowledge.
Collaborative Environment: Engaging with peers from diverse backgrounds helped me understand different perspectives and approaches to problem-solving.
Hands-On Projects: Real-world scenarios provided a platform to apply theoretical concepts, bridging the gap between learning and implementation.
Feedback and Mentorship: Regular feedback from trainers ensured I stayed on track, while mentorship sessions helped me align my learning with career goals.
Key Learnings and Insights
The transition from a solution architect to a professional proficient in data analytics wasn’t without its challenges. However, every hurdle taught me something valuable:
Start Small, Think Big: It’s tempting to dive into complex machine learning models immediately. However, mastering the basics—data cleaning, exploration, and visualization—lays a strong foundation for advanced techniques.
Iterate and Experiment: Data analytics is an iterative process. The more you experiment, the better you understand the data and the tools you’re using.
Stay Curious: The field of data analytics is dynamic. Keeping up with the latest tools, techniques, and best practices ensures you remain relevant and effective.
Collaborate: Engaging with a community—be it through forums, training sessions, or professional networks—accelerates learning and opens doors to new opportunities.
Real-World Impact of Python for Data Analytics
Equipping myself with Python for data analytics has had a tangible impact on my work:
Enhanced Problem-Solving: Data-driven insights have enabled me to identify bottlenecks, predict outcomes, and design more effective solutions.
Improved Communication: Visualizations and dashboards created using Python help convey complex information in a clear and impactful way.
Career Growth: The ability to bridge technical expertise with analytical skills has positioned me as a more versatile and valuable professional.
Future Trends in Data Analytics
As I continue to explore Python for data analytics, I’m excited about the possibilities it holds for the future. Emerging trends like AI-driven analytics, natural language processing, and edge analytics are set to redefine how we interact with data. Python’s adaptability ensures it will remain a cornerstone of these advancements.
Final Thoughts
My journey into the world of data analytics has been transformative, both personally and professionally. From starting with a simple data analytics training online program to applying Python to solve complex business problems, the experience has been nothing short of rewarding.
If there’s one piece of advice I would offer to anyone contemplating this path, it’s this: invest in learning, embrace challenges, and don’t hesitate to experiment. Whether you’re an aspiring data analyst, a seasoned IT professional, or someone intrigued by the power of data, Python for data analytics is a skill worth mastering.
The training I received in data analytics training in Hyderabad served as a turning point, equipping me with the knowledge and confidence to navigate this exciting field. As organizations continue to prioritize data-driven strategies, the demand for professionals proficient in data analytics will only grow.
So, take that first step. Enroll in a training program, start exploring Python, and discover the endless possibilities that data analytics offers. Who knows? It might just redefine your career, as it did mine.
#ai#artificialintelligence#digitalmarketing#marketingstrategy#database#machinelearning#adtech#cybersecurity
0 notes
Text
Python for Data Analysis: A Practical Guide to Pandas and DataFrames
Introduction Python for Data Analysis: A Practical Guide to Pandas and DataFrames is a comprehensive tutorial that covers the essential concepts and techniques for working with data in Python. This guide is designed for data analysts, scientists, and engineers who want to learn how to work with data in Python using the popular Pandas library. In this tutorial, you will learn how to: Work with…
0 notes
Text
0 notes
Text
Unlock the Power of Pandas: Easy-to-Follow Python Tutorial for Newbies

Python Pandas is a powerful tool for working with data, making it a must-learn library for anyone starting in data analysis. With Pandas, you can effortlessly clean, organize, and analyze data to extract meaningful insights. This tutorial is perfect for beginners looking to get started with Pandas.
Pandas is a Python library designed specifically for data manipulation and analysis. It offers two main data structures: Series and DataFrame. A Series is like a single column of data, while a DataFrame is a table-like structure that holds rows and columns, similar to a spreadsheet.
Why use Pandas? First, it simplifies handling large datasets by providing easy-to-use functions for filtering, sorting, and grouping data. Second, it works seamlessly with other popular Python libraries, such as NumPy and Matplotlib, making it a versatile tool for data projects.
Getting started with Pandas is simple. After installing the library, you can load datasets from various sources like CSV files, Excel sheets, or even databases. Once loaded, Pandas lets you perform tasks like renaming columns, replacing missing values, or summarizing data in just a few lines of code.
If you're looking to dive deeper into how Pandas can make your data analysis journey smoother, explore this beginner-friendly guide: Python Pandas Tutorial. Start your journey today, and unlock the potential of data analysis with Python Pandas!
Whether you're a student or a professional, mastering Pandas will open doors to numerous opportunities in the world of data science.
0 notes
Text
Mastering Data Science Using Python
Data Science is not just a buzzword; it's the backbone of modern decision-making and innovation. If you're looking to step into this exciting field, Data Science using Python is a fantastic place to start. Python, with its simplicity and vast libraries, has become the go-to programming language for aspiring data scientists. Let’s explore everything you need to know to get started with Data Science using Python and take your skills to the next level.
What is Data Science?
In simple terms, Data Science is all about extracting meaningful insights from data. These insights help businesses make smarter decisions, predict trends, and even shape new innovations. Data Science involves various stages, including:
Data Collection
Data Cleaning
Data Analysis
Data Visualization
Machine Learning
Why Choose Python for Data Science?
Python is the heart of Data Science for several compelling reasons:
Ease of Learning: Python’s syntax is intuitive and beginner-friendly, making it ideal for those new to programming.
Versatile Libraries: Libraries like Pandas, NumPy, Matplotlib, and Scikit-learn make Python a powerhouse for data manipulation, analysis, and machine learning.
Community Support: With a vast and active community, you’ll always find solutions to challenges you face.
Integration: Python integrates seamlessly with other technologies, enabling smooth workflows.
Getting Started with Data Science Using Python
1. Set Up Your Python Environment
To begin, install Python on your system. Use tools like Anaconda, which comes preloaded with essential libraries for Data Science.
Once installed, launch Jupyter Notebook, an interactive environment for coding and visualizing data.
2. Learn the Basics of Python
Before diving into Data Science, get comfortable with Python basics:
Variables and Data Types
Control Structures (loops and conditionals)
Functions and Modules
File Handling
You can explore free resources or take a Python for Beginners course to grasp these fundamentals.
3. Libraries Essential for Data Science
Python’s true power lies in its libraries. Here are the must-know ones:
a) NumPy
NumPy is your go-to for numerical computations. It handles large datasets and supports multi-dimensional arrays.
Common Use Cases: Mathematical operations, linear algebra, random sampling.
Keywords to Highlight: NumPy for Data Science, NumPy Arrays, Data Manipulation in Python.
b) Pandas
Pandas simplifies working with structured data like tables. It’s perfect for data manipulation and analysis.
Key Features: DataFrames, filtering, and merging datasets.
Top Keywords: Pandas for Beginners, DataFrame Operations, Pandas Tutorial.
c) Matplotlib and Seaborn
For data visualization, Matplotlib and Seaborn are unbeatable.
Matplotlib: For creating static, animated, or interactive visualizations.
Seaborn: For aesthetically pleasing statistical plots.
Keywords to Use: Data Visualization with Python, Seaborn vs. Matplotlib, Python Graphs.
d) Scikit-learn
Scikit-learn is the go-to library for machine learning, offering tools for classification, regression, and clustering.
Steps to Implement Data Science Projects
Step 1: Data Collection
You can collect data from sources like web APIs, web scraping, or public datasets available on platforms like Kaggle.
Step 2: Data Cleaning
Raw data is often messy. Use Python to clean and preprocess it.
Remove duplicates and missing values using Pandas.
Normalize or scale data for analysis.
Step 3: Exploratory Data Analysis (EDA)
EDA involves understanding the dataset and finding patterns.
Use Pandas for descriptive statistics.
Visualize data using Matplotlib or Seaborn.
Step 4: Build Machine Learning Models
With Scikit-learn, you can train machine learning models to make predictions. Start with simple algorithms like:
Linear Regression
Logistic Regression
Decision Trees
Step 5: Data Visualization
Communicating results is critical in Data Science. Create impactful visuals that tell a story.
Use Case: Visualizing sales trends over time.
Best Practices for Data Science Using Python
1. Document Your Code
Always write comments and document your work to ensure your code is understandable.
2. Practice Regularly
Consistent practice on platforms like Kaggle or HackerRank helps sharpen your skills.
3. Stay Updated
Follow Python communities and blogs to stay updated on the latest tools and trends.
Top Resources to Learn Data Science Using Python
1. Online Courses
Platforms like Udemy, Coursera, and edX offer excellent Data Science courses.
Recommended Course: "Data Science with Python - Beginner to Pro" on Udemy.
2. Books
Books like "Python for Data Analysis" by Wes McKinney are excellent resources.
Keywords: Best Books for Data Science, Python Analysis Books, Data Science Guides.
3. Practice Platforms
Kaggle for hands-on projects.
HackerRank for Python coding challenges.
Career Opportunities in Data Science
Data Science offers lucrative career options, including roles like:
Data Analyst
Machine Learning Engineer
Business Intelligence Analyst
Data Scientist
How to Stand Out in Data Science
1. Build a Portfolio
Showcase projects on platforms like GitHub to demonstrate your skills.
2. Earn Certifications
Certifications like Google Data Analytics Professional Certificate or IBM Data Science Professional Certificate add credibility to your resume.
Conclusion
Learning Data Science using Python can open doors to exciting opportunities and career growth. Python's simplicity and powerful libraries make it an ideal choice for beginners and professionals alike. With consistent effort and the right resources, you can master this skill and stand out in the competitive field of Data Science.
0 notes
Text
About
Course
Basic Stats
Machine Learning
Software Tutorials
Tools
K-Means Clustering in Python: Step-by-Step Example
by Zach BobbittPosted on August 31, 2022
One of the most common clustering algorithms in machine learning is known as k-means clustering.
K-means clustering is a technique in which we place each observation in a dataset into one of K clusters.
The end goal is to have K clusters in which the observations within each cluster are quite similar to each other while the observations in different clusters are quite different from each other.
In practice, we use the following steps to perform K-means clustering:
1. Choose a value for K.
First, we must decide how many clusters we’d like to identify in the data. Often we have to simply test several different values for K and analyze the results to see which number of clusters seems to make the most sense for a given problem.
2. Randomly assign each observation to an initial cluster, from 1 to K.
3. Perform the following procedure until the cluster assignments stop changing.
For each of the K clusters, compute the cluster centroid. This is simply the vector of the p feature means for the observations in the kth cluster.
Assign each observation to the cluster whose centroid is closest. Here, closest is defined using Euclidean distance.
The following step-by-step example shows how to perform k-means clustering in Python by using the KMeans function from the sklearn module.
Step 1: Import Necessary Modules
First, we’ll import all of the modules that we will need to perform k-means clustering:import pandas as pd import numpy as np import matplotlib.pyplot as plt from sklearn.cluster import KMeans from sklearn.preprocessing import StandardScaler
Step 2: Create the DataFrame
Next, we’ll create a DataFrame that contains the following three variables for 20 different basketball players:
points
assists
rebounds
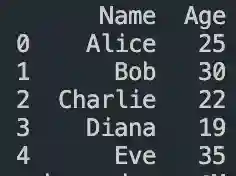
The following code shows how to create this pandas DataFrame:#create DataFrame df = pd.DataFrame({'points': [18, np.nan, 19, 14, 14, 11, 20, 28, 30, 31, 35, 33, 29, 25, 25, 27, 29, 30, 19, 23], 'assists': [3, 3, 4, 5, 4, 7, 8, 7, 6, 9, 12, 14, np.nan, 9, 4, 3, 4, 12, 15, 11], 'rebounds': [15, 14, 14, 10, 8, 14, 13, 9, 5, 4, 11, 6, 5, 5, 3, 8, 12, 7, 6, 5]}) #view first five rows of DataFrame print(df.head()) points assists rebounds 0 18.0 3.0 15 1 NaN 3.0 14 2 19.0 4.0 14 3 14.0 5.0 10 4 14.0 4.0 8
We will use k-means clustering to group together players that are similar based on these three metrics.
Step 3: Clean & Prep the DataFrame
Next, we’ll perform the following steps:
Use dropna() to drop rows with NaN values in any column
Use StandardScaler() to scale each variable to have a mean of 0 and a standard deviation of 1
The following code shows how to do so:#drop rows with NA values in any columns df = df.dropna() #create scaled DataFrame where each variable has mean of 0 and standard dev of 1 scaled_df = StandardScaler().fit_transform(df) #view first five rows of scaled DataFrame print(scaled_df[:5]) [[-0.86660275 -1.22683918 1.72722524] [-0.72081911 -0.96077767 1.45687694] [-1.44973731 -0.69471616 0.37548375] [-1.44973731 -0.96077767 -0.16521285] [-1.88708823 -0.16259314 1.45687694]]
Note: We use scaling so that each variable has equal importance when fitting the k-means algorithm. Otherwise, the variables with the widest ranges would have too much influence.
Step 4: Find the Optimal Number of Clusters
To perform k-means clustering in Python, we can use the KMeans function from the sklearn module.
This function uses the following basic syntax:
KMeans(init=’random’, n_clusters=8, n_init=10, random_state=None)
where:
init: Controls the initialization technique.
n_clusters: The number of clusters to place observations in.
n_init: The number of initializations to perform. The default is to run the k-means algorithm 10 times and return the one with the lowest SSE.
random_state: An integer value you can pick to make the results of the algorithm reproducible.
The most important argument in this function is n_clusters, which specifies how many clusters to place the observations in.
However, we don’t know beforehand how many clusters is optimal so we must create a plot that displays the number of clusters along with the SSE (sum of squared errors) of the model.
Typically when we create this type of plot we look for an “elbow” where the sum of squares begins to “bend” or level off. This is typically the optimal number of clusters.
The following code shows how to create this type of plot that displays the number of clusters on the x-axis and the SSE on the y-axis:#initialize kmeans parameters kmeans_kwargs = { "init": "random", "n_init": 10, "random_state": 1, } #create list to hold SSE values for each k sse = [] for k in range(1, 11): kmeans = KMeans(n_clusters=k, **kmeans_kwargs) kmeans.fit(scaled_df) sse.append(kmeans.inertia_) #visualize results plt.plot(range(1, 11), sse) plt.xticks(range(1, 11)) plt.xlabel("Number of Clusters") plt.ylabel("SSE") plt.show()
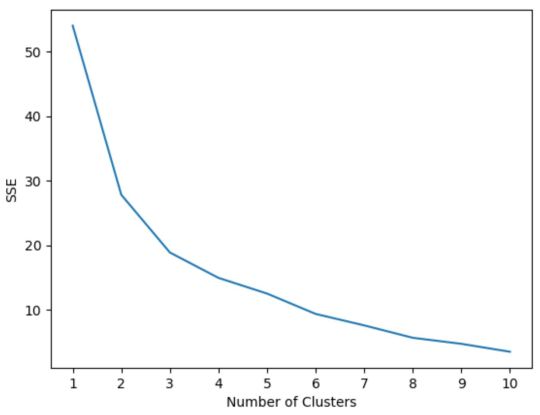
In this plot it appears that there is an elbow or “bend” at k = 3 clusters.
Thus, we will use 3 clusters when fitting our k-means clustering model in the next step.
Note: In the real-world, it’s recommended to use a combination of this plot along with domain expertise to pick how many clusters to use.
Step 5: Perform K-Means Clustering with Optimal K
The following code shows how to perform k-means clustering on the dataset using the optimal value for k of 3:#instantiate the k-means class, using optimal number of clusters kmeans = KMeans(init="random", n_clusters=3, n_init=10, random_state=1) #fit k-means algorithm to data kmeans.fit(scaled_df) #view cluster assignments for each observation kmeans.labels_ array([1, 1, 1, 1, 1, 1, 2, 2, 0, 0, 0, 0, 2, 2, 2, 0, 0, 0])
The resulting array shows the cluster assignments for each observation in the DataFrame.
To make these results easier to interpret, we can add a column to the DataFrame that shows the cluster assignment of each player:#append cluster assingments to original DataFrame df['cluster'] = kmeans.labels_ #view updated DataFrame print(df) points assists rebounds cluster 0 18.0 3.0 15 1 2 19.0 4.0 14 1 3 14.0 5.0 10 1 4 14.0 4.0 8 1 5 11.0 7.0 14 1 6 20.0 8.0 13 1 7 28.0 7.0 9 2 8 30.0 6.0 5 2 9 31.0 9.0 4 0 10 35.0 12.0 11 0 11 33.0 14.0 6 0 13 25.0 9.0 5 0 14 25.0 4.0 3 2 15 27.0 3.0 8 2 16 29.0 4.0 12 2 17 30.0 12.0 7 0 18 19.0 15.0 6 0 19 23.0 11.0 5 0
The cluster column contains a cluster number (0, 1, or 2) that each player was assigned to.
Players that belong to the same cluster have roughly similar values for the points, assists, and rebounds columns.
Note: You can find the complete documentation for the KMeans function from sklearn here.
Additional Resources
The following tutorials explain how to perform other common tasks in Python:
How to Perform Linear Regression in Python How to Perform Logistic Regression in Python How to Perform K-Fold Cross Validation in Python
1 note
·
View note
Text
BigQuery DataFrame And Gretel Verify Synthetic Data Privacy

It looked at how combining Gretel with BigQuery DataFrame simplifies synthetic data production while maintaining data privacy in the useful guide to synthetic data generation with Gretel and BigQuery DataFrames. In summary, BigQuery DataFrame is a Python client for BigQuery that offers analysis pushed down to BigQuery using pandas-compatible APIs.
Gretel provides an extensive toolkit for creating synthetic data using state-of-the-art machine learning methods, such as large language models (LLMs). An seamless workflow is made possible by this integration, which makes it simple for users to move data from BigQuery to Gretel and return the created results to BigQuery.
The technical elements of creating synthetic data to spur AI/ML innovation are covered in detail in this tutorial, along with tips for maintaining high data quality, protecting privacy, and adhering to privacy laws. In Part 1, to de-identify the data from a BigQuery patient records table, and in Part 2, it create synthetic data to be saved back to BigQuery.
Setting the stage: Installation and configuration
With BigFrames already installed, you may begin by using BigQuery Studio as the notebook runtime. To presume you are acquainted with Pandas and have a Google Cloud project set up.
Step 1: Set up BigQuery DataFrame and the Gretel Python client.
Step 2: Set up BigFrames and the Gretel SDK: To use their services, you will want a Gretel API key. One is available on the Gretel console.
Part 1: De-identifying and processing data with Gretel Transform v2
De-identifying personally identifiable information (PII) is an essential initial step in data anonymization before creating synthetic data. For these and other data processing tasks, Gretel Transform v2 (Tv2) offers a strong and expandable framework.
Tv2 handles huge datasets efficiently by combining named entity recognition (NER) skills with sophisticated transformation algorithms. Tv2 is a flexible tool in the data preparation pipeline as it may be used for preprocessing, formatting, and data cleaning in addition to PII de-identification. Study up on Gretel Transform v2.
Step 1: Convert your BigQuery table into a BigFrames DataFrame.
Step 2: Work with Gretel to transform the data.
Part 2: Generating synthetic data with Navigator Fine Tuning (LLM-based)
Gretel Navigator Fine Tuning (NavFT) refines pre-trained models on your datasets to provide high-quality, domain-specific synthetic data. Important characteristics include:
Manages a variety of data formats, including time series, JSON, free text, category, and numerical.
Maintains intricate connections between rows and data kinds.
May provide significant novel patterns, which might enhance the performance of ML/AI tasks.
Combines privacy protection with data usefulness.
By utilizing the advantages of domain-specific pre-trained models, NavFT expands on Gretel Navigator’s capabilities and makes it possible to create synthetic data that captures the subtleties of your particular data, such as the distributions and correlations for numeric, categorical, and other column types.
Using the de-identified data from Part 1, it will refine a Gretel model in this example.
Step 1: Make a model better:
# Display the full report within this notebooktrain_results.report.display_in_notebook()
Step 2: Retrieve the Quality Report for Gretel Synthetic Data.
Step 3: Create synthetic data using the optimized model, assess the privacy and quality of the data, and then publish the results back to a BQ table.
A few things to note about the synthetic data:
Semantically accurate, the different modalities (free text, JSON structures) are completely synthetic and retained.
The data are grouped by patient during creation due to the group-by/order-by hyperparameters that were used during fine-tuning.
How to use BigQuery with Gretel
This technical manual offers a starting point for creating and using synthetic data using Gretel AI and BigQuery DataFrame. You may use the potential of synthetic data to improve your data science, analytics, and artificial intelligence development processes while maintaining data privacy and compliance by examining the Gretel documentation and using these examples.
Read more on Govindhtech.com
#BigQueryDataFrame#DataFrame#Gretel#AI#ML#Python#SyntheticData#cloudcomputing#BigQuery#News#Technews#Technology#Technologynews#Technologytrends#govindhtech
0 notes
Text
What is the use of learning the Python language?
Python has become a commodity tool for data scientists because of its simplicity and readability along with myriad libraries. Following are some fundamental reasons behind learning Python and its essentials in data science learning:
1. Complete Data Science Libraries
NumPy: The efficiency in numerical operations on arrays and matrices is unparalleled, which is definitely indispensable for data manipulation and analysis.
Pandas: Provides powerful data structures like DataFrames to handle and clean structured data.
Scikit-learn: A complete library of machine learning algorithms including classification, regression, clustering, and many more.
Matplotlib: Plots, histograms, scatter plots, among others, for studying the data by visualization.
Seaborn: Built on top of Matplotlib, it provides a high-level interface for statistical visualizations.
TensorFlow: The most used deep learning framework to build and train neural networks. PyTorch: Deep learning framework; perhaps more flexible with a dynamic computation graph.
2. Readability and Simplicity
Python, with its clean syntax and readability emphasis, becomes quite easy for the learners to learn and understand even for the first time. This very simplicity cuts down on debugging time so that a data scientist can spend more time on problem solving and analysis.
3. Versatility and Integration
Python is not only used in data science; rather, it has uses in web development, automation, scientific computing, and a lot more.
The reason being, this versatility extends the capability to integrate well with other tools and systems involved in a data science workflow.
4. Large and Active Community
Python has an enormous active community of developers; hence, ample resources, tutorials, and forums for support.
The community promotes collaboration and sharing; hence, making it easier to learn and solve problems.
5. Career Opportunities
Python, being a much-sought-after skill in the data science industry,.
Learning Python opens completely new frontiers of career opportunities, ranging from data scientist and machine learning engineer to data analyst, and many others.
Finally, the powerful libraries, readability, versatility, and great community of Python turn it into the essential instrument for any data scientist. You will be perfectly prepared to perform any kind of data-driven challenge and get a head in your future career.
0 notes
Text
Pandas DataFrame Data Manipulation
Make the most of your data by using Python's Pandas DataFrame. This tutorial provides a comprehensive overview of data manipulation methods with Pandas, the robust data analysis toolkit. Discover effective methods for managing, purifying, and transforming data so that it is prepared for analysis. Gain proficiency with fundamental data operations like as grouping, filtering, merging, and pivoting within an intuitive DataFrame structure. With the help of real-world examples and comprehensive tutorials, you'll learn how to handle complicated data transformations with ease. This resource is ideal for data scientists, analysts, and anybody else who wants to improve their data processing skills. It will help you become a more proficient data handler.
0 notes
Text
How to Add Column to DataFrame in Python Pandas | Python Pandas Tutorial for Beginners
via IFTTT
youtube
View On WordPress
#coding#computer science#india#information technology#learning#online#programming#Python#teaching#tutorial#Youtube
0 notes