#python dataframe basics
Explore tagged Tumblr posts
Visit Tumblr Blog
Explore Tumblr blogs with no restrictions, modern design and the best experience.
Last Seen Tumblr Blogs


Fun Fact
US Tumblr user growth rate is estimated to slow down to 4.1%.
Text
DataFrame in Pandas: Guide to Creating Awesome DataFrames
Explore how to create a dataframe in Pandas, including data input methods, customization options, and practical examples.
Data analysis used to be a daunting task, reserved for statisticians and mathematicians. But with the rise of powerful tools like Python and its fantastic library, Pandas, anyone can become a data whiz! Pandas, in particular, shines with its DataFrames, these nifty tables that organize and manipulate data like magic. But where do you start? Fear not, fellow data enthusiast, for this guide will…
View On WordPress
#advanced dataframe features#aggregating data in pandas#create dataframe from dictionary in pandas#create dataframe from list in pandas#create dataframe in pandas#data manipulation in pandas#dataframe indexing#filter dataframe by condition#filter dataframe by multiple conditions#filtering data in pandas#grouping data in pandas#how to make a dataframe in pandas#manipulating data in pandas#merging dataframes#pandas data structures#pandas dataframe tutorial#python dataframe basics#rename columns in pandas dataframe#replace values in pandas dataframe#select columns in pandas dataframe#select rows in pandas dataframe#set column names in pandas dataframe#set row names in pandas dataframe
0 notes
Text
dreamdoll watchlist ★
youtube
key takeaways:
python is a good beginning coding language to start with
start with: variables, datatypes, loops, functions, if statements, oop
if you covered the basics, it would and should take you approx. 2 weeks.
first project: do something interesting/useful. start small.
simple games or a food recommendation system with specific ingredients
panda dataframe
use API = application programming interface = different pieces of software interacting with each other. grabbing data from another source
after your first project, learn about data structures and algorithms. how API works. learn how to read documentation.
dictionary
linkedlists
queues
heaps
trees
graphs
learn about more things and how to implement them into projects.
correct mindset:
implementation and application > theory and concepts knowing ≠ being able to do it
stay curious.
explore things outside of what is prescribed in a resource. that's how you learn about different concepts and how you deeply understand the concepts that you already know.
the best programmers they've met are the tinkers. these are the people who play around with their code and try a bunch of different things.
getting stuck:
it all comes down to problem solving. be comfortable with not knowing things and staying calm while trying to figure out the problems
how to learn even faster:
find a community where you work on projects together. you will learn so many things from other experiences programmers just by interacting with them. and accountability because you just can't give up
learning is never ending. you will always be learning something new.
12 notes
·
View notes
Text
How much Python should one learn before beginning machine learning?
Before diving into machine learning, a solid understanding of Python is essential. :

Basic Python Knowledge:
Syntax and Data Types:
Understand Python syntax, basic data types (strings, integers, floats), and operations.
Control Structures:
Learn how to use conditionals (if statements), loops (for and while), and list comprehensions.
Data Handling Libraries:
Pandas:
Familiarize yourself with Pandas for data manipulation and analysis. Learn how to handle DataFrames, series, and perform data cleaning and transformations.
NumPy:
Understand NumPy for numerical operations, working with arrays, and performing mathematical computations.
Data Visualization:
Matplotlib and Seaborn:
Learn basic plotting with Matplotlib and Seaborn for visualizing data and understanding trends and distributions.
Basic Programming Concepts:
Functions:
Know how to define and use functions to create reusable code.
File Handling:
Learn how to read from and write to files, which is important for handling datasets.
Basic Statistics:
Descriptive Statistics:
Understand mean, median, mode, standard deviation, and other basic statistical concepts.
Probability:
Basic knowledge of probability is useful for understanding concepts like distributions and statistical tests.
Libraries for Machine Learning:
Scikit-learn:
Get familiar with Scikit-learn for basic machine learning tasks like classification, regression, and clustering. Understand how to use it for training models, evaluating performance, and making predictions.
Hands-on Practice:
Projects:
Work on small projects or Kaggle competitions to apply your Python skills in practical scenarios. This helps in understanding how to preprocess data, train models, and interpret results.
In summary, a good grasp of Python basics, data handling, and basic statistics will prepare you well for starting with machine learning. Hands-on practice with machine learning libraries and projects will further solidify your skills.
To learn more drop the message…!
2 notes
·
View notes
Text
How you can use python for data wrangling and analysis
Python is a powerful and versatile programming language that can be used for various purposes, such as web development, data science, machine learning, automation, and more. One of the most popular applications of Python is data analysis, which involves processing, cleaning, manipulating, and visualizing data to gain insights and make decisions.
In this article, we will introduce some of the basic concepts and techniques of data analysis using Python, focusing on the data wrangling and analysis process. Data wrangling is the process of transforming raw data into a more suitable format for analysis, while data analysis is the process of applying statistical methods and tools to explore, summarize, and interpret data.
To perform data wrangling and analysis with Python, we will use two of the most widely used libraries: Pandas and NumPy. Pandas is a library that provides high-performance data structures and operations for manipulating tabular data, such as Series and DataFrame. NumPy is a library that provides fast and efficient numerical computations on multidimensional arrays, such as ndarray.
We will also use some other libraries that are useful for data analysis, such as Matplotlib and Seaborn for data visualization, SciPy for scientific computing, and Scikit-learn for machine learning.
To follow along with this article, you will need to have Python 3.6 or higher installed on your computer, as well as the libraries mentioned above. You can install them using pip or conda commands. You will also need a code editor or an interactive environment, such as Jupyter Notebook or Google Colab.
Let’s get started with some examples of data wrangling and analysis with Python.
Example 1: Analyzing COVID-19 Data
In this example, we will use Python to analyze the COVID-19 data from the World Health Organization (WHO). The data contains the daily situation reports of confirmed cases and deaths by country from January 21, 2020 to October 23, 2023. You can download the data from here.
First, we need to import the libraries that we will use:import pandas as pd import numpy as np import matplotlib.pyplot as plt import seaborn as sns
Next, we need to load the data into a Pandas DataFrame:df = pd.read_csv('WHO-COVID-19-global-data.csv')
We can use the head() method to see the first five rows of the DataFrame:df.head()
Date_reportedCountry_codeCountryWHO_regionNew_casesCumulative_casesNew_deathsCumulative_deaths2020–01–21AFAfghanistanEMRO00002020–01–22AFAfghanistanEMRO00002020–01–23AFAfghanistanEMRO00002020–01–24AFAfghanistanEMRO00002020–01–25AFAfghanistanEMRO0000
We can use the info() method to see some basic information about the DataFrame, such as the number of rows and columns, the data types of each column, and the memory usage:df.info()
Output:
RangeIndex: 163800 entries, 0 to 163799 Data columns (total 8 columns): # Column Non-Null Count Dtype — — — — — — — — — — — — — — — 0 Date_reported 163800 non-null object 1 Country_code 162900 non-null object 2 Country 163800 non-null object 3 WHO_region 163800 non-null object 4 New_cases 163800 non-null int64 5 Cumulative_cases 163800 non-null int64 6 New_deaths 163800 non-null int64 7 Cumulative_deaths 163800 non-null int64 dtypes: int64(4), object(4) memory usage: 10.0+ MB “><class 'pandas.core.frame.DataFrame'> RangeIndex: 163800 entries, 0 to 163799 Data columns (total 8 columns): # Column Non-Null Count Dtype --- ------ -------------- ----- 0 Date_reported 163800 non-null object 1 Country_code 162900 non-null object 2 Country 163800 non-null object 3 WHO_region 163800 non-null object 4 New_cases 163800 non-null int64 5 Cumulative_cases 163800 non-null int64 6 New_deaths 163800 non-null int64 7 Cumulative_deaths 163800 non-null int64 dtypes: int64(4), object(4) memory usage: 10.0+ MB
We can see that there are some missing values in the Country_code column. We can use the isnull() method to check which rows have missing values:df[df.Country_code.isnull()]
Output:
Date_reportedCountry_codeCountryWHO_regionNew_casesCumulative_casesNew_deathsCumulative_deaths2020–01–21NaNInternational conveyance (Diamond Princess)WPRO00002020–01–22NaNInternational conveyance (Diamond Princess)WPRO0000……………………2023–10–22NaNInternational conveyance (Diamond Princess)WPRO07120132023–10–23NaNInternational conveyance (Diamond Princess)WPRO0712013
We can see that the missing values are from the rows that correspond to the International conveyance (Diamond Princess), which is a cruise ship that had a COVID-19 outbreak in early 2020. Since this is not a country, we can either drop these rows or assign them a unique code, such as ‘IC’. For simplicity, we will drop these rows using the dropna() method:df = df.dropna()
We can also check the data types of each column using the dtypes attribute:df.dtypes
Output:Date_reported object Country_code object Country object WHO_region object New_cases int64 Cumulative_cases int64 New_deaths int64 Cumulative_deaths int64 dtype: object
We can see that the Date_reported column is of type object, which means it is stored as a string. However, we want to work with dates as a datetime type, which allows us to perform date-related operations and calculations. We can use the to_datetime() function to convert the column to a datetime type:df.Date_reported = pd.to_datetime(df.Date_reported)
We can also use the describe() method to get some summary statistics of the numerical columns, such as the mean, standard deviation, minimum, maximum, and quartiles:df.describe()
Output:
New_casesCumulative_casesNew_deathsCumulative_deathscount162900.000000162900.000000162900.000000162900.000000mean1138.300062116955.14016023.4867892647.346237std6631.825489665728.383017137.25601215435.833525min-32952.000000–32952.000000–1918.000000–1918.00000025%-1.000000–1.000000–1.000000–1.00000050%-1.000000–1.000000–1.000000–1.00000075%-1.000000–1.000000–1.000000–1.000000max -1 -1 -1 -1
We can see that there are some negative values in the New_cases, Cumulative_cases, New_deaths, and Cumulative_deaths columns, which are likely due to data errors or corrections. We can use the replace() method to replace these values with zero:df = df.replace(-1,0)
Now that we have cleaned and prepared the data, we can start to analyze it and answer some questions, such as:
Which countries have the highest number of cumulative cases and deaths?
How has the pandemic evolved over time in different regions and countries?
What is the current situation of the pandemic in India?
To answer these questions, we will use some of the methods and attributes of Pandas DataFrame, such as:
groupby() : This method allows us to group the data by one or more columns and apply aggregation functions, such as sum, mean, count, etc., to each group.
sort_values() : This method allows us to sort the data by one or more
loc[] : This attribute allows us to select a subset of the data by labels or conditions.
plot() : This method allows us to create various types of plots from the data, such as line, bar, pie, scatter, etc.
If you want to learn Python from scratch must checkout e-Tuitions to learn Python online, They can teach you Python and other coding language also they have some of the best teachers for their students and most important thing you can also Book Free Demo for any class just goo and get your free demo.
#python#coding#programming#programming languages#python tips#python learning#python programming#python development
2 notes
·
View notes
Text
Python for Data Science: The Only Guide You Need to Get Started in 2025
Data is the lifeblood of modern business, powering decisions in healthcare, finance, marketing, sports, and more. And at the core of it all lies a powerful and beginner-friendly programming language — Python.
Whether you’re an aspiring data scientist, analyst, or tech enthusiast, learning Python for data science is one of the smartest career moves you can make in 2025.
In this guide, you’ll learn:
Why Python is the preferred language for data science
The libraries and tools you must master
A beginner-friendly roadmap
How to get started with a free full course on YouTube
Why Python is the #1 Language for Data Science
Python has earned its reputation as the go-to language for data science and here's why:
1. Easy to Learn, Easy to Use
Python’s syntax is clean, simple, and intuitive. You can focus on solving problems rather than struggling with the language itself.
2. Rich Ecosystem of Libraries
Python offers thousands of specialized libraries for data analysis, machine learning, and visualization.
3. Community and Resources
With a vibrant global community, you’ll never run out of tutorials, forums, or project ideas to help you grow.
4. Integration with Tools & Platforms
From Jupyter notebooks to cloud platforms like AWS and Google Colab, Python works seamlessly everywhere.
What You Can Do with Python in Data Science
Let’s look at real tasks you can perform using Python: TaskPython ToolsData cleaning & manipulationPandas, NumPyData visualizationMatplotlib, Seaborn, PlotlyMachine learningScikit-learn, XGBoostDeep learningTensorFlow, PyTorchStatistical analysisStatsmodels, SciPyBig data integrationPySpark, Dask
Python lets you go from raw data to actionable insight — all within a single ecosystem.
A Beginner's Roadmap to Learn Python for Data Science
If you're starting from scratch, follow this step-by-step learning path:
✅ Step 1: Learn Python Basics
Variables, data types, loops, conditionals
Functions, file handling, error handling
✅ Step 2: Explore NumPy
Arrays, broadcasting, numerical computations
✅ Step 3: Master Pandas
DataFrames, filtering, grouping, merging datasets
✅ Step 4: Visualize with Matplotlib & Seaborn
Create charts, plots, and visual dashboards
✅ Step 5: Intro to Machine Learning
Use Scikit-learn for classification, regression, clustering
✅ Step 6: Work on Real Projects
Apply your knowledge to real-world datasets (Kaggle, UCI, etc.)
Who Should Learn Python for Data Science?
Python is incredibly beginner-friendly and widely used, making it ideal for:
Students looking to future-proof their careers
Working professionals planning a transition to data
Analysts who want to automate and scale insights
Researchers working with data-driven models
Developers diving into AI, ML, or automation
How Long Does It Take to Learn?
You can grasp Python fundamentals in 2–3 weeks with consistent daily practice. To become proficient in data science using Python, expect to spend 3–6 months, depending on your pace and project experience.
The good news? You don’t need to do it alone.
🎓 Learn Python for Data Science – Full Free Course on YouTube
We’ve put together a FREE, beginner-friendly YouTube course that covers everything you need to start your data science journey using Python.
📘 What You’ll Learn:
Python programming basics
NumPy and Pandas for data handling
Matplotlib for visualization
Scikit-learn for machine learning
Real-life datasets and projects
Step-by-step explanations
📺 Watch the full course now → 👉 Python for Data Science Full Course
You’ll walk away with job-ready skills and project experience — at zero cost.
🧭 Final Thoughts
Python isn’t just a programming language — it’s your gateway to the future.
By learning Python for data science, you unlock opportunities across industries, roles, and technologies. The demand is high, the tools are ready, and the learning path is clearer than ever.
Don’t let analysis paralysis hold you back.
Click here to start learning now → https://youtu.be/6rYVt_2q_BM
#PythonForDataScience #LearnPython #FreeCourse #DataScience2025 #MachineLearning #NumPy #Pandas #DataAnalysis #AI #ScikitLearn #UpskillNow
1 note
·
View note
Text
Python for Data Science: Libraries You Must Know
Python has become the go-to programming language for data science professionals due to its readability, extensive community support, and a rich ecosystem of libraries. Whether you're analyzing data, building machine learning models, or creating stunning visualizations, Python has the right tools to get the job done. If you're looking to start a career in this field, enrolling in the best Python training in Hyderabad can give you a competitive edge and help you master these crucial libraries.
1. NumPy – The Foundation of Numerical Computing
NumPy is the backbone of scientific computing with Python. It offers efficient storage and manipulation of large numerical arrays, which makes it indispensable for high-performance data analysis. NumPy arrays are faster and more compact than traditional Python lists and serve as the foundation for other data science libraries.
2. Pandas – Data Wrangling Made Simple
Pandas is essential for handling structured data. Data structures such as Series and DataFrame make it easy to clean, transform, and explore data. With Pandas, tasks like filtering rows, merging datasets, and grouping values become effortless, saving time and effort in data preprocessing.
3. Matplotlib and Seaborn – Data Visualization Powerhouses
Matplotlib is the standard library for creating basic to advanced data visualizations. From bar graphs to histograms and line charts, Matplotlib covers it all. For more visually appealing and statistically rich plots, Seaborn is an excellent choice. It simplifies the process of creating complex plots and provides a more aesthetically pleasing design.
4. Scikit-learn – Machine Learning Made Easy
In Python, Scikit-learn is one of the most widely used libraries for implementing machine learning algorithms. It provides easy-to-use functions for classification, regression, clustering, and model evaluation, making it ideal for both beginners and experts.
5. TensorFlow and PyTorch – Deep Learning Frameworks
For those diving into artificial intelligence and deep learning, TensorFlow and PyTorch are essential. These frameworks allow developers to create, train, and deploy neural networks for applications such as image recognition, speech processing, and natural language understanding.
Begin Your Data Science Journey with Expert Training
Mastering these libraries opens the door to countless opportunities in the data science field. To gain hands-on experience and real-world skills, enroll in SSSIT Computer Education, where our expert trainers provide industry-relevant, practical Python training tailored for aspiring data scientists in Hyderabad.
#best python training in hyderabad#best python training in kukatpally#best python training in KPHB#Kukatpally & KPHB
0 notes
Text
Unlock Your Coding Potential: Mastering Python, Pandas, and NumPy for Absolute Beginners
Ever thought learning programming was out of your reach? You're not alone. Many beginners feel overwhelmed when they first dive into the world of code. But here's the good news — Python, along with powerful tools like Pandas and NumPy, makes it easier than ever to start your coding journey. And yes, you can go from zero to confident coder without a tech degree or prior experience.
Let’s explore why Python is the best first language to learn, how Pandas and NumPy turn you into a data powerhouse, and how you can get started right now — even if you’ve never written a single line of code.
Why Python is the Ideal First Language for Beginners
Python is known as the "beginner's language" for a reason. Its syntax is simple, readable, and intuitive — much closer to plain English than other programming languages.
Whether you're hoping to build apps, automate your work, analyze data, or explore machine learning, Python is the gateway to all of it. It powers Netflix’s recommendation engine, supports NASA's simulations, and helps small businesses automate daily tasks.
Still unsure if it’s the right pick? Here’s what makes Python a no-brainer:
Simple to learn, yet powerful
Used by professionals across industries
Backed by a massive, helpful community
Endless resources and tools to learn from
And when you combine Python with NumPy and Pandas, you unlock the true magic of data analysis and manipulation.
The Power of Pandas and NumPy in Data Science
Let’s break it down.
🔹 What is NumPy?
NumPy (short for “Numerical Python”) is a powerful library that makes mathematical and statistical operations lightning-fast and incredibly efficient.
Instead of using basic Python lists, NumPy provides arrays that are more compact, faster, and capable of performing complex operations in just a few lines of code.
Use cases:
Handling large datasets
Performing matrix operations
Running statistical analysis
Working with machine learning algorithms
🔹 What is Pandas?
If NumPy is the engine, Pandas is the dashboard. Built on top of NumPy, Pandas provides dataframes — 2D tables that look and feel like Excel spreadsheets but offer the power of code.
With Pandas, you can:
Load data from CSV, Excel, SQL, or JSON
Filter, sort, and group your data
Handle missing or duplicate data
Perform data cleaning and transformation
Together, Pandas and NumPy give you superpowers to manage, analyze, and visualize data in ways that are impossible with Excel alone.
The Beginner’s Journey: Where to Start?
You might be wondering — “This sounds amazing, but how do I actually learn all this?”
That’s where the Mastering Python, Pandas, NumPy for Absolute Beginners course comes in. This beginner-friendly course is designed specifically for non-techies and walks you through everything you need to know — from setting up Python to using Pandas like a pro.
No prior coding experience? Perfect. That’s exactly who this course is for.
You’ll learn:
The fundamentals of Python: variables, loops, functions
How to use NumPy for array operations
Real-world data cleaning and analysis using Pandas
Building your first data project step-by-step
And because it’s self-paced and online, you can learn anytime, anywhere.
Real-World Examples: How These Tools Are Used Every Day
Learning Python, Pandas, and NumPy isn’t just for aspiring data scientists. These tools are used across dozens of industries:
1. Marketing
Automate reports, analyze customer trends, and predict buying behavior using Pandas.
2. Finance
Calculate risk models, analyze stock data, and create forecasting models with NumPy.
3. Healthcare
Track patient data, visualize health trends, and conduct research analysis.
4. Education
Analyze student performance, automate grading, and track course engagement.
5. Freelancing/Side Projects
Scrape data from websites, clean it up, and turn it into insights — all with Python.
Whether you want to work for a company or freelance on your own terms, these skills give you a serious edge.
Learning at Your Own Pace — Without Overwhelm
One of the main reasons beginners give up on coding is because traditional resources jump into complex topics too fast.
But the Mastering Python, Pandas, NumPy for Absolute Beginners course is designed to be different. It focuses on real clarity and hands-on practice — no fluff, no overwhelming jargon.
What you get:
Short, focused video lessons
Real-world datasets to play with
Assignments and quizzes to test your knowledge
Certificate of completion
It’s like having a patient mentor guiding you every step of the way.
Here’s What You’ll Learn Inside the Course
Let’s break it down:
✅ Python Essentials
Understanding variables, data types, and functions
Writing conditional logic and loops
Working with files and exceptions
✅ Mastering NumPy
Creating and manipulating arrays
Broadcasting and vectorization
Math and statistical operations
✅ Data Analysis with Pandas
Reading and writing data from various formats
Cleaning and transforming messy data
Grouping, aggregating, and pivoting data
Visualizing insights using built-in methods
By the end, you won’t just “know Python” — you’ll be able to do things with it. Solve problems, build projects, and impress employers.
Why This Skillset Is So In-Demand Right Now
Python is the most popular programming language in the world right now — and for good reason. Tech giants like Google, Netflix, Facebook, and NASA use it every day.
But here’s what most people miss: It’s not just about tech jobs. Knowing how to manipulate and understand data is now a core skill across marketing, operations, HR, journalism, and more.
According to LinkedIn and Glassdoor:
Python is one of the most in-demand skills in 2025
Data analysis is now required in 70% of digital roles
Entry-level Python developers earn an average of $65,000 to $85,000/year
When you combine Python with Pandas and NumPy, you make yourself irresistible to hiring managers and clients.
What Students Are Saying
People just like you have used this course to kickstart their tech careers, land internships, or even launch freelance businesses.
Here’s what learners love about it:
“The lessons were beginner-friendly and not overwhelming.”
“The Pandas section helped me automate weekly reports at my job!”
“I didn’t believe I could learn coding, but this course proved me wrong.”
What You’ll Be Able to Do After the Course
By the time you complete Mastering Python, Pandas, NumPy for Absolute Beginners, you’ll be able to:
Analyze data using Pandas and Python
Perform advanced calculations using NumPy arrays
Clean, organize, and visualize messy datasets
Build mini-projects that show your skills
Apply for jobs or gigs with confidence
It’s not about becoming a “coder.” It’s about using the power of Python to make your life easier, your work smarter, and your skills future-proof.
Final Thoughts: This Is Your Gateway to the Future
Everyone starts somewhere.
And if you’re someone who has always felt curious about tech but unsure where to begin — this is your sign.
Python, Pandas, and NumPy aren’t just tools — they’re your entry ticket to a smarter career, side income, and creative freedom.
Ready to get started?
👉 Click here to dive into Mastering Python, Pandas, NumPy for Absolute Beginners and take your first step into the coding world. You’ll be amazed at what you can build.
0 notes
Text
From List to Data: A Beginner’s Guide to Data Transformation
In today’s data-driven world, transforming raw information into structured formats is a critical skill. One common task in data processing is converting a list—a simple, unstructured sequence of values—into structured data that can be analyzed, visualized, or stored. A “list” might be a shopping list, a sequence of names, or numbers collected from user inputs. “Data,” in contrast, refers to a structured format such as a table, database, or dataset. The goal of transforming a list to data is to make it usable for insights, automation, or further manipulation. Understanding this process helps beginners make sense of how information is organized in software systems, spreadsheets, or databases. It’s not just a programming task—it’s a foundational part of digital literacy.
Why Converting Lists to Data Matters
Lists are everywhere: in text files, spreadsheets, form submissions, or even copied from emails. But these lists often need structure before they can be used. Structured data can be sorted, filtered, analyzed, or even turned into charts. For example, if you receive a list of customer names and purchases, it’s just raw text until it’s organized into phone number data and columns—where each row is a customer and each column is a data point like name, item, or price. Without this transformation, automation tools, machine learning models, or even basic Excel functions can’t work effectively. Converting lists to structured data enables better decisions, reporting, and scaling of workflows.

Simple Tools for List-to-Data Conversion
You don’t need to be a coder to transform lists into data. Tools like Microsoft Excel, Google Sheets, or Notepad++ make this easy. For example, using the "Text to Columns" feature in Excel, you can split list items into cells. In Google Sheets, functions like SPLIT() and ARRAYFORMULA() help break down and reorganize text. Online tools like CSV converters also turn lists into structured CSV files. These steps make it easier for users to handle raw data without complex scripts. Beginners can start with drag-and-drop interfaces and learn basic data formatting.
Moving Beyond Basics: Automation with Python and Scripts
Once you’re comfortable with basic tools, learning to automate list-to-data conversions with scripting languages like Python is a powerful next step. Python libraries such as pandas make it simple to import a list from a file and convert it into a DataFrame—a table-like data structure. For example, if you have a list stored in a .txt file, Python can read it, parse it using string functions, and format it into rows and columns automatically. This is especially useful when handling large or repetitive data. Automating the process not only saves time but also reduces human error. It opens the door to building entire data pipelines, integrating APIs, or performing advanced analysis.
0 notes
Text
Processing Big Data with Python: A Dask Tutorial
Step-by-Step Guide to Processing Big Data with Dask in Python 1. Environment Setup First, install the necessary packages using pip: pip install dask dask-distributed bokeh datashader 2. Basic Dask DataFrame Usage Load a JSON file into a Dask DataFrame and perform basic operations: import dask.dataframe as dd import os # Set a temporary directory for spilling to disk if…
0 notes
Text
PySpark SQL: Introduction & Basic Queries
Introduction
In today’s data-driven world, the volume and variety of data have exploded. Traditional tools often struggle to process and analyze massive datasets efficiently. That’s where Apache Spark comes into the picture — a lightning-fast, unified analytics engine for big data processing.
For Python developers, PySpark — the Python API for Apache Spark — offers an intuitive way to work with Spark. Among its powerful modules, PySpark SQL stands out. It enables you to query structured data using SQL syntax or DataFrame operations. This hybrid capability makes it easy to blend the power of Spark with the familiarity of SQL.
In this blog, we'll explore what PySpark SQL is, why it’s so useful, how to set it up, and cover the most essential SQL queries with examples — perfect for beginners diving into big data with Python.
Agenda
Here's what we'll cover:
What is PySpark SQL?
Why should you use PySpark SQL?
Installing and setting up PySpark
Basic SQL queries in PySpark
Best practices for working efficiently
Final thoughts
What is PySpark SQL?
PySpark SQL is a module of Apache Spark that enables querying structured data using SQL commands or a more programmatic DataFrame API. It offers:
Support for SQL-style queries on large datasets.
A seamless bridge between relational logic and Python.
Optimizations using the Catalyst query optimizer and Tungsten execution engine for efficient computation.
In simple terms, PySpark SQL lets you use SQL to analyze big data at scale — without needing traditional database systems.
Why Use PySpark SQL?
Here are a few compelling reasons to use PySpark SQL:
Scalability: It can handle terabytes of data spread across clusters.
Ease of use: Combines the simplicity of SQL with the flexibility of Python.
Performance: Optimized query execution ensures fast performance.
Interoperability: Works with various data sources — including Hive, JSON, Parquet, and CSV.
Integration: Supports seamless integration with DataFrames and MLlib for machine learning.
Whether you're building dashboards, ETL pipelines, or machine learning workflows — PySpark SQL is a reliable choice.
Setting Up PySpark
Let’s quickly set up a local PySpark environment.
1. Install PySpark:
pip install pyspark
2. Start a Spark session:
from pyspark.sql import SparkSession spark = SparkSession.builder \ .appName("PySparkSQLExample") \ .getOrCreate()
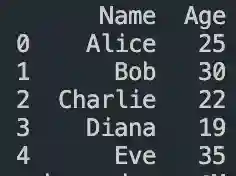
3. Create a DataFrame:
data = [("Alice", 25), ("Bob", 30), ("Clara", 35)] columns = ["Name", "Age"] df = spark.createDataFrame(data, columns) df.show()
4. Create a temporary view to run SQL queries:
df.createOrReplaceTempView("people")
Now you're ready to run SQL queries directly!
Basic PySpark SQL Queries
Let’s look at the most commonly used SQL queries in PySpark.
1. SELECT Query
spark.sql("SELECT * FROM people").show()
Returns all rows from the people table.
2. WHERE Clause (Filtering Rows)
spark.sql("SELECT * FROM people WHERE Age > 30").show()
Filters rows where Age is greater than 30.
3. Adding a Derived Column
spark.sql("SELECT Name, Age, Age + 5 AS AgeInFiveYears FROM people").show()
Adds a new column AgeInFiveYears by adding 5 to the current age.
4. GROUP BY and Aggregation
Let’s update the data with multiple entries for each name:
data2 = [("Alice", 25), ("Bob", 30), ("Alice", 28), ("Bob", 35), ("Clara", 35)] df2 = spark.createDataFrame(data2, columns) df2.createOrReplaceTempView("people")
Now apply aggregation:
spark.sql(""" SELECT Name, COUNT(*) AS Count, AVG(Age) AS AvgAge FROM people GROUP BY Name """).show()
This groups records by Name and calculates the number of records and average age.
5. JOIN Between Two Tables
Let’s create another table:
jobs_data = [("Alice", "Engineer"), ("Bob", "Designer"), ("Clara", "Manager")] df_jobs = spark.createDataFrame(jobs_data, ["Name", "Job"]) df_jobs.createOrReplaceTempView("jobs")
Now perform an inner join:
spark.sql(""" SELECT p.Name, p.Age, j.Job FROM people p JOIN jobs j ON p.Name = j.Name """).show()
This joins the people and jobs tables on the Name column.
Tips for Working Efficiently with PySpark SQL
Use LIMIT for testing: Avoid loading millions of rows in development.
Cache wisely: Use .cache() when a DataFrame is reused multiple times.
Check performance: Use .explain() to view the query execution plan.
Mix APIs: Combine SQL queries and DataFrame methods for flexibility.
Conclusion
PySpark SQL makes big data analysis in Python much more accessible. By combining the readability of SQL with the power of Spark, it allows developers and analysts to process massive datasets using simple, familiar syntax.
This blog covered the foundational aspects: setting up PySpark, writing basic SQL queries, performing joins and aggregations, and a few best practices to optimize your workflow.
If you're just starting out, keep experimenting with different queries, and try loading real-world datasets in formats like CSV or JSON. Mastering PySpark SQL can unlock a whole new level of data engineering and analysis at scale.
PySpark Training by AccentFuture
At AccentFuture, we offer customizable online training programs designed to help you gain practical, job-ready skills in the most in-demand technologies. Our PySpark Online Training will teach you everything you need to know, with hands-on training and real-world projects to help you excel in your career.
What we offer:
Hands-on training with real-world projects and 100+ use cases
Live sessions led by industry professionals
Certification preparation and career guidance
🚀 Enroll Now: https://www.accentfuture.com/enquiry-form/
📞 Call Us: +91–9640001789
📧 Email Us: [email protected]
🌐 Visit Us: AccentFuture
1 note
·
View note
Text
Pandas DataFrame Tutorial: Ways to Create and Manipulate Data in Python Are you diving into data analysis with Python? Then you're about to become best friends with pandas DataFrames. These powerful, table-like structures are the backbone of data manipulation in Python, and knowing how to create them is your first step toward becoming a data analysis expert. In this comprehensive guide, we'll explore everything you need to know about creating pandas DataFrames, from basic methods to advanced techniques. Whether you're a beginner or looking to level up your skills, this tutorial has got you covered. Getting Started with Pandas Before we dive in, let's make sure you have everything set up. First, you'll need to install pandas if you haven't already: pythonCopypip install pandas Then, import pandas in your Python script: pythonCopyimport pandas as pd 1. Creating a DataFrame from Lists The simplest way to create a DataFrame is using Python lists. Here's how: pythonCopy# Creating a basic DataFrame from lists data = 'name': ['John', 'Emma', 'Alex', 'Sarah'], 'age': [28, 24, 32, 27], 'city': ['New York', 'London', 'Paris', 'Tokyo'] df = pd.DataFrame(data) print(df) This creates a clean, organized table with your data. The keys in your dictionary become column names, and the values become the data in each column. 2. Creating a DataFrame from NumPy Arrays When working with numerical data, NumPy arrays are your friends: pythonCopyimport numpy as np # Creating a DataFrame from a NumPy array array_data = np.random.rand(4, 3) df_numpy = pd.DataFrame(array_data, columns=['A', 'B', 'C'], index=['Row1', 'Row2', 'Row3', 'Row4']) print(df_numpy) 3. Reading Data from External Sources Real-world data often comes from files. Here's how to create DataFrames from different file formats: pythonCopy# CSV files df_csv = pd.read_csv('your_file.csv') # Excel files df_excel = pd.read_excel('your_file.xlsx') # JSON files df_json = pd.read_json('your_file.json') 4. Creating a DataFrame from a List of Dictionaries Sometimes your data comes as a list of dictionaries, especially when working with APIs: pythonCopy# List of dictionaries records = [ 'name': 'John', 'age': 28, 'department': 'IT', 'name': 'Emma', 'age': 24, 'department': 'HR', 'name': 'Alex', 'age': 32, 'department': 'Finance' ] df_records = pd.DataFrame(records) print(df_records) 5. Creating an Empty DataFrame Sometimes you need to start with an empty DataFrame and fill it later: pythonCopy# Create an empty DataFrame with defined columns columns = ['Name', 'Age', 'City'] df_empty = pd.DataFrame(columns=columns) # Add data later new_row = 'Name': 'Lisa', 'Age': 29, 'City': 'Berlin' df_empty = df_empty.append(new_row, ignore_index=True) 6. Advanced DataFrame Creation Techniques Using Multi-level Indexes pythonCopy# Creating a DataFrame with multi-level index arrays = [ ['2023', '2023', '2024', '2024'], ['Q1', 'Q2', 'Q1', 'Q2'] ] data = 'Sales': [100, 120, 150, 180] df_multi = pd.DataFrame(data, index=arrays) print(df_multi) Creating Time Series DataFrames pythonCopy# Creating a time series DataFrame dates = pd.date_range('2024-01-01', periods=6, freq='D') df_time = pd.DataFrame(np.random.randn(6, 4), index=dates, columns=['A', 'B', 'C', 'D']) Best Practices and Tips Always Check Your Data Types pythonCopy# Check data types of your DataFrame print(df.dtypes) Set Column Names Appropriately Use clear, descriptive column names without spaces: pythonCopydf.columns = ['first_name', 'last_name', 'email'] Handle Missing Data pythonCopy# Check for missing values print(df.isnull().sum()) # Fill missing values df.fillna(0, inplace=True) Common Pitfalls to Avoid Memory Management: Be cautious with large datasets. Use appropriate data types to minimize memory usage:
pythonCopy# Optimize numeric columns df['integer_column'] = df['integer_column'].astype('int32') Copy vs. View: Understand when you're creating a copy or a view: pythonCopy# Create a true copy df_copy = df.copy() Conclusion Creating pandas DataFrames is a fundamental skill for any data analyst or scientist working with Python. Whether you're working with simple lists, complex APIs, or external files, pandas provides flexible and powerful ways to structure your data. Remember to: Choose the most appropriate method based on your data source Pay attention to data types and memory usage Use clear, consistent naming conventions Handle missing data appropriately With these techniques in your toolkit, you're well-equipped to handle any data manipulation task that comes your way. Practice with different methods and explore the pandas documentation for more advanced features as you continue your data analysis journey. Additional Resources Official pandas documentation Pandas cheat sheet Python for Data Science Handbook Real-world pandas examples on GitHub Now you're ready to start creating and manipulating DataFrames like a pro. Happy coding!
0 notes
Text
Level Up Data Science Skills with Python: A Full Guide
Data science is one of the most in-demand careers in the world today, and Python is its go-to language. Whether you're just starting out or looking to sharpen your skills, mastering Python can open doors to countless opportunities in data analytics, machine learning, artificial intelligence, and beyond.
In this guide, we’ll explore how Python can take your data science abilities to the next level—covering core concepts, essential libraries, and practical tips for real-world application.
Why Python for Data Science?
Python’s popularity in data science is no accident. It’s beginner-friendly, versatile, and has a massive ecosystem of libraries and tools tailored specifically for data work. Here's why it stands out:
Clear syntax simplifies learning and ensures easier maintenance.
Community support means constant updates and rich documentation.
Powerful libraries for everything from data manipulation to visualization and machine learning.
Core Python Concepts Every Data Scientist Should Know
Establish a solid base by thoroughly understanding the basics before advancing to more complex methods:
Variables and Data Types: Get familiar with strings, integers, floats, lists, and dictionaries.
Control Flow: Master if-else conditions, for/while loops, and list comprehensions through practice.
Functions and Modules: Understand how to create reusable code by defining functions.
File Handling: Leverage built-in functions to handle reading from and writing to files.
Error Handling: Use try-except blocks to write robust programs.
Mastering these foundations ensures you can write clean, efficient code—critical for working with complex datasets.
Must-Know Python Libraries for Data Science
Once you're confident with Python basics, it’s time to explore the libraries that make data science truly powerful:
NumPy: For numerical operations and array manipulation. It forms the essential foundation for a wide range of data science libraries.
Pandas: Used for data cleaning, transformation, and analysis. DataFrames are essential for handling structured data.
Matplotlib & Seaborn: These libraries help visualize data. While Matplotlib gives you control, Seaborn makes it easier with beautiful default styles.
Scikit-learn: Perfect for building machine learning models. Features algorithms for tasks like classification, regression, clustering, and additional methods.
TensorFlow & PyTorch: For deep learning and neural networks. Choose one based on your project needs and personal preference.
Real-World Projects to Practice
Applying what you’ve learned through real-world projects is key to skill development. Here are a few ideas:
Data Cleaning Challenge: Work with messy datasets and clean them using Pandas.
Exploratory Data Analysis (EDA): Analyze a dataset, find patterns, and visualize results.
Build a Machine Learning Model: Use Scikit-learn to create a prediction model for housing prices, customer churn, or loan approval.
Sentiment Analysis: Use natural language processing (NLP) to analyze product reviews or tweets.
Completing these projects can enhance your portfolio and attract the attention of future employers.
Tips to Accelerate Your Learning
Join online courses and bootcamps: Join Online Platforms
Follow open-source projects on GitHub: Contribute to or learn from real codebases.
Engage with the community: Join forums like Stack Overflow or Reddit’s r/datascience.
Read documentation and blogs: Keep yourself informed about new features and optimal practices.
Set goals and stay consistent: Data science is a long-term journey, not a quick race.
Python is the cornerstone of modern data science. Whether you're manipulating data, building models, or visualizing insights, Python equips you with the tools to succeed. By mastering its fundamentals and exploring its powerful libraries, you can confidently tackle real-world data challenges and elevate your career in the process. If you're looking to sharpen your skills, enrolling in a Python course in Gurgaon can be a great way to get expert guidance and hands-on experience.
DataMites Institute stands out as a top international institute providing in-depth education in data science, AI, and machine learning. We provide expert-led courses designed for both beginners and professionals aiming to boost their careers.
Python vs R - What is the Difference, Pros and Cons
youtube
#python course#python training#python institute#learnpython#python#pythoncourseingurgaon#pythoncourseinindia#Youtube
0 notes
Text
Getting Started with Data Analysis Using Python

Data analysis is a critical skill in today’s data-driven world. Whether you're exploring business insights or conducting academic research, Python offers powerful tools for data manipulation, visualization, and reporting. In this post, we’ll walk through the essentials of data analysis using Python, and how you can begin analyzing real-world data effectively.
Why Python for Data Analysis?
Easy to Learn: Python has a simple and readable syntax.
Rich Ecosystem: Extensive libraries like Pandas, NumPy, Matplotlib, and Seaborn.
Community Support: A large, active community providing tutorials, tools, and resources.
Scalability: Suitable for small scripts or large-scale machine learning pipelines.
Essential Python Libraries for Data Analysis
Pandas: Data manipulation and analysis using DataFrames.
NumPy: Fast numerical computing and array operations.
Matplotlib: Basic plotting and visualizations.
Seaborn: Advanced and beautiful statistical plots.
Scikit-learn: Machine learning and data preprocessing tools.
Step-by-Step: Basic Data Analysis Workflow
1. Import Libraries
import pandas as pd import numpy as np import matplotlib.pyplot as plt import seaborn as sns
2. Load Your Dataset
df = pd.read_csv('data.csv') # Replace with your file path print(df.head())
3. Clean and Prepare Data
df.dropna(inplace=True) # Remove missing values df['Category'] = df['Category'].astype('category') # Convert to category type
4. Explore Data
print(df.describe()) # Summary statistics print(df.info()) # Data types and memory usage
5. Visualize Data
sns.histplot(df['Sales']) plt.title('Sales Distribution') plt.show() sns.boxplot(x='Category', y='Sales', data=df) plt.title('Sales by Category') plt.show()
6. Analyze Trends
monthly_sales = df.groupby('Month')['Sales'].sum() monthly_sales.plot(kind='line', title='Monthly Sales Trend') plt.xlabel('Month') plt.ylabel('Sales') plt.show()
Tips for Effective Data Analysis
Understand the context and source of your data.
Always check for missing or inconsistent data.
Visualize patterns before jumping into conclusions.
Automate repetitive tasks with reusable scripts or functions.
Use Jupyter Notebooks for interactive analysis and documentation.
Advanced Topics to Explore
Time Series Analysis
Data Wrangling with Pandas
Statistical Testing and Inference
Predictive Modeling with Scikit-learn
Interactive Dashboards with Plotly or Streamlit
Conclusion
Python makes data analysis accessible and efficient for beginners and professionals alike. With the right libraries and a structured approach, you can gain valuable insights from raw data and make data-driven decisions. Start experimenting with datasets, and soon you'll be crafting insightful reports and visualizations with ease!
0 notes
Text

🚀 Crack Your Next Python Pandas Interview! 🐼💡 Are you preparing for a data science or Python developer interview? 📊 Get ahead with these essential Pandas interview questions covering: ✅ DataFrames & Series Basics ✅ Indexing & Slicing ✅ Data Cleaning & Manipulation ✅ GroupBy & Aggregations ✅ Merging & Joins ✅ Performance Optimization Master these concepts and boost your confidence! 💪 👉 https://bit.ly/41KQ1DR 💬 What’s the toughest Pandas question you’ve faced? Drop it in the comments! ⬇️
1 note
·
View note
Text
What are the top Python libraries for data science in 2025? Get Best Data Analyst Certification Course by SLA Consultants India
Python's extensive ecosystem of libraries has been instrumental in advancing data science, offering tools for data manipulation, visualization, machine learning, and more. As of 2025, several Python libraries have emerged as top choices for data scientists:
1. NumPy
NumPy remains foundational for numerical computations in Python. It provides support for large, multi-dimensional arrays and matrices, along with a collection of mathematical functions to operate on them. Its efficiency and performance make it indispensable for data analysis tasks. Data Analyst Course in Delhi
2. Pandas
Pandas is essential for data manipulation and analysis. It offers data structures like DataFrames, which allow for efficient handling and analysis of structured data. With tools for reading and writing data between in-memory structures and various formats, Pandas simplifies data preprocessing and cleaning.
3. Matplotlib
For data visualization, Matplotlib is a versatile library that enables the creation of static, animated, and interactive plots. It supports various plot types, including line plots, scatter plots, and histograms, making it a staple for presenting data insights.
4. Seaborn
Built on top of Matplotlib, Seaborn provides a high-level interface for drawing attractive statistical graphics. It simplifies complex visualization tasks and integrates seamlessly with Pandas data structures, enhancing the aesthetic appeal and interpretability of plots. Data Analyst Training Course in Delhi
5. Plotly
Plotly is renowned for creating interactive and web-ready plots. It offers a wide range of chart types, including 3D plots and contour plots, and is particularly useful for dashboards and interactive data applications.
6. Scikit-Learn
Scikit-Learn is a comprehensive library for machine learning, providing simple and efficient tools for data mining and data analysis. It supports various machine learning tasks, including classification, regression, clustering, and dimensionality reduction, and is built on NumPy, SciPy, and Matplotlib. Data Analyst Training Institute in Delhi
7. Dask
Dask is a parallel computing library that scales Python code from multi-core local machines to large distributed clusters. It integrates seamlessly with libraries like NumPy and Pandas, enabling scalable and efficient computation on large datasets.
8. PyMC
PyMC is a probabilistic programming library for Bayesian statistical modeling and probabilistic machine learning. It utilizes advanced Markov chain Monte Carlo and variational fitting algorithms, making it suitable for complex statistical modeling.
9. TensorFlow and PyTorch
Both TensorFlow and PyTorch are leading libraries for deep learning. They offer robust tools for building and training neural networks and have extensive communities supporting their development and application in various domains, from image recognition to natural language processing. Online Data Analyst Course in Delhi
10. NLTK and SpaCy
For natural language processing (NLP), NLTK and SpaCy are prominent libraries. NLTK provides a wide range of tools for text processing, while SpaCy is designed for industrial-strength NLP, offering fast and efficient tools for tasks like tokenization, parsing, and entity recognition.

These libraries collectively empower data scientists to efficiently process, analyze, and visualize data, facilitating the extraction of meaningful insights and the development of predictive models.
Data Analyst Training Course Modules Module 1 - Basic and Advanced Excel With Dashboard and Excel Analytics Module 2 - VBA / Macros - Automation Reporting, User Form and Dashboard Module 3 - SQL and MS Access - Data Manipulation, Queries, Scripts and Server Connection - MIS and Data Analytics Module 4 - MS Power BI | Tableau Both BI & Data Visualization Module 5 - Free Python Data Science | Alteryx/ R Programing Module 6 - Python Data Science and Machine Learning - 100% Free in Offer - by IIT/NIT Alumni Trainer
Regarding the "Best Data Analyst Certification Course by SLA Consultants India," I couldn't find specific information on such a course in the provided search results. For the most accurate and up-to-date details, I recommend visiting SLA Consultants India's official website or contacting them directly to inquire about their data analyst certification offerings. For more details Call: +91-8700575874 or Email: [email protected]
0 notes
Text
Data Sorting Techniques: Master Pandas for Efficient Data Analysis
Master data sorting and ranking techniques using Python's Pandas library. Learn practical examples, advanced methods, and best practices for efficient data analysis. Perfect for data scientists and analysts.
Data sorting, ranking analysis, and Pandas DataFrame manipulation are essential skills for any data scientist. In this comprehensive guide, we’ll explore powerful sorting techniques and ranking methods that will transform your data analysis workflow. Furthermore, we’ll dive into practical examples using Python’s Pandas library to demonstrate these concepts effectively. Understanding Basic Data…
0 notes