#Data Science & Analytics
Explore tagged Tumblr posts
Visit Tumblr Blog
Explore Tumblr blogs with no restrictions, modern design and the best experience.
Last Seen Tumblr Blogs


Fun Fact
BuzzFeed published a report claiming that Tumblr was utilized as a distribution channel for Russian agents to influence American voting habits during the 2016 presidential election in Feb 2018.
Text

In today’s data-driven world, leveraging data science analytics is essential for staying ahead of the curve. By transforming raw data into actionable insights, businesses can optimize operations, enhance customer experiences, predict market trends, and drive strategic decision-making.
0 notes
Text
Whiz.ai: Elevating Data Science Analytics for Deeper Business Insights

Whiz.ai leverages advanced data science analytics to help businesses uncover deeper insights and drive smarter decisions. By integrating AI-powered solutions, it transforms complex data into meaningful, actionable results, empowering organizations to stay ahead in a data-driven world.
0 notes
Text
Why the Number Zero Changed Everything
Zero: a concept so foundational to modern mathematics, science, and technology that we often forget it wasn’t always there. Its presence in our world today seems obvious, but its journey from controversial abstraction to indispensable tool has shaped entire civilizations.
1. The Birth of Zero: A Revolutionary Idea
The concept of zero didn't exist in many ancient cultures. For example, the Greeks, despite their advancements in geometry and number theory, rejected the idea of a placeholder for nothingness. The Babylonians had a placeholder symbol (a space or two slashes) for zero, but they didn't treat it as a number. It wasn't until Indian mathematicians in the 5th century, like Brahmagupta, that zero was truly conceptualized and treated as a number with its own properties.
Zero was initially used as a place-holder in the decimal system, but soon evolved into a full-fledged number with mathematical properties, marking a huge leap in human cognition.
2. The Birth of Algebra
Imagine trying to solve equations like x + 5 = 0 without zero. With zero, algebra becomes solvable, opening up entire fields of study. Before zero’s arrival, solving equations involving unknowns was rudimentary, relying on geometric methods. The Indian mathematician Brahmagupta (again) was one of the first to establish rules for zero in algebraic operations, such as:
x + 0 = x (additive identity)
x × 0 = 0 (multiplicative property)
These properties allowed algebra to evolve into a system of abstract thought rather than just arithmetic, transforming the ways we understand equations, functions, and polynomials.
3. Calculus and Zero: A Relationship Built on Limits
Without zero, the foundation of calculus—limits, derivatives, and integrals—wouldn’t exist. The limit concept is intrinsically tied to approaching zero as a boundary. In differentiation, the derivative of a function f(x) is defined as:
f'(x) = \lim_{h \to 0} \frac{f(x+h) - f(x)}{h}
This limit process hinges on the ability to manipulate and conceptualize zero in infinitesimal quantities. Similarly, integrals, which form the backbone of area under curves and summation of continuous data, rely on summing infinitely small quantities—essentially working with zero.
Without the concept of zero, we wouldn’t have the means to rigorously define rates of change or accumulation, effectively stalling physics, engineering, and economics.
4. Zero and the Concept of Nothingness: The Philosophical Impact
Zero is more than just a number; it’s an idea that forces us to confront nothingness. Its acceptance was met with philosophical resistance in ancient times. How could "nothing" be real? How could nothing be useful in equations? But once mathematicians recognized zero as a number in its own right, it transformed entire philosophical discussions. It even challenged ideas in theology (e.g., the nature of creation and void).
In set theory, zero is the size of the empty set—the set that contains no elements. But without zero, there would be no way to express or manipulate sets of nothing. Thus, zero's philosophical acceptance paved the way for advanced theories in logic and mathematical foundations.
5. The Computing Revolution: Zero as a Binary Foundation
Fast forward to today. Every piece of digital technology—from computers to smartphones—relies on binary systems: sequences of 1s and 0s. These two digits are the fundamental building blocks of computer operations. The idea of Boolean algebra, where values are either true (1) or false (0), is deeply rooted in zero’s ability to represent "nothing" or "off."
The computational world relies on logical gates, where zero is interpreted as false, allowing us to build anything from a basic calculator to the complex AI systems that drive modern technology. Zero, in this context, is as important as one—and it's been essential in shaping the digital age.
6. Zero and Its Role in Modern Fields
In modern fields like physics and economics, zero plays a crucial role in explaining natural phenomena and building theories. For instance:
In physics, zero-point energy (the lowest possible energy state) describes phenomena in quantum mechanics and cosmology.
In economics, zero is the reference point for economic equilibrium, and the concept of "breaking even" relies on zero profit/loss.
Zero allows us to make sense of the world, whether we’re measuring the empty vacuum of space or examining the marginal cost of producing one more unit in economics.
7. The Mathematical Utility of Zero
Zero is essential in defining negative numbers. Without zero as the boundary between positive and negative values, our number system would collapse. The number line itself relies on zero as the anchor point, dividing positive and negative values. Vector spaces, a fundamental structure in linear algebra, depend on the concept of a zero vector as the additive identity.
The coordinate system and graphs we use to model data in statistics, geometry, and trigonometry would not function as we know them today. Without zero, there could be no Cartesian plane, and concepts like distance, midpoint, and slope would be incoherent.
#mathematics#math#mathematician#mathblr#mathposting#calculus#geometry#algebra#numbertheory#mathart#STEM#science#academia#Academic Life#math academia#math academics#math is beautiful#math graphs#math chaos#math elegance#education#technology#statistics#data analytics#math quotes#math is fun#math student#STEM student#math education#math community
63 notes
·
View notes
Text
youtube
How To Learn Math for Machine Learning FAST (Even With Zero Math Background)
I dropped out of high school and managed to became an Applied Scientist at Amazon by self-learning math (and other ML skills). In this video I'll show you exactly how I did it, sharing the resources and study techniques that worked for me, along with practical advice on what math you actually need (and don't need) to break into machine learning and data science.
#How To Learn Math for Machine Learning#machine learning#free education#education#youtube#technology#educate yourselves#educate yourself#tips and tricks#software engineering#data science#artificial intelligence#data analytics#data science course#math#mathematics#Youtube
22 notes
·
View notes
Text
data analysis is rly like
it's so over we're so back it's so over we're so back it's so over
i know, i know, negative results don't make my work any less valid but cmon please give me something
#science#stem#stemblr#academia#studyblr#neuroscience#stem student#data#data analytics#data analysis#research
45 notes
·
View notes
Text
4/7 exams ✅
Honestly the exams were better than expected for the amount I studied, more specifically the way I studied, it seems like I can't get a hold on how I should study and just end up stuffing my brain with information which I will forget soon...? And also I'm too tired to study because of the travelling 🥲I really need to learn how to drive. Anyways here are the cats I saw and also cat motivation to study over the weekend ^^
~✿


#studyblr#study blog#exams#exam stress#study motivation#uni student#university#university life#student life#studying#programming#data analytics#data science#data scientist#chaotic academia#cats#study#studyblr community#study method
17 notes
·
View notes
Text
thinking about how in one of the more recent videos Kurtis was like. I know my audience it's mostly lesbians. and that episode of make some noise where sam reich was like. yeah our audience is 20 smth women. and how jermas audience analytics is like. 40% women 20% nonbinary . and how then northernlion has a 2% female viewership ranking.
#that shit is goofy as hell#im sorry it just is#i love thinking about audience analytics and gender distribution<- data science major
15 notes
·
View notes
Text
The Data Scientist Handbook 2024
HT @dataelixir
#data science#data scientist#data scientists#machine learning#analytics#data analytics#artificial intelligence
18 notes
·
View notes
Text

Elevate Your Brand, Rule the Digital Space with Cybrom Technology.
#digital marketing#Social media marketing#Data science#data analytics#data analyst course#seo#search engine optimization#google ads
5 notes
·
View notes
Text
Harness Data Science Analytics for Smarter Decision-Making and Accelerated Growth
0 notes
Text
The Math of Social Networks: How Social Media Algorithms Work
In the digital age, social media platforms like Instagram, Facebook, and TikTok are fueled by complex mathematical algorithms that determine what you see in your feed, who you follow, and what content "goes viral." These algorithms rely heavily on graph theory, matrix operations, and probabilistic models to connect billions of users, influencers, and posts in increasingly intricate webs of relationships.
Graph Theory: The Backbone of Social Networks
Social media platforms can be visualized as graphs, where each user is a node and each connection (whether it’s a "follow," "like," or "comment") is an edge. The structure of these graphs is far from random. In fact, they follow certain mathematical properties that can be analyzed using graph theory.
For example, cliques (a subset of users where everyone is connected to each other) are common in influencer networks. These clusters of interconnected users help drive trends by amplifying each other’s content. The degree of a node (a user’s number of direct connections) is a key factor in visibility, influencing how posts spread across the platform.
Additionally, the famous Six Degrees of Separation theory, which posits that any two people are connected by no more than six intermediaries, can be modeled using small-world networks. In these networks, most users are not directly connected to each other, but the distance between any two users (in terms of number of connections) is surprisingly short. This is the mathematical magic behind viral content, as a post can be shared through a small network of highly connected individuals and reach millions of users.
Matrix Operations: Modeling Connections and Relevance
When social media platforms recommend posts, they often rely on matrix operations to model relationships between users and content. This process can be broken down into several steps:
User-Content Matrix: A matrix is created where each row represents a user and each column represents a piece of content (post, video, etc.). Each cell in this matrix could hold values indicating the user’s interactions with the content (e.g., likes, comments, shares).
Matrix Factorization: To make recommendations, platforms use matrix factorization techniques such as singular value decomposition (SVD). This helps reduce the complexity of the data by identifying latent factors that explain user preferences, enabling platforms to predict what content a user is likely to engage with next.
Personalization: This factorization results in a model that can predict a user’s preferences even for content they’ve never seen before, creating a personalized feed. The goal is to minimize the error matrix, where the predicted interactions match the actual interactions as closely as possible.
Influence and Virality: The Power of Centrality and Weighted Graphs
Not all users are equal when it comes to influencing the network. The concept of centrality measures the importance of a node within a graph, and in social media, this directly correlates with a user’s ability to shape trends and drive engagement. Common types of centrality include:
Degree centrality: Simply the number of direct connections a user has. Highly connected users (like influencers) are often at the core of viral content propagation.
Betweenness centrality: This measures how often a user acts as a bridge along the shortest path between two other users. A user with high betweenness centrality can facilitate the spread of information across different parts of the network.
Eigenvector centrality: A more sophisticated measure that not only considers the number of connections but also the quality of those connections. A user with high eigenvector centrality is well-connected to other important users, enhancing their influence.
Algorithms and Machine Learning: Predicting What You See
The most sophisticated social media platforms integrate machine learning algorithms to predict which posts will generate the most engagement. These models are often trained on vast amounts of user data (likes, shares, comments, time spent on content, etc.) to determine the factors that influence user interaction.
The ranking algorithms take these factors into account to assign each post a “score” based on its predicted engagement. For example:
Collaborative Filtering: This technique relies on past interactions to predict future preferences, where the behavior of similar users is used to recommend content.
Content-Based Filtering: This involves analyzing the content itself, such as keywords, images, or video length, to recommend similar content to users.
Hybrid Methods: These combine collaborative filtering and content-based filtering to improve accuracy.
Ethics and the Filter Bubble
While the mathematical models behind social media algorithms are powerful, they also come with ethical considerations. Filter bubbles, where users are only exposed to content they agree with or are already familiar with, can be created due to biased algorithms. This can limit exposure to diverse perspectives and create echo chambers, reinforcing existing beliefs rather than fostering healthy debate.
Furthermore, algorithmic fairness and the prevention of algorithmic bias are growing areas of research, as biased recommendations can disproportionately affect marginalized groups. For instance, if an algorithm is trained on biased data (say, excluding certain demographics), it can unfairly influence the content shown to users.
#mathematics#math#mathematician#mathblr#mathposting#calculus#geometry#algebra#numbertheory#mathart#STEM#science#academia#Academic Life#math academia#math academics#math is beautiful#math graphs#math chaos#math elegance#education#technology#statistics#data analytics#math quotes#math is fun#math student#STEM student#math education#math community
24 notes
·
View notes
Text
youtube
Statistics - A Full Lecture to learn Data Science (2025 Version)
Welcome to our comprehensive and free statistics tutorial (Full Lecture)! In this video, we'll explore essential tools and techniques that power data science and data analytics, helping us interpret data effectively. You'll gain a solid foundation in key statistical concepts and learn how to apply powerful statistical tests widely used in modern research and industry. From descriptive statistics to regression analysis and beyond, we'll guide you through each method's role in data-driven decision-making. Whether you're diving into machine learning, business intelligence, or academic research, this tutorial will equip you with the skills to analyze and interpret data with confidence. Let's get started!
#education#free education#technology#educate yourselves#educate yourself#data analysis#data science course#data science#data structure and algorithms#youtube#statistics for data science#statistics#economics#education system#learn data science#learn data analytics#Youtube
3 notes
·
View notes
Text
Understanding Outliers in Machine Learning and Data Science

In machine learning and data science, an outlier is like a misfit in a dataset. It's a data point that stands out significantly from the rest of the data. Sometimes, these outliers are errors, while other times, they reveal something truly interesting about the data. Either way, handling outliers is a crucial step in the data preprocessing stage. If left unchecked, they can skew your analysis and even mess up your machine learning models.
In this article, we will dive into:
1. What outliers are and why they matter.
2. How to detect and remove outliers using the Interquartile Range (IQR) method.
3. Using the Z-score method for outlier detection and removal.
4. How the Percentile Method and Winsorization techniques can help handle outliers.
This guide will explain each method in simple terms with Python code examples so that even beginners can follow along.
1. What Are Outliers?
An outlier is a data point that lies far outside the range of most other values in your dataset. For example, in a list of incomes, most people might earn between $30,000 and $70,000, but someone earning $5,000,000 would be an outlier.
Why Are Outliers Important?
Outliers can be problematic or insightful:
Problematic Outliers: Errors in data entry, sensor faults, or sampling issues.
Insightful Outliers: They might indicate fraud, unusual trends, or new patterns.
Types of Outliers
1. Univariate Outliers: These are extreme values in a single variable.
Example: A temperature of 300°F in a dataset about room temperatures.
2. Multivariate Outliers: These involve unusual combinations of values in multiple variables.
Example: A person with an unusually high income but a very low age.
3. Contextual Outliers: These depend on the context.
Example: A high temperature in winter might be an outlier, but not in summer.
2. Outlier Detection and Removal Using the IQR Method
The Interquartile Range (IQR) method is one of the simplest ways to detect outliers. It works by identifying the middle 50% of your data and marking anything that falls far outside this range as an outlier.
Steps:
1. Calculate the 25th percentile (Q1) and 75th percentile (Q3) of your data.
2. Compute the IQR:
{IQR} = Q3 - Q1
Q1 - 1.5 \times \text{IQR}
Q3 + 1.5 \times \text{IQR} ] 4. Anything below the lower bound or above the upper bound is an outlier.
Python Example:
import pandas as pd
# Sample dataset
data = {'Values': [12, 14, 18, 22, 25, 28, 32, 95, 100]}
df = pd.DataFrame(data)
# Calculate Q1, Q3, and IQR
Q1 = df['Values'].quantile(0.25)
Q3 = df['Values'].quantile(0.75)
IQR = Q3 - Q1
# Define the bounds
lower_bound = Q1 - 1.5 * IQR
upper_bound = Q3 + 1.5 * IQR
# Identify and remove outliers
outliers = df[(df['Values'] < lower_bound) | (df['Values'] > upper_bound)]
print("Outliers:\n", outliers)
filtered_data = df[(df['Values'] >= lower_bound) & (df['Values'] <= upper_bound)]
print("Filtered Data:\n", filtered_data)
Key Points:
The IQR method is great for univariate datasets.
It works well when the data isn’t skewed or heavily distributed.
3. Outlier Detection and Removal Using the Z-Score Method
The Z-score method measures how far a data point is from the mean, in terms of standard deviations. If a Z-score is greater than a certain threshold (commonly 3 or -3), it is considered an outlier.
Formula:
Z = \frac{(X - \mu)}{\sigma}
is the data point,
is the mean of the dataset,
is the standard deviation.
Python Example:
import numpy as np
# Sample dataset
data = {'Values': [12, 14, 18, 22, 25, 28, 32, 95, 100]}
df = pd.DataFrame(data)
# Calculate mean and standard deviation
mean = df['Values'].mean()
std_dev = df['Values'].std()
# Compute Z-scores
df['Z-Score'] = (df['Values'] - mean) / std_dev
# Identify and remove outliers
threshold = 3
outliers = df[(df['Z-Score'] > threshold) | (df['Z-Score'] < -threshold)]
print("Outliers:\n", outliers)
filtered_data = df[(df['Z-Score'] <= threshold) & (df['Z-Score'] >= -threshold)]
print("Filtered Data:\n", filtered_data)
Key Points:
The Z-score method assumes the data follows a normal distribution.
It may not work well with skewed datasets.
4. Outlier Detection Using the Percentile Method and Winsorization
Percentile Method:
In the percentile method, we define a lower percentile (e.g., 1st percentile) and an upper percentile (e.g., 99th percentile). Any value outside this range is treated as an outlier.
Winsorization:
Winsorization is a technique where outliers are not removed but replaced with the nearest acceptable value.
Python Example:
from scipy.stats.mstats import winsorize
import numpy as np
Sample data
data = [12, 14, 18, 22, 25, 28, 32, 95, 100]
Calculate percentiles
lower_percentile = np.percentile(data, 1)
upper_percentile = np.percentile(data, 99)
Identify outliers
outliers = [x for x in data if x < lower_percentile or x > upper_percentile]
print("Outliers:", outliers)
# Apply Winsorization
winsorized_data = winsorize(data, limits=[0.01, 0.01])
print("Winsorized Data:", list(winsorized_data))
Key Points:
Percentile and Winsorization methods are useful for skewed data.
Winsorization is preferred when data integrity must be preserved.
Final Thoughts
Outliers can be tricky, but understanding how to detect and handle them is a key skill in machine learning and data science. Whether you use the IQR method, Z-score, or Wins
orization, always tailor your approach to the specific dataset you’re working with.
By mastering these techniques, you’ll be able to clean your data effectively and improve the accuracy of your models.
#science#skills#programming#bigdata#books#machinelearning#artificial intelligence#python#machine learning#data centers#outliers#big data#data analysis#data analytics#data scientist#database#datascience#data
3 notes
·
View notes
Text
First Post!
Or at least, this is my first post on Tumblr since high school lol. I used to use Tumblr often a long time ago, but I left. Now I start fresh with a new account!
My name is AlgorithmQuartz. I'm 22, an INFJ, and a Capricorn Sun/Leo Moon/Libra Rising. I'm into gaming, singing, coding, witchcraft, tarot/oracle, astrology, and exploring esoteric ideas. I'm currently in school for computer science with a minor in data analytics. I'm also a practicing witch.
If any of that sounds interesting, feel free to give me a follow! I may also follow back. I've recently started making YouTube content as well, and I'm shortly going to post the couple videos I have so I can put them on the featured section of my blog. If you wanna check out my YouTube channel, then here it is!
Y e e t u s
#my posts#first post#new to tumblr#infj#cap sun#capricorn#leo moon#leo#libra rising#libra#gaming#singing#singer#gamer#coding#coder#witchcraft#witch#witchblr#tarot#oracle#astrology#esoteric#esotericism#computer science#cs#data analytics#youtube#youtuber#content creator
8 notes
·
View notes
Text
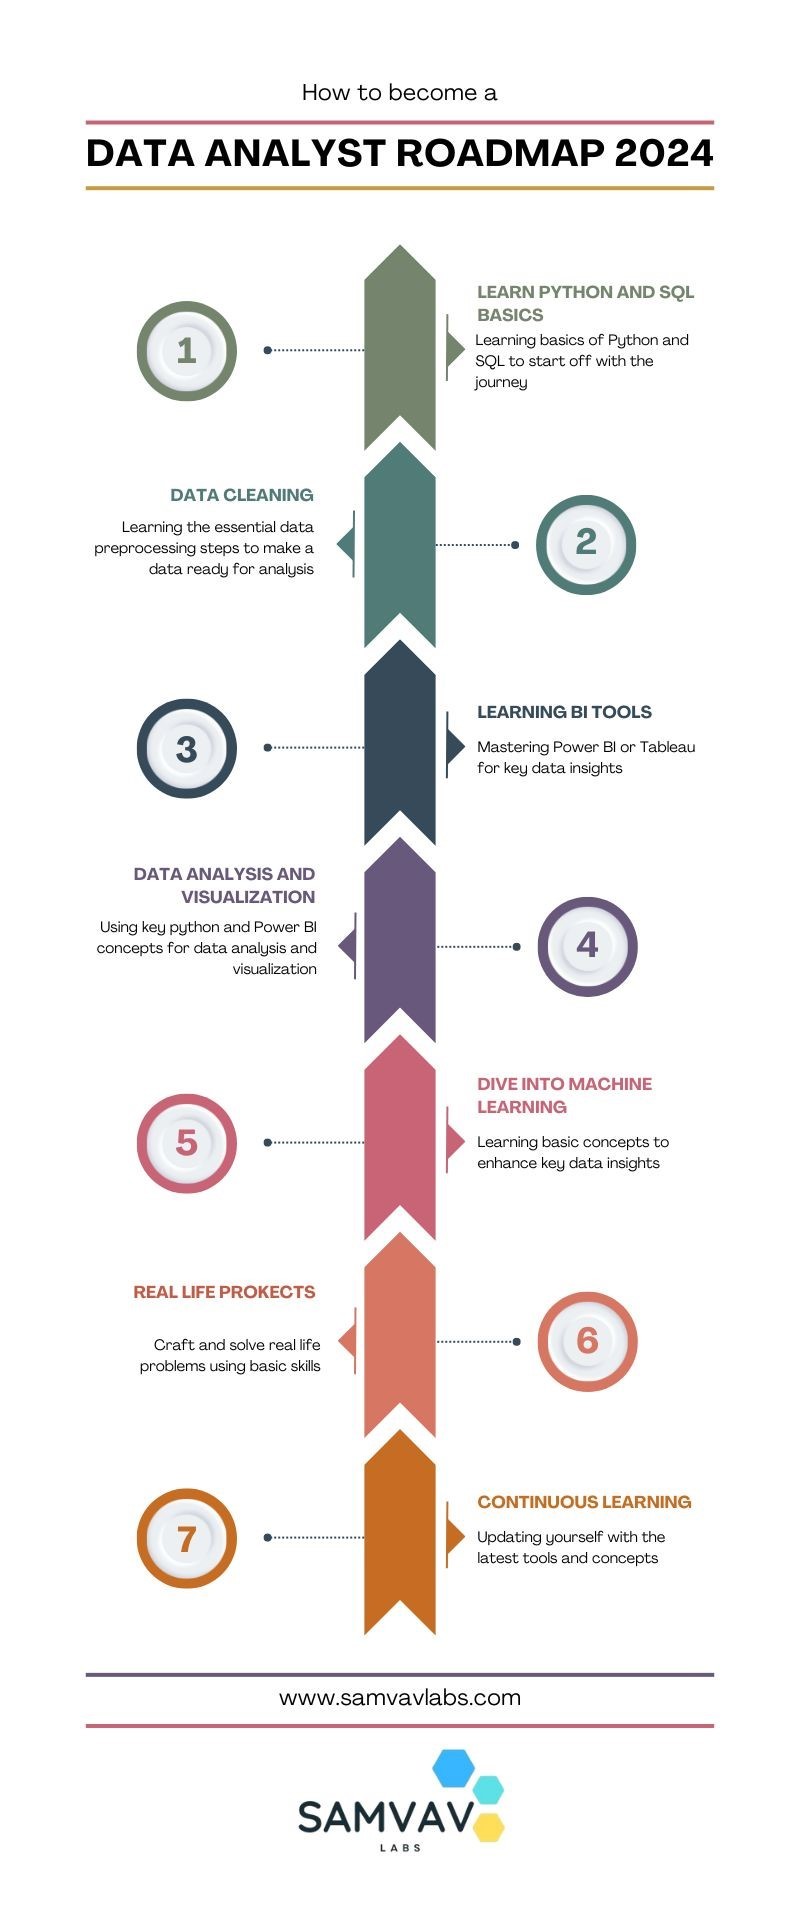
Data Analyst Roadmap for 2024!
Cracking the Data Analyst Roadmap for 2024! Kick off your journey by mastering and delving into Python for data manipulation magic, and dazzle stakeholders with insights using PowerBi or Tableau. Don't forget, that SQL proficiency and hands-on projects refine your skillset, but never overlook the importance of effective communication and problem-solving. Are you checking off these milestones on your path to success? 📌 For more details, visit our website: https://www.samvavlabs.com . . . #DataAnalyst2024 #CareerGrowth #roadmap #DataAnalyst #samvavlabs #roadmap2024 #dataanalystroadmap #datavisualization
#business analytics#data analytics#data analyst#machinelearning#data visualization#datascience#deep learning#data analyst training#dataanalystcourseinKolkata#data analyst certification#data analyst course#data science course#business analyst
9 notes
·
View notes
Text
I need Study Blogs to follow!! pls give this a like if you are one , I need to stay motivated !! :)
#codeblr#studyblr#comp sci#data analytics#python#coding#study motivation#study blog#technology#PC#sql#studying#computer science#excel#information technology#university#student life#student
7 notes
·
View notes