#Scatterplot
Explore tagged Tumblr posts
Visit Tumblr Blog
Explore Tumblr blogs with no restrictions, modern design and the best experience.
Last Seen Tumblr Blogs


Fun Fact
Tumblr has 411 employees.
Text
Common Pitfalls in Pie Charts: Best Practices for Effective Data Presentation
Data Visualization Types: Common Questions Answered
1. What types of data are best suited for heat maps, and how can they enhance the understanding of complex datasets?
Maps are best suited for quantitative data, such as statistics, frequency counts, or performance metrics across two dimensions (e.g., time and categories). They enhance understanding by visually representing variations in data intensity, making patterns, trends, and outliers easier to identify. This helps users quickly grasp complex relationships and insights within large datasets.
2. In what situations would you choose to use a scatter plot over a bubble chart, and what additional information does a bubble chart provide?
I would choose a scatter plot when comparing two variables without needing to represent a third dimension. A bubble chart is useful when I want to add a third variable, represented by the size of the bubbles, allowing for more complex data representation. This additional information helps to visualize relationships and the magnitude of values simultaneously.
3. Can you explain the concept of a treemap and discuss its advantages for displaying hierarchical data compared to traditional tree structures?
A treemap is a visual representation of hierarchical data using nested rectangles, where the size and color of each rectangle represent different metrics. Its advantages over traditional tree structures include better space utilization, easier comparison of sizes, and the ability to display complex data briefly, making patterns and relationships more accessible and interpretable.
4. What role do infographics play in data visualization, and how can they be effectively designed to enhance understanding and engagement with complex data sets?
Infographics simplify complex data by visually representing information, making it easier to understand and engage with. Effective design includes clear visuals, concise text, a logical flow, and a focus on key insights. Using color, icons, and charts can enhance clarity and attract attention, while ensuring accessibility helps reach a wider audience.
5. How do pie charts effectively communicate proportions, and what are some common pitfalls to avoid when using them?
Pie charts effectively communicate proportions by visually representing data as slices of a whole, making it easy to compare relative sizes. Each slice's angle corresponds to its proportion, aiding quick comprehension of parts versus the whole. Common pitfalls to avoid include using too many slices, which can clutter the chart and confuse viewers, and failing to label slices clearly, making interpretation difficult. Additionally, using similar colors for adjacent slices can create visual confusion. It's essential to limit categories and ensure clarity for effective communication of data.

Visit: VS Website See: VS Portfolio
0 notes
Text

Title : What is the relationship between income per person and life expectancy across different countries? Explanantion: The scatter plot below visually represents the relationship between income per person and life expectancy. It shows that as income increases, life expectancy generally tends to rise, indicating a positive correlation.
Observations:
Countries with higher income per person generally have a higher life expectancy.
There are a few outliers where life expectancy is low despite moderate income levels.
1 note
·
View note
Text
Enjoy!
#music#piano#positive attitude#neat#My mom is watching a dog show#piano music#new music#heart#dream#things get better#enjoy the music?#enjoy#scattered like a scatter plot#scatterplot#like a graph#I haven't found the correlation yet#I am not trending yet#Math puns#I hope you find them punny#if you know what i mean#I had another math test today#7 pages#but i survived#I was less than prepared for it#it was greater than I expected#things didn't add up#That is a sample of today
0 notes
Text

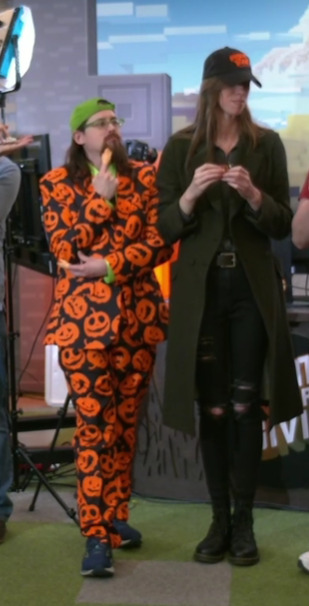

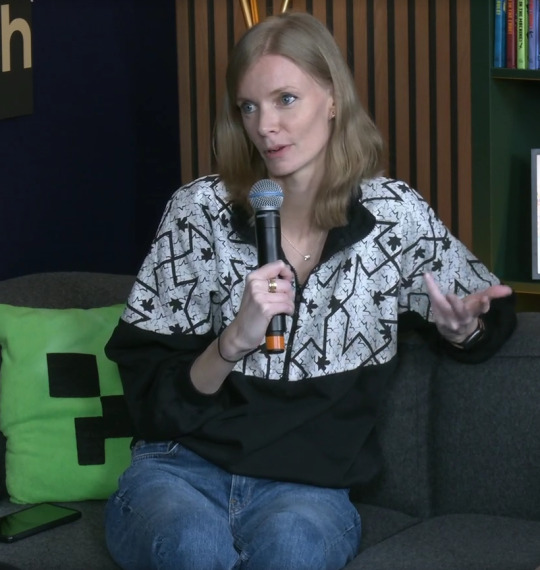
the stylish hermits!
(bonus pictures of joe bc that suit is a work of art. also uh. green man.)
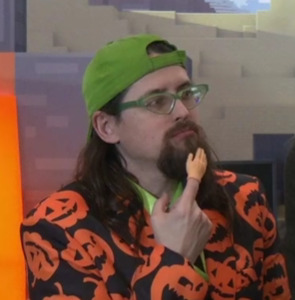


#joe hills the icon that you are#never change#so many style points all around ! but like. all different points on a scatterplot of Stylish#i find the pic of joe hills and pearl standing next to each other very funny#they r both clearly very well dressed but like. 90 degrees apart.#hermitcraft#hc charity stream 2025#hc charity event#gtws#joe hills#pearlescentmoon#geminitay#grian#falsesymmetry
1K notes
·
View notes
Note
Continued from replies,
The pigs I primarily grew up with were Petunia Poppy and Peonie and they were my own flesh and blood and older than I was, Ill have to find pictures of them, my most recent were Rhubarb and Ruby the twins we got em from a friend but had to move a few years later so we no longer have them.
tldr pigs are amazing wonderful creatures and i love my children dearly and i wish they were animals before food
AWWWWW PETUNIA POPPY PEONIE!!!!!! MATCHING FLOWER NAMES!!!!!!!!! And Rhubarb and Ruby, oh my heart TToTT I bet they were loving companions in the time that you did have them. <333
7 notes
·
View notes
Note
objectum culture is crying when your beloves screen cracks, she works but my darling mp3 is forever scarred and i feel terrible :(
on a happier note its also seeing your beloved boot up after charging them and seeing their beautiful screen glow , she supplies me so wonderfully with music and im proud to say shes been mine for five and a half years
.
18 notes
·
View notes
Note
Okay, so, would you ever do a poll of the ships like Moceit, Prinxiety, Logicality, etc? And if so, could the song be Brainwashed by Waterparks?
youtube
What's up? Hello, I'm tryna meet ya Shocked at the words coming from my tongue A language that I'm not familiar Don't take it away, I wanna play, where did the time fly? What if I pray? Hoping you'll stay into the daylight Wait, what am I saying? I feel insane It's only been a couple days
I'm having the same thoughts, can't stop Thinking you got me brainwashed I'm see-through, need you Why do I think you're so cool? Everything's clean except for my thoughts (yeah) Thinking about me getting you off It's been a week, I'm still at your house I don't wanna leave, it's freaking me out I don't wanna leave, it's freaking me out
Why am I acting like that? My day's fucked 'til you finally wanna text back I put some extra on my laugh when you say things Are you really that funny or am I hallucinating? Like I'm slipping away, living the life, open the floodgates Give me my space, give me your face at the same time It's like my brain isn't mine, you moved into my mind Dropped your bags, drew the blinds
Now I'm having those same thoughts, can't stop Thinking you got me brainwashed I'm see-through, need you Why do I think you're so cool? Everything's clean except for my thoughts (yeah) Thinking about me getting you off It's been a week, I'm still at your house I don't wanna leave, it's freaking me out I don't wanna leave, it's freaking me out
The syndrome feels Stockholm I'm like "Do you wanna keep me on lock though?", Yeah Symmetrical feelings match best when we're staring at the ceiling (yeah) The syndrome feels Stockholm I'm like "Do you wanna keep me on lock though?", Yeah Symmetrical feelings match best when we're staring at the ceiling
I'm having those same thoughts, can't stop Thinking you got me brainwashed I'm see-through, need you Why do I think you're so cool? Everything's clean except for my thoughts (yeah) Thinking about me getting you off (getting you off) It's been a week, I'm still at your house I don't wanna leave, it's freaking me out I don't wanna leave, it's freaking me out (Yeah)
#hey my friend likes this artist thats cool#shoutout scatterplot ily#this is their names instead of shipnames cuz for the life of me i cant remember any besides logan and janus ships??#sanders sides#patton sanders#thomas sanders#remus sanders#logan sanders#music#virgil sanders#roman sanders#poll#polls
3 notes
·
View notes
Text
we learned about scatterplots in math today... or as my teacher says it skaterplots! ;D
#her accent makes math fun! ;)#and scatterplots are a calculator thing so it's less pencil work! ;D#she told us that a former student used them to calculate gas station cigarette shipments! :o#today he's the manager of the gas station! :D#but the cigs that got him there are long gone... ;)
3 notes
·
View notes
Note
Please choose either Seokjin or Hoseok for a 90s story. It would be so good. Imagine Hoseok in 90s street clothing😩


UR RIGHT BC tracksuits??? snapbacks??? streetwear oh don’t get me started i’m gonna riot‼️ this man already got the avirex too like—

that’s a 90s heart throb right there😩🦋🦋
#you must be a scatterplot#bc you got sO many points !!#anon#fboy!bangtan#asks:hnm#*ryenfictalk#mailbox💌
32 notes
·
View notes
Text
The Power of Line Charts in Data Analysis
Data Visualization Chart Types: Common Queries Answered
1. What are the most common types of data visualization charts?
The most common types of data visualization charts include bar charts, line charts, pie charts, scatter plots, histograms, and area charts. Each type serves different purposes, such as comparing categories, showing trends over time, displaying proportions, and illustrating relationships between variables. Choosing the right chart depends on the data and the insights you want to convey.
2. How do I choose the right data visualization chart for my data?
To choose the right data visualization chart, consider the type of data you have: use bar charts for comparisons, line charts for trends over time, pie charts for parts of a whole, and scatter plots for relationships. Also, think about your audience and the story you want to tell, ensuring clarity and effectiveness in your presentation.
3. What are the differences between bar charts and pie charts in data visualization?
Bar charts display data using rectangular bars to represent values, making it easy to compare different categories. Pie charts represent parts of a whole with slices of a circle, illustrating proportions. Bar charts are better for comparing quantities, while pie charts are effective for showing percentage distributions. Each serves different purposes in data visualization.
4. What is the purpose of a scatter plot in data visualization?
A scatter plot is used in data visualization to display the relationship between two quantitative variables. It helps identify patterns, trends, correlations, or clusters within the data. By plotting individual data points, it allows for easy observation of how changes in one variable may affect another, making it a valuable tool for analysis and interpretation.
5. How do line charts help in visualizing trends over time?
Line charts display data points connected by lines, making it easy to see trends over time. They highlight increases or decreases in values, allowing for quick comparisons between different time periods. The continuous nature of the lines helps identify patterns, fluctuations, and overall progress, making it a powerful tool for analyzing changes and forecasting future behavior.

Visit: VS Website See: VS Portfolio
0 notes
Note
*looks around* *transes your gender* *runs away*
that's like hitting a chicken with a beam that turns things into chickens
#chat noir#i know it's buried now but i answered an ask saying my gender is a scatterplot and it still holds true
26 notes
·
View notes
Note
Wait you do science? Math? Graphs???? I thought you were a linguistics… something.
Anyway u seem even smarter and more intimidating now, sorry 😅
i'm a bio major (unofficial ecology focus, since my uni doesn't offer any official ones) and a linguistics minor! one thing i am NOT is any good at the things i've chosen to study. so please don't feel intimidated i know jack shit about everything
#that's actually a lie i now know how to make datapoints on a scatterplot pink and purple in R#asks#anon
11 notes
·
View notes
Text
my mentor? asking me for help?! oh o kay
1 note
·
View note
Text
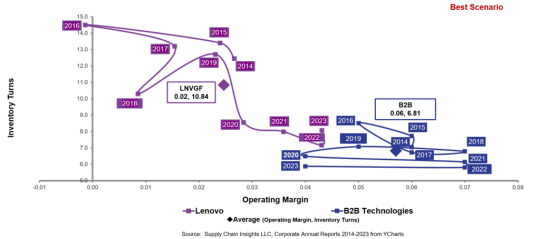
A Story of Supply Chain Excellence
Lora Cecere, the Supply Chain Shaman, is one of my favorite writers about supply chain issues. She’s always right on target with ideas and metrics that aid companies in the pursuit of supply chain improvements. And she’s the essence of simplicity; it’s never that complicated to do, though the ideas may embody complex interactions and reactions. This article is an example. Lora and her assistant,…
View On WordPress
#business dataset#connected scatterplots#Gartner Top 25 Supply Chains#industry standard#inventory turns#Logistics#operating margin#orbit charts#supply chain analysis#supply chain improvements#supply chain issues#supply chain metrics#supply chain performance#Supply Chain Shaman#supply chains
0 notes
Text
why the fuck did my coworker last night saying "only half study" change my entire mindset on how i'm going to study for my math midterm
#i can't do scatterplots#i don't understand them and it's been years and being taught them four different ways#so why the fuck am i going to aggravate myself studying scatterplots when i KNOW ill get them wrong anyway#i'll just put that energy towards stuff i have a better chance at getting right#apersonwhoshouldbestudying#<- literally this time
1 note
·
View note
Text
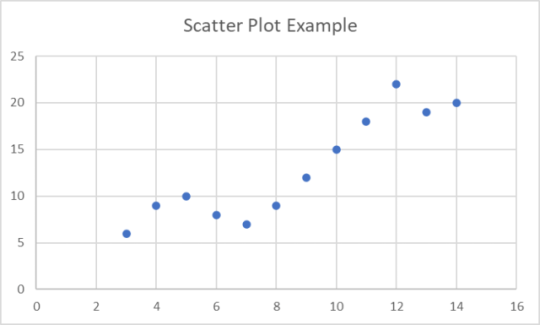
What is Scatterplots | FusionCharts
A scatterplot is a type of data visualization that shows the relationship between two variables. It plots the data point on a graph, with the horizontal axis representing one variable and the vertical axis representing the other. Scatterplots are useful for showing patterns and trends in data, as well as for identifying outliers.
0 notes